. 2022 Jul 1;10(7):885-899.
doi: 10.1158/2326-6066.CIR-20-0736.

Systemic Immune Dysfunction in Cancer Patients Driven by IL6 Induction of LAG3 in Peripheral CD8+ T Cells

Affiliations

Systemic Immune Dysfunction in Cancer Patients Driven by IL6 Induction of LAG3 in Peripheral CD8+ T Cells

Ashwin Somasundaram et al. Cancer Immunol Res. .

Abstract

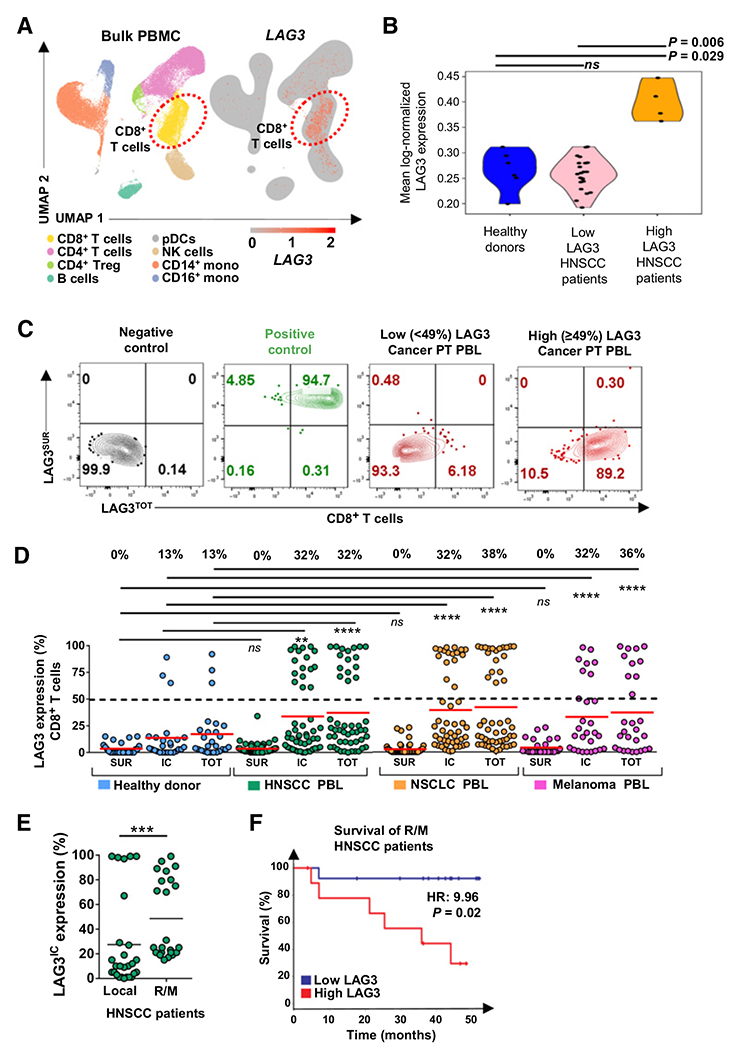
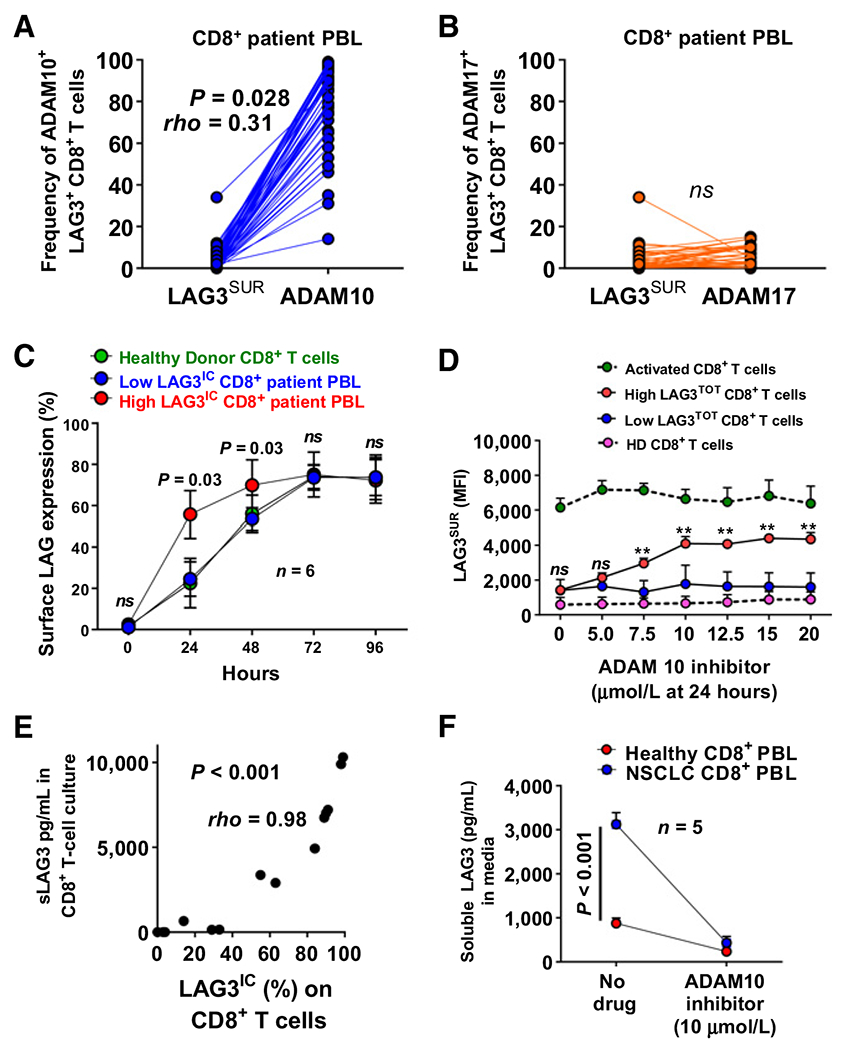
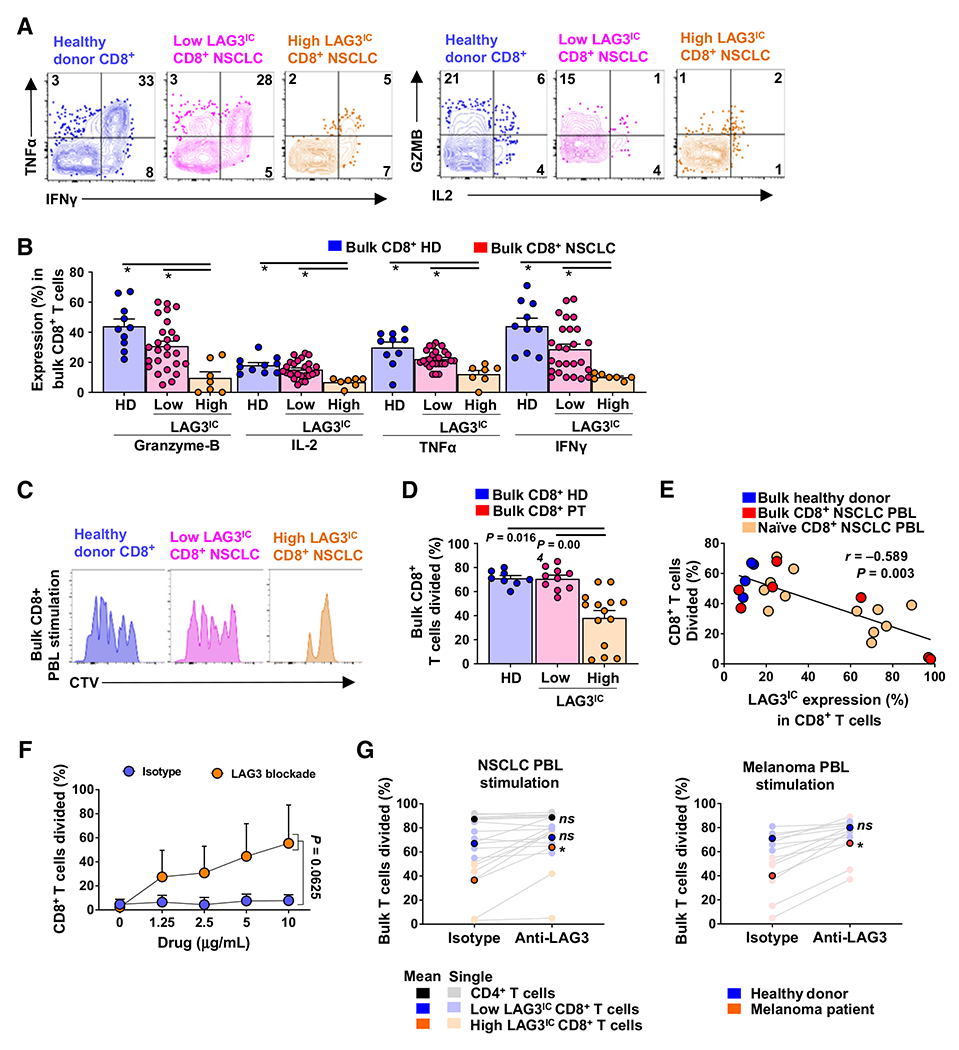
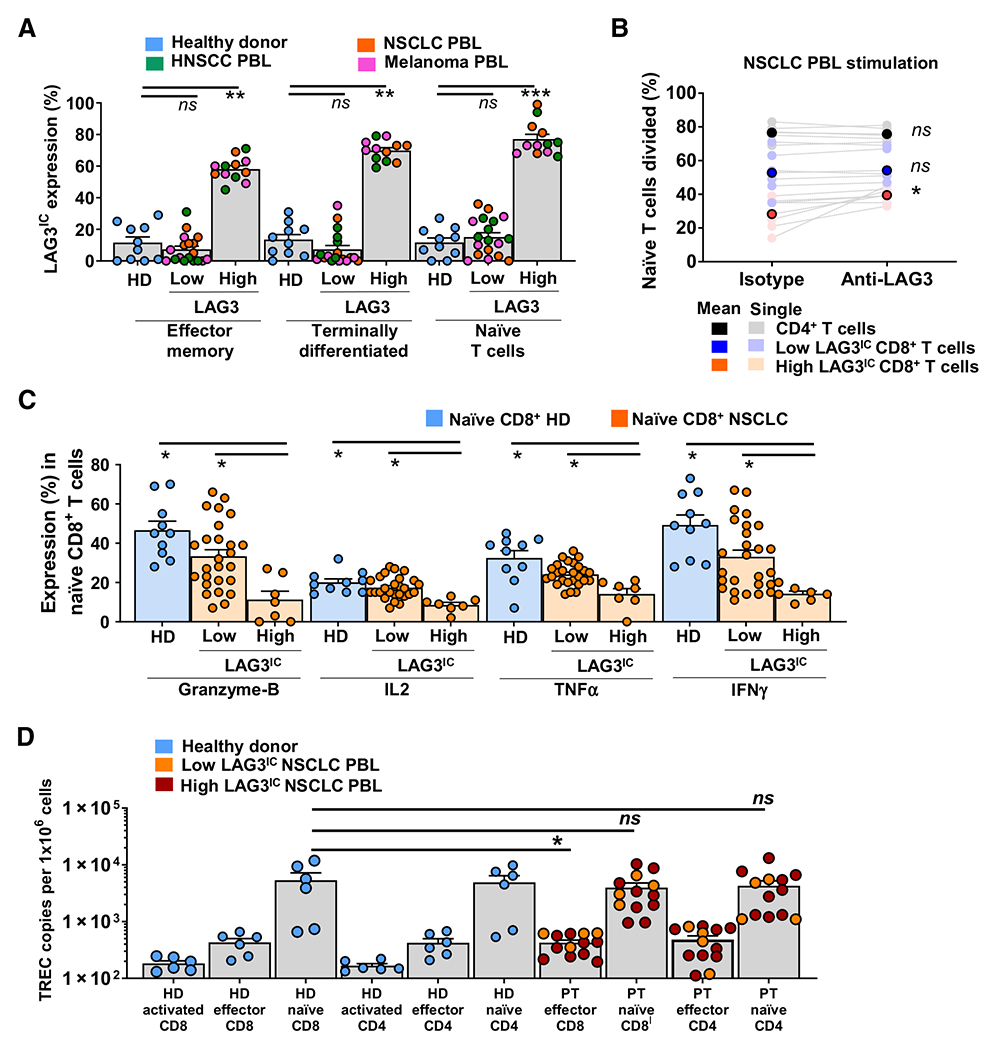
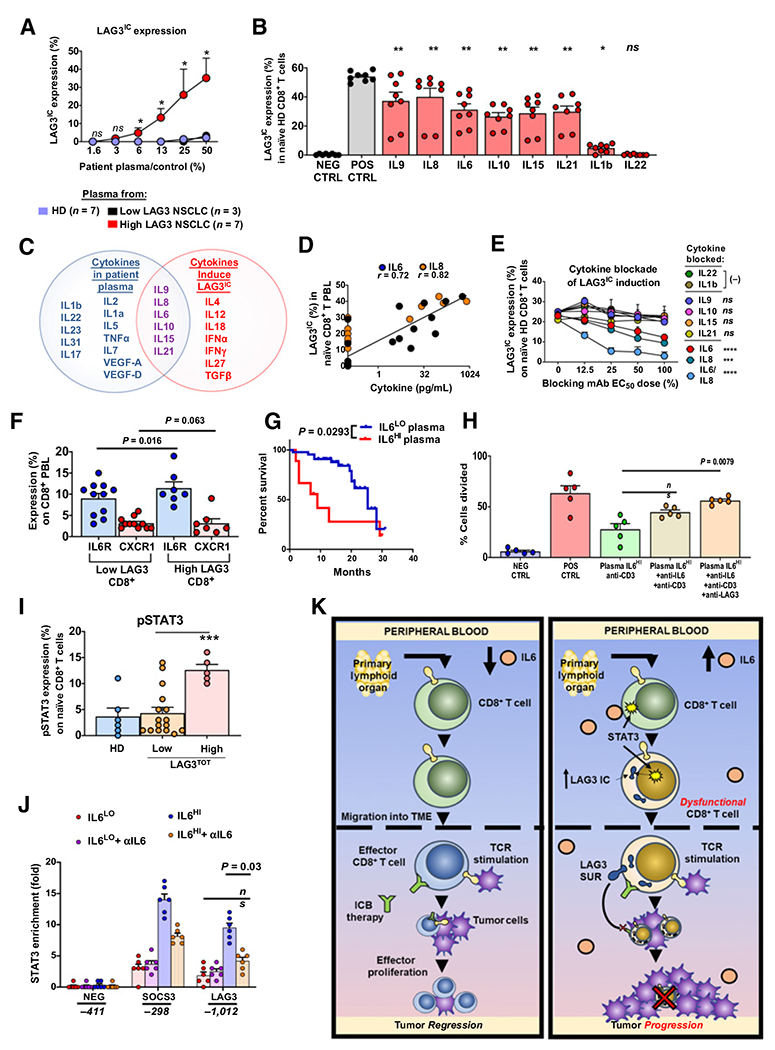
Many cancer patients do not develop a durable response to the current standard-of-care immunotherapies, despite substantial advances in targeting immune inhibitory receptors. A potential compounding issue, which may serve as an unappreciated, dominant resistance mechanism, is an inherent systemic immune dysfunction that is often associated with advanced cancer. Minimal response to inhibitory receptor (IR) blockade therapy and increased disease burden have been associated with peripheral CD8+ T-cell dysfunction, characterized by suboptimal T-cell proliferation and chronic expression of IRs (e.g., PD1 and LAG3). Here, we demonstrated that approximately a third of cancer patients analyzed in this study have peripheral CD8+ T cells that expressed robust intracellular LAG3 (LAG3IC), but not surface LAG3 (LAG3SUR) due to a disintegrin and metalloproteinase domain-containing protein 10 (ADAM10) cleavage. This is associated with poor disease prognosis and decreased CD8+ T-cell function, which could be partially reversed by anti-LAG3. Systemic immune dysfunction was restricted to CD8+ T cells, including, in some cases, a high percentage of peripheral naïve CD8+ T cells, and was driven by the cytokine IL6 via STAT3. These data suggest that additional studies are warranted to determine if the combination of increased LAG3IC in peripheral CD8+ T cells and elevated systemic IL6 can serve as predictive biomarkers and identify which cancer patients may benefit from LAG3 blockade.


Figures

Figure 1.
Figure 1.
Intracellular LAG3 in peripheral CD8+ T cells of cancer patients is associated with advanced disease and worsened clinical outcomes. A, Utilizing scRNA-seq, tSNE plots of unsupervised clustering of 26 HNSCC patients and 6 HD samples by cell type, with LAG3 (red) gene expression indicated across cell types. Mono: monocytes; pDCs: plasmacytoid DCs. B, Mean log-normalized LAG3 expression in CD8+ PBLs from HDs (n = 6), low LAG3 HNSCC patients (n = 22), high LAG3 HNSCC patients (n = 4). For LAG3 expression across groups from panel a represented in a violin plot, the omnibus linear model (ANOVA) P = 8.3×10⁻⁸ with raw (Bonferroni corrected) P values for group comparisons: HD vs. LAG3-lo: 0.52 (1.0), HD vs. LAG3-hi: 0.0095 (0.029), LAG3-lo vs. LAG3-hi: 0.0020 (0.0060). C, Representative flow-cytometric plots of total LAG3 (LAG3TOT) and surface LAG3 (LAG3SUR) on CD8+ T cells from an HD (black), CD8+ T cells activated with anti-CD3 (0.5 μg/mL) and anti-CD28 (1 μg/mL) as a positive control (green), CD8+ T cells from a patient with low (<49%) intracellular LAG3 on CD8+ T cells and from a patient with high (≥49%) intracellular LAG3 on CD8+ T cells (red) and where bars represent mean. D, Surface (SUR), intracellular (IC), and total (TOT) LAG3 expression by flow cytometry in HNSCC (green; n = 50), NSCLC (orange; n = 50), metastatic melanoma (pink; n = 28), and HD PBLs (blue; n = 26) across CD8+ T cells (see Supplementary Table S1). A mean cutoff of greater ≥49% LAG3IC expression is represented by the black dashed line. Percent of patients above the mean cutoff is noted above the statistics. *, P < 0.05; ***, P < 0.001; ****, P < 0.0001; ns = not significant or P > 0.05, Wilcoxon pairs test. E, Comparison of LAG3IC expression utilizing flow cytometry from local vs. recurrent/metastatic (R/M) HNSCC patients from D. ***, P < 0.001, Wilcoxon pairs test. F, Survival of patients with low (<49%; 13 patients) LAG3IC CD8+ PBLs (blue) and high (≥49%; 10 patients) LAG3IC CD8+ PBLs from the R/M subgroup in E. Hazard ratio (HR) of 9.96 (95% confidence interval: 1.176-177; log-rank test P = 0.02) after multivariate analysis including future treatments (systemic therapy vs. local therapy alone), gender, tobacco use, and HPV status. P value indicated, Wilcoxon pairs test (two overall experiments completed with panels representing additional analyses).
Figure 2.
Figure 2.
LAG3 is stored intracellularly in peripheral CD8+ T cells and traffics to the cell surface with TCR stimulation, followed by rapid shedding via ADAM10. A, Spearman correlation of matched ADAM10 and LAG3SUR expression on CD8+ T cells from HNSCC patients (n = 49) by flow cytometry. Statistical significance determined by Wilcoxon signed-rank test, ns: not significant, P > 0.05; *, P ≤ 0.05; **, P ≤ 0.01; ***, P ≤ 0.001; ****, P ≤ 0.0001. B, Spearman correlation of matched ADAM17 and LAG3SUR expression on CD8+ T cells from HNSCC patients (n = 49) by flow cytometry. Statistical significance determined by Wilcoxon signed-rank test; ns, not significant, P > 0.05; *, P ≤ 0.05; **, P ≤ 0.01; ***, P ≤ 0.001; ****, P ≤ 0.0001. C, Surface LAG3 expression by flow cytometry over time in CD8+ T cells from HDs (n = 6), low LAG3 NSCLC patients (n = 6), and high LAG3 NSCLC patients (n = 6) during stimulation with anti-CD3 (0.5μg/mL) in the presence of matched 1:1 APCs. P value indicated, Wilcoxon pairs test. Error bars, SEM. D, LAG3SUR expression by mean fluorescence intensity (MFI) with flow cytometry on CD8+ T cells from healthy donors (negative control; n = 5), activated CD8+ T cells (positive control; n = 5), CD8+ T cells from patients with low LAG3IC (n = 5), and CD8+ T cells from patients with high LAG3IC (n = 5) at increasing dose titrations of an ADAM10 inhibitor without the presence of TCR stimulation. Error bars, SEM. Statistical significance determined by Wilcoxon signed-rank test, ns: not significant, P > 0.05; *, P ≤ 0.05; **, P ≤ 0.01; ***, P ≤ 0.001; ****, P ≤ 0.0001. E, Spearman correlation of soluble LAG3 in media culture by ELISA and LAG3IC expression by flow cytometry on CD8+ T cells from patients during 24 hours of TCR stimulation with plate-bound anti-CD3 and anti-CD28 (n = 14). An exponential, nonlinear regression analysis was chosen over a linear regression given the logarithmic nature of the kinetics of soluble LAG3 noted in the medium compared with intracellular expression. Statistical significance determined by the Wilcoxon signed-rank test; ns, not significant, P > 0.05; *, P ≤ 0.05; **, P ≤ 0.01; ***, P ≤ 0.001; ****, P ≤ 0.0001. F, Soluble LAG3 by ELISA in culture media for 24 hours of CD8+ T cells from NSCLC patients (n = 5) compared with CD8+ T cells from healthy donors (n = 5) with and without the presence of an ADAM10 inhibitor (10 μmol/L). Error bars, SEM. Statistical significance determined by the Wilcoxon signed-rank test; ns, not significant, P > 0.05; *, P ≤ 0.05; **, P ≤ 0.01; ***, P ≤ 0.001; ****, P ≤ 0.0001. This figure represents five independent experiments in total.
Figure 3.
Figure 3.
Peripheral CD8+ T cells with an elevated intracellular LAG3 have reduced function that can be partially rescued by anti-LAG3. A, Representative flow-cytometric plots of TNFα, IFNγ, granzyme B (GZMB),and IL2 expression in CD8+ peripheral T cells from a healthy donor (blue), CD8+ PBLs from a patient with NSCLC and low LAG3IC expression (pink), and CD8+ PBLs from a patient with NSCLC and high LAG3IC expression (orange) after stimulation with PMA and ionomycin for 4–6 hours. B, TNFα, IL2, IFNγ, and granzyme B production evaluated by flow cytometry after 4-6 hour PMA and ionomycin stimulation in bulk CD8+ T cells with elevated LAG3IC expression from NSCLC patients (n = 7) compared with CD8+ T cells with low LAG3IC (n = 26) and CD8+ T cells from HDs (n = 10). Statistical significance determined by Wilcoxon signed-rank test; ns: not significant, P > 0.05; *, P ≤ 0.05; **, P ≤ 0.01; ***, P ≤ 0.001; ****, P ≤ 0.0001. Error bars, SEM. C, Representative flow-cytometric histogram plot of CTV-labeled (cell trace violet) proliferation in CD8+ PBLs from a healthy donor, a patient with NSCLC and high LAG3IC expression (blue), and a patient with NSCLC and low LAG3IC expression (red). D, Proliferation of CTV-labeled CD8+ bulk PBLs by flow cytometry from HD (n = 8), patients with NSCLC and low LAG3IC (n = 5), patients with metastatic melanoma and low LAG3IC (n = 5), patients with NSCLC and high LAG3IC (n = 7), or patients with metastatic melanoma and high LAG3IC (n = 7). Proliferation assay was conducted over 96 hours with CD8+ T cells incubated with matched APCs (1:1 ratio) and anti-CD3 (0.5 μg/mL). Statistical significance was determined by the Wilcoxon signed-rank test, ns: not significant, P > 0.05; *, P ≤ 0.05; **, P ≤ 0.01; ***P ≤ 0.001; ****P ≤ 0.0001. Error bars represent SEM. E, Spearman correlation of proliferation and LAG3IC expression of patient bulk (n = 7) and naïve (CD45RA+CCR7+CD62L+; n = 12) CD8+ T-cell subsets. Healthy donors (n = 4) included in figure but not in correlation analysis. F, NSCLC CD8+ PBLs with high LAG3IC were stimulated with anti-CD3 (0.5 μg/mL) and matched 1:1 APCs at a 96-hour time point in the presence of anti-LAG3. T-cell division was assessed by CTV-labeling. Anti-LAG3 antibody or isotype control antibody was titrated at concentrations of 10, 5, 2.5, 1.25, and 0 μg/mL. *, P < 0.05; ***, P < 0.001; ****, P < 0.0001; ns, not significant, P > 0.05, Wilcoxon pairs test. Error bars, SD. G, Bulk CD4+ T cells (n = 5) and CD8+ T cells (n = 12) from NSCLC patients with high (n = 7) and low LAG3IC (n = 5) expression were stimulated with anti-CD3 (0.5 μg/mL) and matched 1:1 APCs at a 96-hour time point in the presence of anti-LAG3 or isotype control (10 μg/mL). H, CD8+ T cells from healthy donors (n = 5) and patients with metastatic melanoma and high LAG3IC expression (n = 7) were stimulated with anti-CD3 (0.5 μg/mL) and matched 1:1 APCs at a 96-hour time point in the presence of anti-LAG3 or isotype control (10 μg/mL). Correlations were performed with Spearman nonlinear correlation. Mean values of proliferation noted in darker colors and individual sample proliferation noted in lighter colors. Statistical significance determined by the Wilcoxon signed-rank test comparing the change in proliferation after the addition of checkpoint blockade; ns, not significant, P > 0.05; *, P ≤ 0.05; **, P ≤ 0.01; ***, P ≤ 0.001; ****, P ≤ 0.0001. This figure represents seven independent experiments in total.
Figure 4.
Figure 4.
Naïve peripheral CD8+ T cells can also express elevated LAG3IC. A, Analysis by flow cytometry of a prospective cohort of PBLs (n = 40) from patients with high LAG3IC on CD8+ T cells (n = 12), low LAG3IC on CD8+ T cells (n = 18), and HD (n = 10). LAG3IC was evaluated across T-cell subsets: naïve (CD8+CD45RA+CCR7+CD62L+), effector memory (CD8+CD45RACCR7CD62L), and terminally differentiated (CD8+CD45RA+CCR7CD62L) T cells. Error bars, SEM. B, Naïve CD4+ T cells (n = 6) and naïve CD8+ T cells (n = 11) from NSCLC patients with high (n = 6) and low LAG3IC (n = 5) expression were stimulated with anti-CD3 (0.5 μg/mL) and matched 1:1 APCs at a 96-hour time point in the presence of anti-LAG3 or isotype control (10 μg/mL). C, TNFα, IL2, IFNγ, and granzyme B production evaluated by flow cytometry after 4–6-hour PMA and ionomycin stimulation in naïve (CD45RA+CCR7+CD62L+) CD8+ T cells with elevated LAG3IC/PD-1IC expression from NSCLC patients (n = 7) compared with CD8+ T cells with low LAG3TOT/PD1TOT (n = 26) and CD8+ T cells from HD (n = 10). Error bars, SEM. D, TREC concentration was determined by qPCR of activated (positive control), effector, and naïve CD4+ and CD8+ T cells from healthy donors (n = 6), low LAG3 NSCLC patients (n = 4), and high LAG3 NSCLC patients (n = 9). Statistical significance determined by the Wilcoxon signed rank test comparing the change in proliferation after the addition of checkpoint blockade, ns: not significant, P > 0.05; *, P ≤ 0.05; **, P ≤ 0.01; ***, P ≤ 0.001; ****, P ≤ 0.0001. Error bars, SEM.
Figure 5.
Figure 5.
Intracellular LAG3 in peripheral, naïve CD8+ T cells is driven by IL6. A, Naïve (CD45RA+CCR7+CD62L+) CD8+ T cells from healthy donors (n = 7) were incubated with IL2 and IL7 and plasma from patients with high LAG3IC on naïve CD8+ T cells (n = 7), plasma from patients with low LAG3IC on naïve CD8+ T cells (n = 3), and plasma from healthy donors (n = 7) for 60 hours and analyzed for LAG3IC expression. *, P < 0.05; ***, P < 0.001; ****, P < 0.0001; ns, not significant, P > 0.05, by Wilcoxon pairs test. Error bars, SD. B, LAG3IC expression after a 72-hour incubation with naïve CD8+ PBLs from healthy donors (n = 7) and the indicated cytokines of interest at the corresponding EC50 concentrations in the presence of low-dose IL2 and IL7. The negative controls were naïve CD8+ T cells with no additional cytokine, and the positive controls were stimulated with anti-CD3 and anti-CD28. Error bars, SEM. Statistical significance was determined by the Wilcoxon pairs test. C, Venn diagram of cytokines in patient plasma (blue) and cytokines that induced LAG3IC expression in naïve CD8+ T cells (red) in an in vitro incubation assay. Cytokines that were both correlated and could induce LAGIC expression are noted in purple. For full Spearman correlation rho values between plasma concentrations of cytokines and total/intracellular LAG3 expression on naïve CD8+ T cells (see Supplementary Table S2). D, Spearman correlation of IL6 and IL8 versus naïve CD8+ T-cell (CD45RA+CCR7+CD62L+) LAG3IC expression in NSCLC patients (n = 23). Regression coefficients for data points with positive cytokine concentrations are shown. E, Naïve CD8+ HD T cells were incubated with plasma from high LAG3IC NSCLC patients in a similar manner to A with blockade of specific cytokines (anti-IL6, n = 6; anti-IL8, n = 7; anti-IL9, n = 4; anti-IL10, n = 3; anti-IL15, n = 3; anti-IL22, n = 4; anti-IL1β, n = 4, anti-IL21, n = 5; anti-IL6/IL8, n = 5). This plasma was known by multiplex to have elevated concentrations of all the cytokines of interest that correlated with LAG3IC. Concentrations of each blocking antibody varied, and the x-axis is the percentage of the reported EC50 blocking dose. IL22 and IL1β concentration is shown to be elevated by multiplex noted in Supplementary Table S2 and correlated with LAG3IC but not able to induce LAG3IC in the in vitro induction assay, allowing blockade of IL22 and IL1β to serve as a negative control. Statistical significance determined by Wilcoxon signed-rank test; ns: not significant, P > 0.05; *, P ≤ 0.05; **, P ≤ 0.01; ***, P ≤ 0.001; ****, P ≤ 0.0001. Error bars, SD. F, IL6 receptor (IL6R) expression and IL8 receptor (CXCR1) expression on CD8+ PBLs and matched CD4+ PBLs from NSCLC patients (n = 18) that have low LAG3 or high LAG3. Error bars, mean. Statistical significance was determined by the Wilcoxon pairs test. G, Survival of advanced NSCLC patients (n = 53) on standard-of-care PD-1 blockade therapy with IL6HI plasma (defined as ≥ 10 ng/mL) compared with advanced NSCLC patients on therapy with IL6LO plasma (defined as <10 ng/mL). A Mantel-Haenszel ratio was utilized given the exposure of IL6 and outcome of mortality in a dichotomous fashion, whereas accounting for gender and tobacco were used as confounding variables. The ratio was 0.2487 (95% confidence interval: 0.07117-0.8691; P = 0.029). *, P < 0.05; ***, P < 0.001; ****, P < 0.0001; ns = not significant or P > 0.05. H, Percentage of CD8+ T cells dividing over 96 hours and cultured with IL2 and IL7. The negative control did not receive IL6 plasma. The positive control received CD3/CD28 agonism. The experimental samples received IL6 plasma with/without IL6 blockade and/or LAG3 blockade. Error bars, mean. Statistical significance was determined by the Wilcoxon pairs test. I, pSTAT3 expression was evaluated by flow cytometry in ex vivo naïve CD8+ T cells from patients with elevated LAG3 expression (n = 5) compared with patients with low LAG3 (n = 16) as in D. Error bars, mean. Statistical significance was determined by the Wilcoxon pairs test. J, ChIP analysis of STAT3-binding sites in areas of closed chromatin (negative control) and in the SOCS3(positive control) and LAG3 promoters of CD8+ T cells treated with IL2, IL7, and variable patient plasma from the NSCLC patient cohort for 72 hours. Chromatin immunoprecipitated with anti-STAT3 was assayed by real-time PCR. Results are “scaled” to ChIP with isotype-matched control antibody, and input and are presented relative to cells treated with control. *, P < 0.05 and **, P < 0.01 (unpaired t test). Error bars, mean. K, Overall schema of cytokine inducing systemic immune dysfunction. Immune-checkpoint blockade (ICB) via anti-PD-1. Left, example of low plasma IL6 (downward arrow of IL6). Healthy naïve CD8+ T cells migrate from peripheral blood to the tumor microenvironment (TME), undergo TCR stimulation from tumor antigen, and become effector T cells. T-cell exhaustion is abrogated by ICB, leading to therapeutic response and tumor regression. Right, example of high plasma IL6 (upward arrow of IL6 cytokine), which leads to IL6 receptor binding on healthy naïve CD8+ T cells, STAT3 activation, and upregulation of intracellular LAG3 protein expression. This upregulation leads to T cells primed for dysfunction, and upon migration to the TME and TCR stimulation via tumor antigen, LAG3 overcomes surface cleavage, leading to surface expression of LAG3 and resistance to standard PD-1 blockade therapy and tumor progression (red “X”).

Similar articles

Cited by

References

    1. Topalian SL, Hodi FS, Brahmer JR, Gettinger SN, Smith DC, McDermott DF, et al. Safety, activity, and immune correlates of anti-PD-1 antibody in cancer. N Engl J Med 2012;366:2443–54. - PMC - PubMed
    1. Topalian SL, Sznol M, McDermott DF, Kluger HM, Carvajal RD, Sharfman WH, et al. Survival, durable tumor remission, and long-term safety in patients with advanced melanoma receiving nivolumab. Am. J. Clin. Oncol 2014;32:1020–30. - PMC - PubMed
    1. Paz-Ares L, Luft A, Vicente D, Tafreshi A, Gumus M, Mazieres J, et al. Pembrolizumab plus chemotherapy for squamous non-small-cell lung cancer. N Engl J Med 2018;379:2040–51. - PubMed
    1. Gandhi L, Rodriguez-Abreu D, Gadgeel S, Esteban E, Felip E, De Angelis F, et al. Pembrolizumab plus chemotherapy in metastatic non-small-cell lung cancer. N Engl J Med 2018;378:2078–92. - PubMed
    1. Ferris RL, Blumenschein G Jr., Fayette J, Guigay J, Colevas AD, Licitra L, et al. Nivolumab for recurrent squamous-cell carcinoma of the head and neck. N Engl J Med 2016;375:1856–67. - PMC - PubMed

Publication types