. 2022 May 19:11:e73625.
doi: 10.7554/eLife.73625.

Brucella activates the host RIDD pathway to subvert BLOS1-directed immune defense

Affiliations

Brucella activates the host RIDD pathway to subvert BLOS1-directed immune defense

Kelsey Michelle Wells et al. Elife. .

Abstract

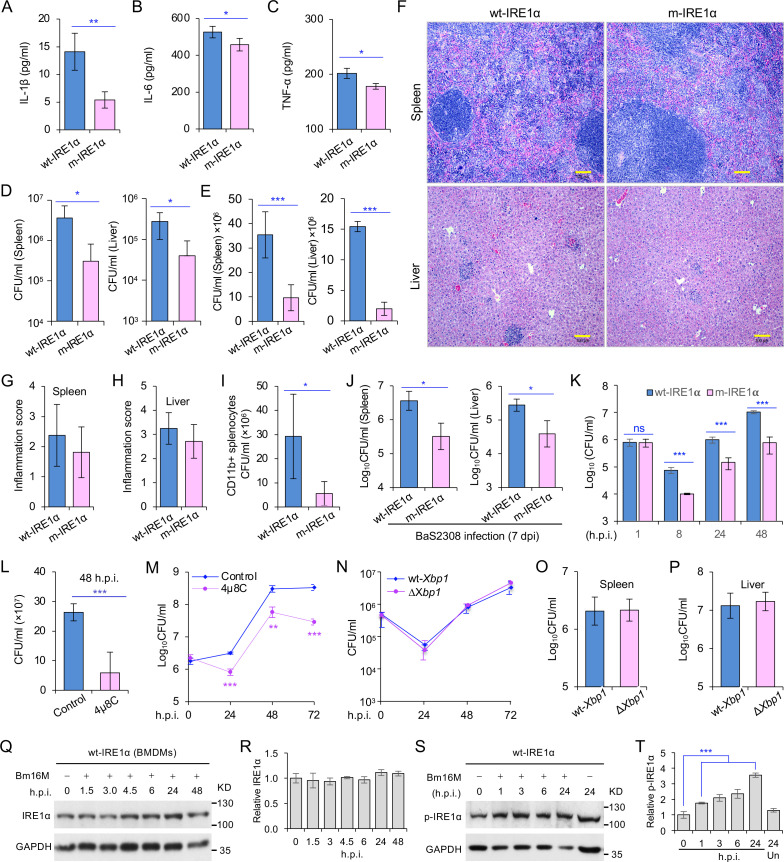
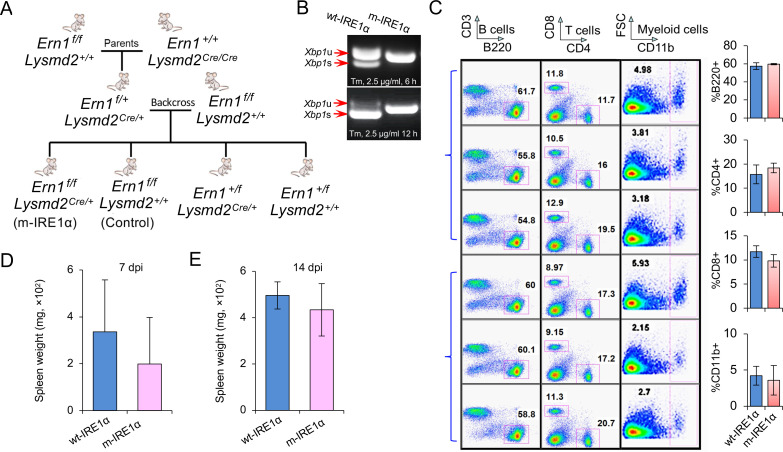
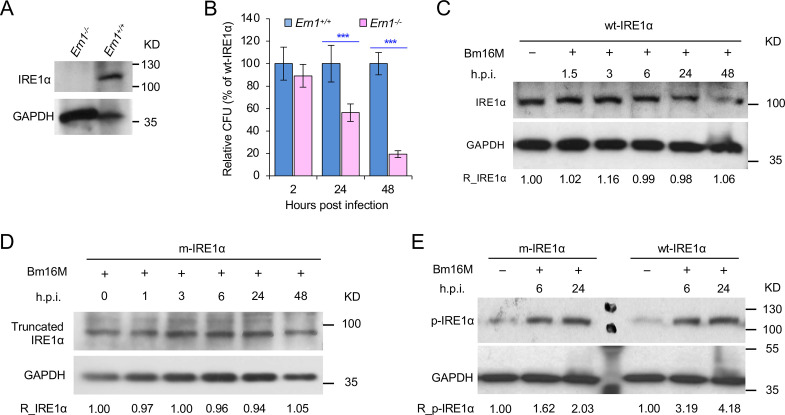
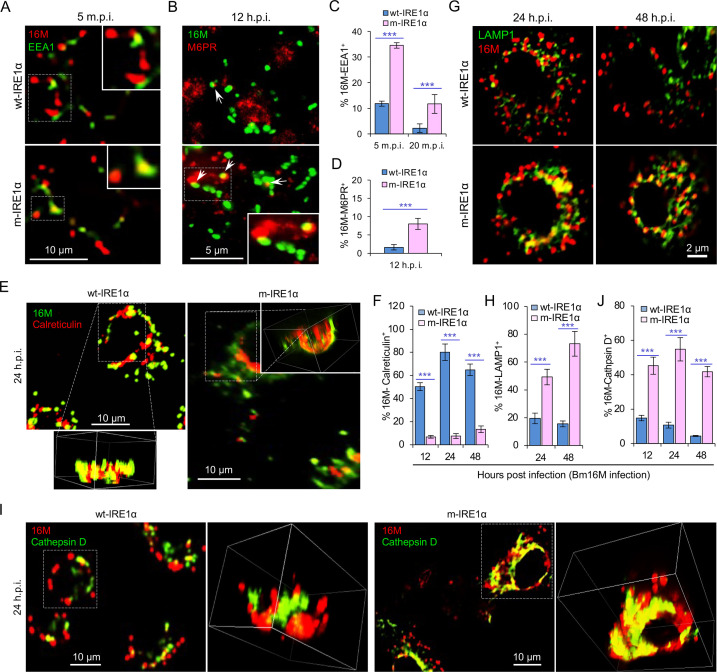
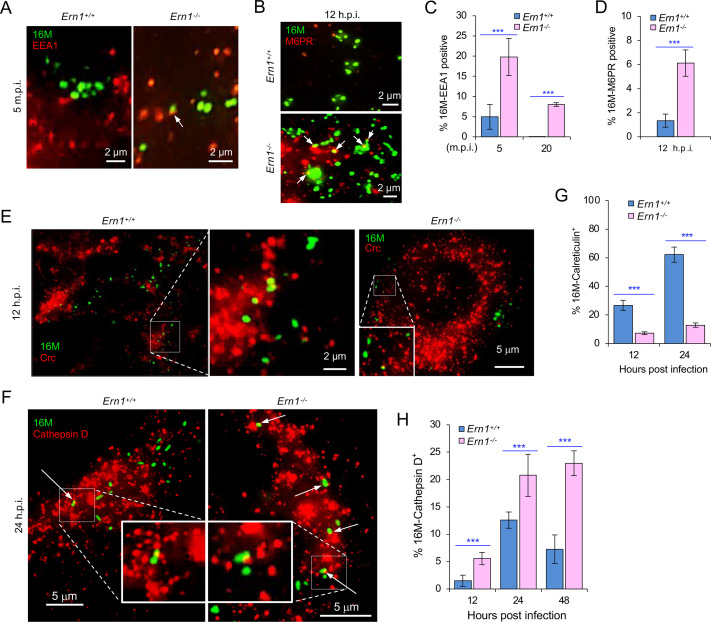
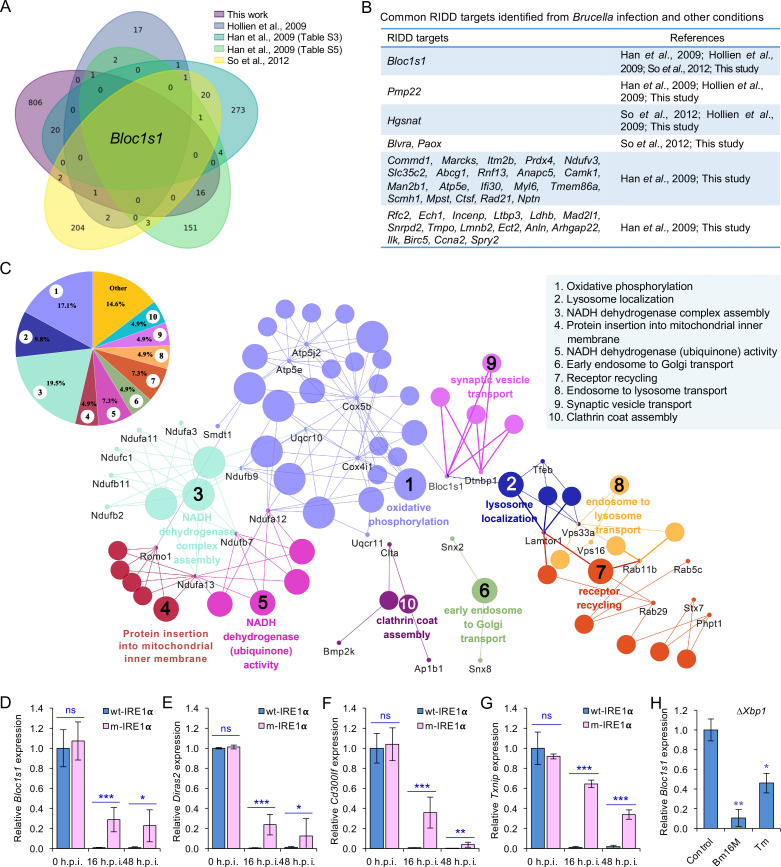
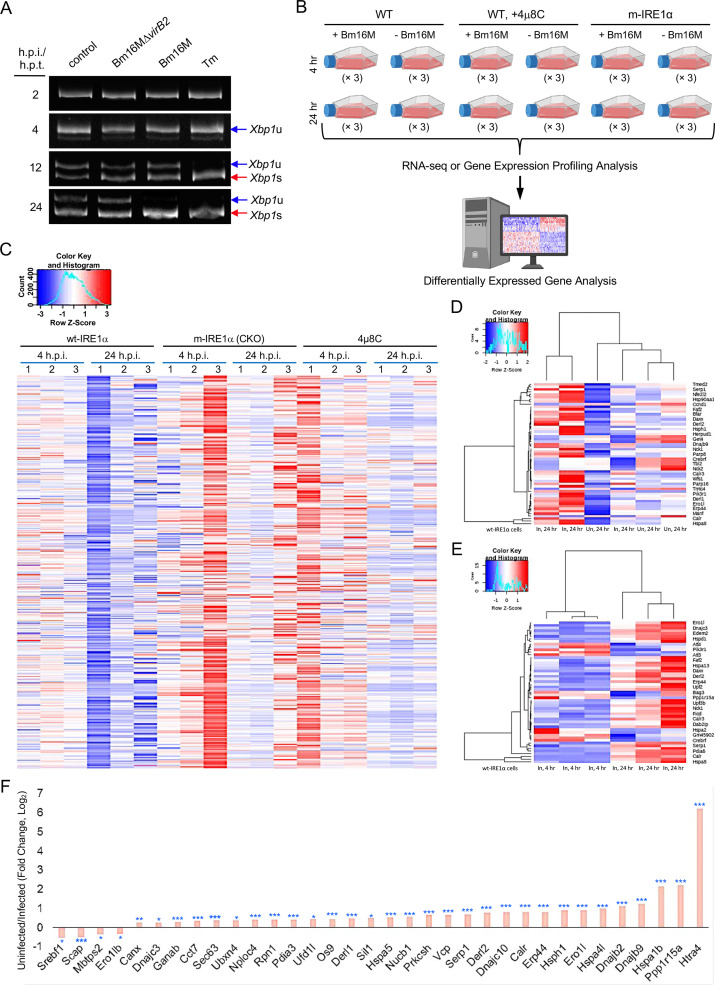
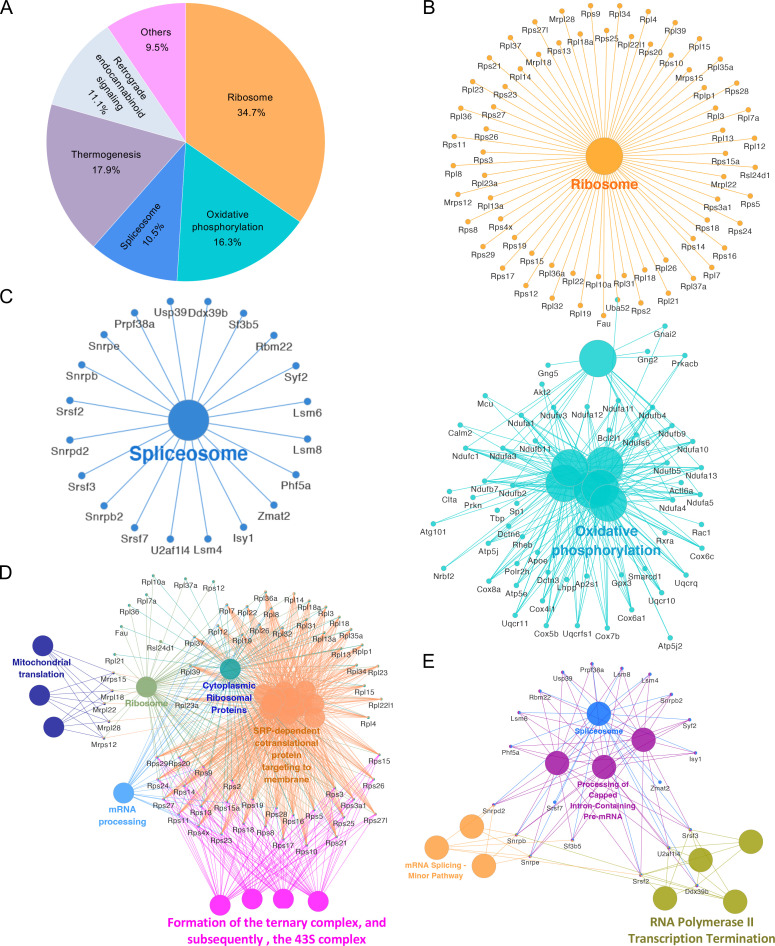
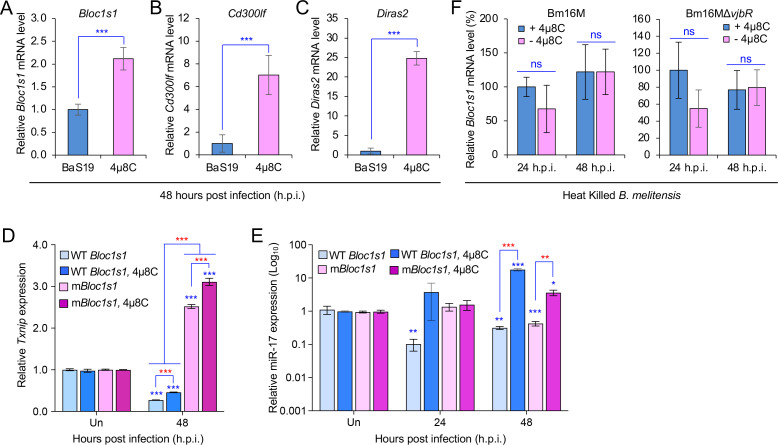
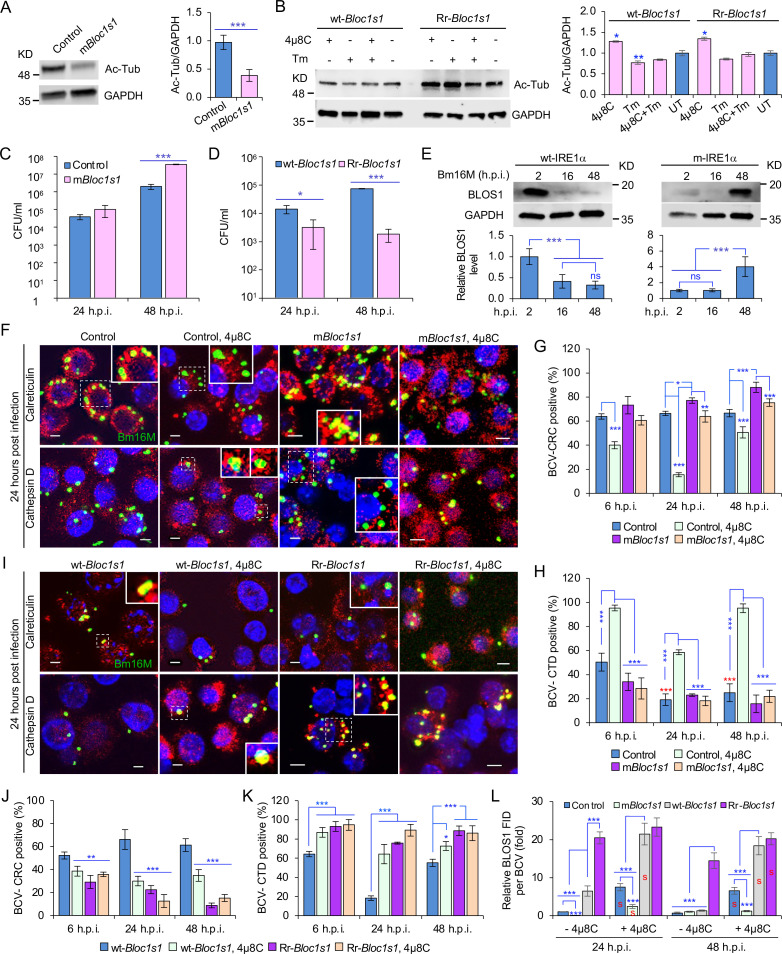
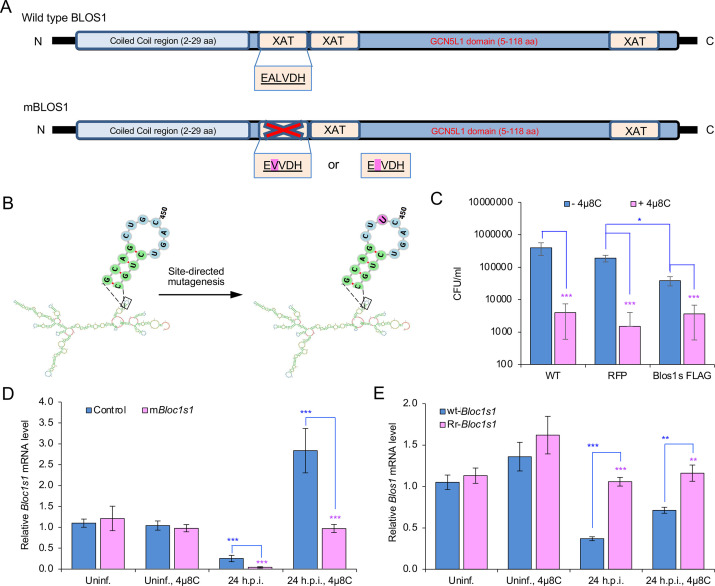
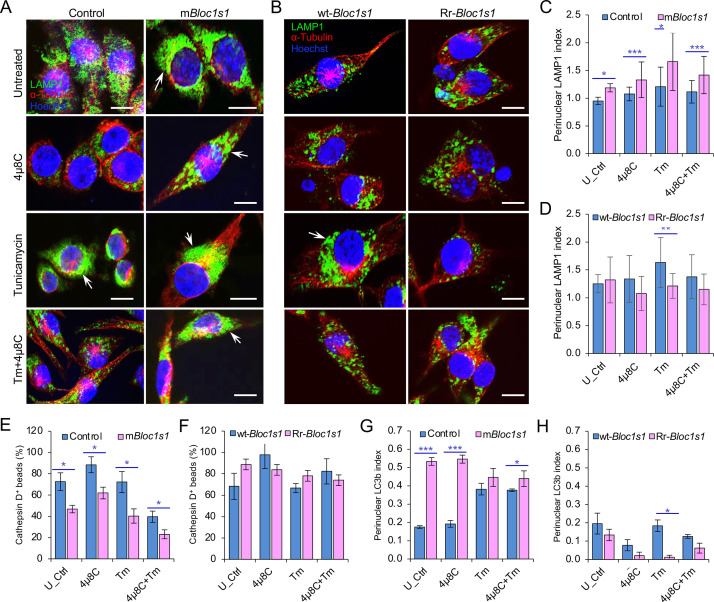
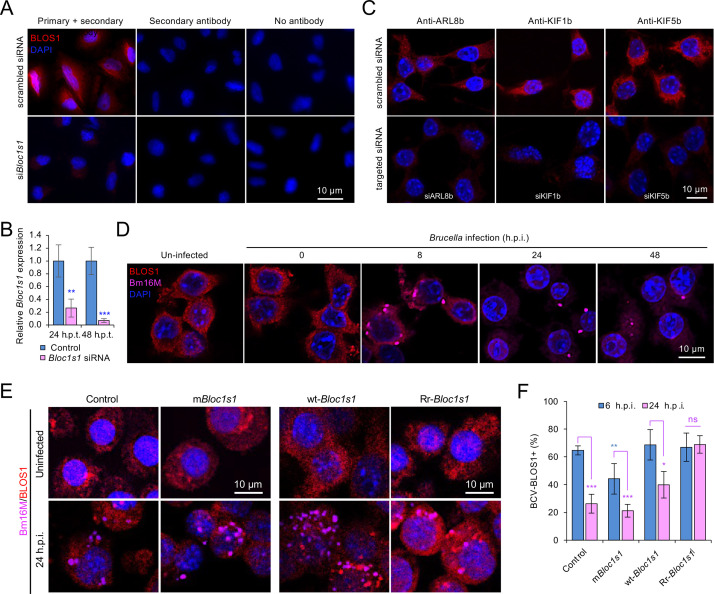
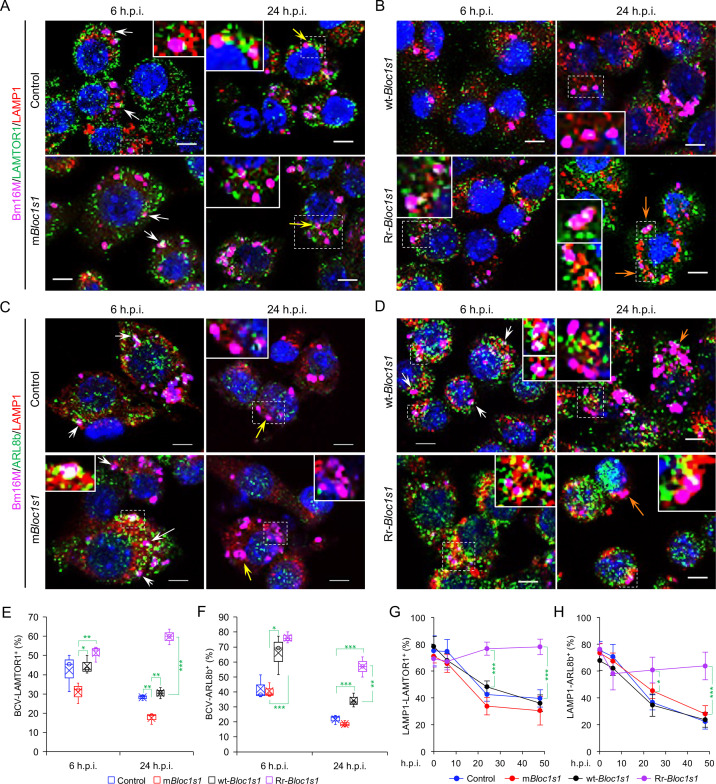
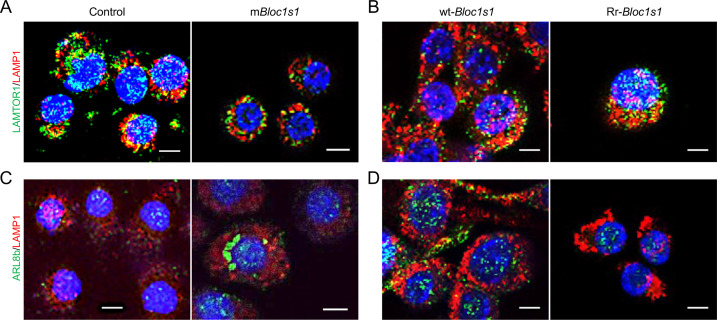
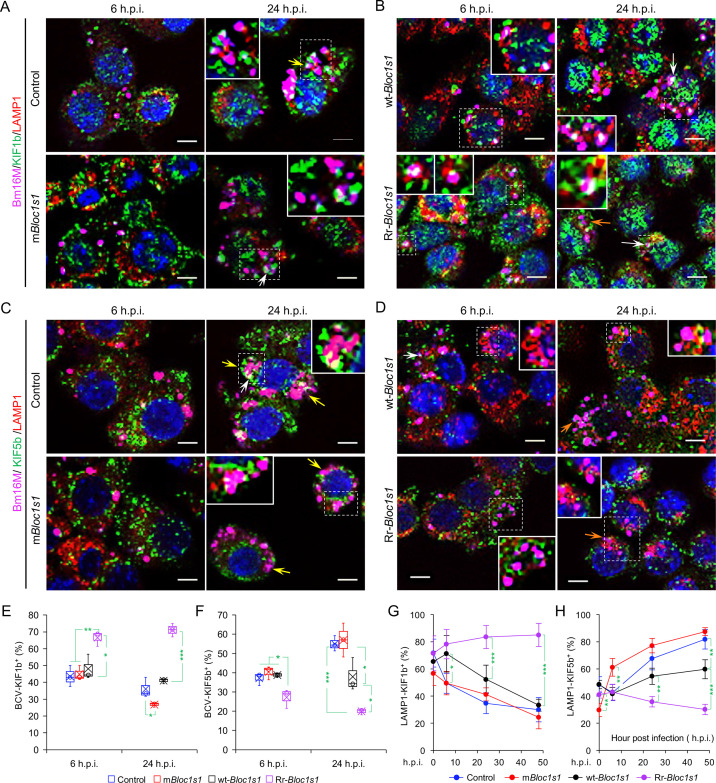
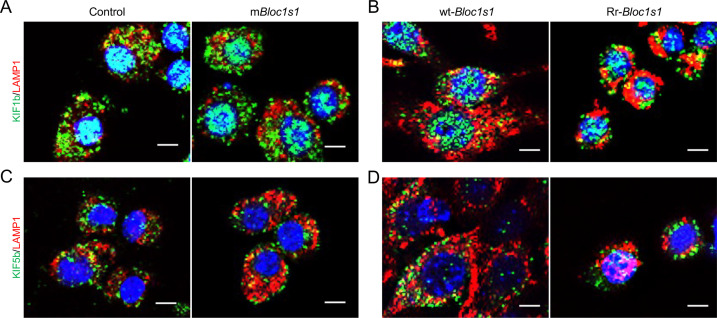
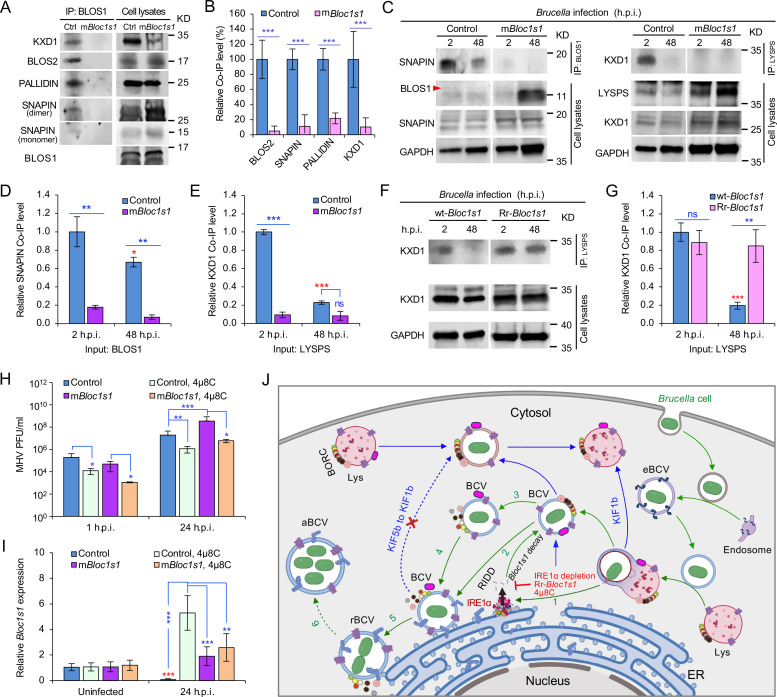
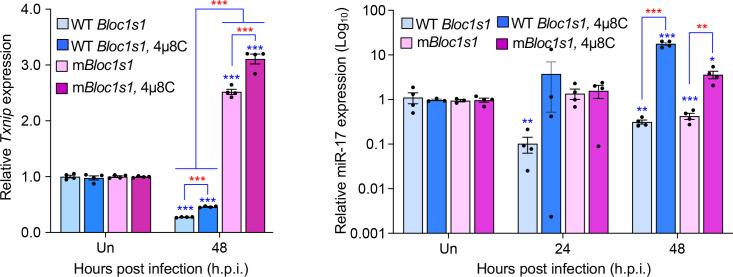
The phagocytosis and destruction of pathogens in lysosomes constitute central elements of innate immune defense. Here, we show that Brucella, the causative agent of brucellosis, the most prevalent bacterial zoonosis globally, subverts this immune defense pathway by activating regulated IRE1α-dependent decay (RIDD) of Bloc1s1 mRNA encoding BLOS1, a protein that promotes endosome-lysosome fusion. RIDD-deficient cells and mice harboring a RIDD-incompetent variant of IRE1α were resistant to infection. Inactivation of the Bloc1s1 gene impaired the ability to assemble BLOC-1-related complex (BORC), resulting in differential recruitment of BORC-related lysosome trafficking components, perinuclear trafficking of Brucella-containing vacuoles (BCVs), and enhanced susceptibility to infection. The RIDD-resistant Bloc1s1 variant maintains the integrity of BORC and a higher-level association of BORC-related components that promote centrifugal lysosome trafficking, resulting in enhanced BCV peripheral trafficking and lysosomal destruction, and resistance to infection. These findings demonstrate that host RIDD activity on BLOS1 regulates Brucella intracellular parasitism by disrupting BORC-directed lysosomal trafficking. Notably, coronavirus murine hepatitis virus also subverted the RIDD-BLOS1 axis to promote intracellular replication. Our work establishes BLOS1 as a novel immune defense factor whose activity is hijacked by diverse pathogens.

Keywords: BLOS1; Brucella; Brucella-containing vacuoles/lysosomes (BCVs); coronavirus; infectious disease; intracellular parasitism; microbiology; mouse; regulated IRE1α-dependent decay (RIDD).


Conflict of interest statement

KW, KH, AP, AC, DZ, JY, GG, YL, HC, XL, HZ, XF, Ld, RM, CJ, CM, JS, LB, KP, JL, AF, SS, JS, XQ, QQ, TF, Pd No competing interests declared

Figures

Figure 1.
Figure 1.. Host IRE1α is required for Brucella infection in vivo.
Innate cytokine production of IL-1β (A), IL-6 (B), and TNF-α (C) in bone marrow-derived macrophages (BMDMs) from the wild-type (WT, wt-IRE1α) control and Ern1 conditional knockout (CKO, m-IRE1α) mice. The BMDMs were stimulated with LPS (100 ng/ml) and at 6 hr poststimulation the cytokine production of the treated cells was determined. Colony-forming unit (CFU) assay for B. melitensis 16M (Bm16M) intracellular survival in spleens and livers of wt- and m-IRE1α mice at 7 (D) or 14 (E) days post infection (dpi). (F) Histopathology of representative hematoxylin and eosin (H&E) stained sections of spleen and liver from Bm16M-infected wt- and m-IRE1α mice at 14 dpi. Bar: 100 μm. Quantification of inflammation of spleens (G) or livers (H) at 14 dpi. (I) CFU assays of CD11b+ cells from Bm16M-infected wt- or m-IRE1α mice. (J) CFU assay for B. abortus S2308 (BaS2308) intracellular survival in spleens and livers in wt-IRE1α control or m-IRE1α mice at 7 dpi. (K) Bm16M invasion and intracellular replication in BMDMs from m-IRE1α and control mice. h.p.i.: hours post infection. CFU assays of Bm16M infection of WT BMDMs (L) or RAW264.7 macrophages (M). Host cells were pretreated with 4μ8C (50 μM) 1 hr before and during infection; CFUs of the infected cells were determined at the indicated h.p.i. (N) CFU assays for Bm16M infection of BMDMs from WT and Xbp1 knockout (ΔXbp1) mice at the indicated h.p.i. CFU assay for Bm16M intracellular survival in spleen (O) or liver (P) in WT or ΔXbp1 mice at 14 dpi. Immunoblotting assay for IRE1α expression (Q) and quantification of the expression levels (R) in BMDMs during a time course (48 hr) of Bm16M infection. Bm16M infection induces phosphorylation of host IRE1α (S) and quantification of the phosphorylated levels of IRE1α during a time course (24 hr) of infection (T). Images/blots are representative of three independent experiments. Statistical data represent the mean ± standard error of mean (SEM) from three independent experiments. *, **, and *** indicate significance at p < 0.05, 0.01, and 0.001, respectively.
Figure 1—figure supplement 1.
Figure 1—figure supplement 1.. Characterization of Ern1 conditional knockout (CKO) and control mice.
(A) Strategy for generating Ern1 CKO (m-IRE1α) mice. (B) Bone marrow-derived macrophages (BMDMs) from m-IRE1α mice fail to induce Xbp1 splicing in the presence of ER stress inducer tunicamycin (Tm) at the indicated hours post treatment. wt-IRE1α: mice harboring the wild-type (WT) Ern1. (C) Comparison of the levels of lymphocytes and myeloid cells in the wt-IRE1α control and m-IRE1α mice. Spleen weight of Brucella melitensis Bm16M-infected mice at 7 (D) or 14 (E) days post infection (dpi). Data represent the mean ± standard error of mean (SEM) from three independent experiments.
Figure 1—figure supplement 2.
Figure 1—figure supplement 2.. IRE1α is required for B. melitensis intracellular replication.
(A) Immunoblotting detection of IRE1α expression in the WT and Ern1 knockout (KO, Ern1−/−) murine embryonic fibroblasts (MEFs). Colony-forming unit (CFU) assay for Bm16M infection of WT and Ern1−/− MEFs (B) and IRE1α expression in these cells during a time course (48 hr) of Bm16M infection (C). (D) The expression levels of the truncated IRE1α in m-IRE1α BMDMs during Bm16M infection. (E) Disruption of the endonuclease domain of IRE1α does not impair its kinase activity in response to Bm16M infection. h.p.i.: hours post infection. Images are representative of three independent experiments. Data represent the mean ± standard error of mean (SEM) from three independent experiments. ***Significance at p < 0.001.
Figure 2.
Figure 2.. IRE1α regulates proper intracellular trafficking and replication of Brucella in a XBP1-independent fashion.
Colocalization analysis of Bm16M with host early endosomes (A) and late endosomes (B) of BMDMs from wt- and m-IRE1α mice at the indicated time points postinfection. m.p.i.: minutes post infection. EEA1: early endosomal antigen 1; M6PR: mannose-6-phosphate receptor. Arrows in panel B: M6PR+-BCVs. Quantification of Bm16M entry into early endosomes (C) or late endosomes (D) of the indicated host BMDMs at the indicated time points postinfection. Colocalization analysis of Bm16M and the ER marker calreticulin (E), and quantification of Bm16M-calreticulin+ (F) in wt- and m-IRE1α BMDMs at the indicated h.p.i. Colocalization of Bm16M and the lysosomal markers LAMP1 (G) or cathepsin D (I), and quantification of Bm16M-LAMP1+ (H) or -cathepsin D+ (J) in wt- and m-IRE1α BMDMs at the indicated h.p.i. Images are representative of three independent experiments. Statistical data express as mean ± standard error of mean (SEM) from three independent experiments. ***p < 0.001.
Figure 2—figure supplement 1.
Figure 2—figure supplement 1.. IRE1α is required for B. melitensis properly intracellular trafficking.
Colocalization analysis of Bm16M with host early endosomes (A) or late endosomes (B) of the WT and Ern1 KO MEFs at the indicated time points postinfection. EEA1: early endosomal antigen 1; M6PR: mannose-6-phosphate receptor. m.p.i.: minutes post infection. Quantitative analysis of Bm16M colocalization with host early endosomes (C) or late endosomes (D) of the indicated host MEFs at the indicated time points postinfection. Colocalization analysis of Bm16M with the host endoplasmic reticulum (ER) marker calreticulin (Crc) (E) or the lysosome marker cathepsin D (F) in WT or Ern1 KO MEFs. Quantification of colocalization of Bm16M with the ER marker calreticulin (G) and cathepsin D (H) in WT or Ern1 KO MEFs at the indicated h.p.i. Images are representative of three independent experiments. Statistical data represent the mean ± standard error of mean (SEM) from three independent experiments. ***Significance at p < 0.001.
Figure 3.
Figure 3.. Identification of host RIDD targets during Brucella infection.
(A) Venn diagram showing numbers of candidate RIDD genes identified in the indicated datasets. (B) Common candidate RIDD genes identified in Bm16M-infected cells and other conditions in the indicated datasets. (C) Interaction network analysis of candidate RIDD genes (Bloc1s1 associated genes) identified in Brucella-infected cells and the corresponding enriched KEGG pathways. Different pathways are distinguished by different colors. Interacting genes are shown with the smallest sized of dot with gene names. The upper-left-corner panel: enriched KEGG pathways and interacting candidate RIDD genes (%). qRT-PCR validation of RIDD candidate genes Bloc1s1 (D), Diras2 (E), Cd300lf (F), and Txnip (G) identified from RNA-seq analysis. Relative mRNA expression levels in potential RIDD targets from control and m-IRE1α BMDMs infected with Bm16M at 16 and 48 h.p.i. were measured by qRT-PCR. (H) qRT-PCR analysis of expression levels of Bloc1s1 in ΔXbp1 BMDMs that were either uninfected (control), infected with Bm16M, or treated with tunicamycin (Tm, an UPR inducer, 5 μg/ml) at 4-hr post infection/treatment. Expression levels of the indicated genes were normalized to Gapdh expression. Statistical data represent the mean ± standard error of mean (SEM) from three independent experiments. *, **, and ***: significance at p < 0.05, 0.01, and 0.001, respectively.
Figure 3—figure supplement 1.
Figure 3—figure supplement 1.. IRE1α activation is Brucella Type 4 secretion system (T4SS)-dependent and gene profiling of host cells infected by Brucella.
(A) Determination of IRE1α RNase activity in host cells via analysis of Xbp1 splicing. Murine J774.A1 macrophages were infected with Bm16M, Bm16MΔvirB2, or treated with Tm (2.5 μg/ml); at the indicated h.p.i. or treatment, the infected or drug-treated cells were harvested for Xbp1 splicing analysis. Representative images from one of three independent experiments are shown. (B) Strategy for gene profiling via RNA-seq analysis. (C) Heatmap of differentially expressed genes (DEGs) in the indicated host cells infected with Bm16M at 4 and 24 h.p.i. DEGs from triplicate samples are shown. (D) Heatmap of endoplasmic reticulum (ER)-associated DEGs in the wt-IRE1α (WT) host cells infected (In) and uninfected (Un) with Bm16M at 24 h.p.i. (upper panel) or at 4 and 24 h.p.i. (lower panel). (E) Fold changes of representative DEGs.
Figure 3—figure supplement 2.
Figure 3—figure supplement 2.. KEGG pathway network analysis of the candidate RIDD genes identified via RNA-seq analysis from host cells infected or uninfected with Bm16M and/or treated or untreated with 4μ8C at 4 and/or 24 h.p.i.
The functionally grouped network was visualized using Cytoscape (https://cytoscape.org/) based on the degree of connectivity (node size) between the KEGG pathways and RIDD genes (p < 0.05, nodes). Different KEGG pathways are distinguished by different colors. (A) The identified 847 candidate RIDD genes are mainly enriched in the KEGG pathways of ribosome (cellular component organization and biogenesis), spliceosome (RNA metabolism), oxidative phosphorylation, thermogenesis, and retrograde endocannabinoid signaling, etc., in which, a total of 142 RIDD candidate gene were enriched. Interaction networks of candidate RIDD genes enriched in the KEGG pathways of ribosome and oxidative phosphorylation (B), and spliceosome (C). KEGG pathway network analysis of the identified candidate RIDD genes (p < 0.05) involved in ribosome biogenesis and ribosomal RNA processing (D) or spliceosome associated factors (E).
Figure 3—figure supplement 3.
Figure 3—figure supplement 3.. Validation of RIDD target genes.
Real-time reverse transcription-PCR (qRT-PCR) assay for the expression levels of RIDD target genes Bloc1s1 (A), CD3300lf (B), Diras2 (C), and Txnip (D) in host cells infected with B. abortus strains S19 (BaS19) (A–C) or BaS2308 (D). Relative mRNA expression levels of the potential RIDD targets in RAW264.7 cells pretreated with 4μ8C (50 μM) or treated with tunicamycin (5 μg/ml) 1 hr before and during infection with the indicated Brucella strains. Gene expression was normalized to Gapdh. Un: uninfected cells. For information of WT Bloc1s1 and mBloc1s1 cells, please see the following Figure 4—figure supplement 1. (E) Relative microRNA miR-17-5p expression in the indicated cells untreated or treated with 4μ8C and infected with BaS2308. (F) The expression levels of Bloc1s1 in host cells treated with heat-killed B. melitensis (strains Bm16M or Bm16M∆Vjbr) determined by qRT-PCR. Data represent the means ± standard error of mean (SEM) from at least three independent experiments. *, **, and ***: significance at p < 0.05, 0.01, and 0.001, respectively.
Figure 4.
Figure 4.. BLOS1 confers host cell susceptibility to Brucella infection and controls Brucella intracellular trafficking.
(A) Western blot analysis of α-tubulin acetylation (left) and quantification of α-tubulin acetylation level (right) in control containing Cas9 and a nonspecific gRNA and the nonfunctional Bloc1s1 mutant (mBloc1s1) in RAW 264.7 Cas9 cells. Ac-Tub: anti-acetylated antibody. (B) Western blot analysis of α-tubulin acetylation (left) and quantification of α-tubulin acetylation levels (right) in control (wt-Bloc1s1, overexpressing WT Bloc1s1) cells and cells that express the RIDD-resistant Bloc1s1 variant (Rr-Bloc1s1) treated or untreated with 4μ8C (50 μM), Tm (5 μg/ml), or both for 4 hr. CFU assays for Bm16M infection of RAW264.7 cells in which Bloc1s1 is nonfunctional (C), RIDD resistant (D) at the indicated h.p.i. (E) BLOS1 degradation assay during Brucella infection (upper panel) and quantification of the relative BLOS1 expression level (compared to the level of the loading control GAPDH) (lower panel) at the indicated h.p.i. ns: no significance. Colocalization of BCV with calreticulin (CRC) or cathepsin D (CTD) (F) and quantification of BCV-CRC+ (G) or BCV-CTD+ (H) in control and mBloc1s1 cells treated with or without 4μ8C (50 μM) at the indicated h.p.i. Red asterisks: significance (p < 0.001) compared to control cells at 6 h.p.i. Colocalization of BCV with CRC or CTD (I) and quantification of BCV-CRC+ (J) or BCV-CTD+ (K) in the wt-Bloc1s1 and Rr-Bloc1s1 cells treated with or without 4μ8C (50 μM) at the indicated h.p.i. (L) Quantification of BLOS1 fluorescence integrated density (FID) per BCV in the mBloc1s1, Rr-Bloc1s1, or their corresponding control cells treated with or without 4μ8C (50 μM) at the indicated h.p.i. S: significance (p < 0.01) compared to that without 4μ8C treatment. Host cells were infected with or without Bm16M, and at the indicated h.p.i., the cells were harvested for immunoblotting assays or fixed and subjected to confocal immunofluorescence assays. Blots/images are representative of three independent experiments. Statistical data represent the mean ± standard error of mean (SEM) from three independent experiment. *p < 0.05; **p < 0.01; ***p < 0.001.
Figure 4—figure supplement 1.
Figure 4—figure supplement 1.. Generation of nonfunctional and overexpression Bloc1s1 variants.
Strategies for generation of nonfunctional Bloc1s1 (mBloc1s1) (A) or RIDD-resistant Bloc1s1 (Rr-Bloc1s1) (B) constructs that are used to generate mBloc1s1 or Rr-Bloc1s1 mutant cells. (C) CFU analysis of Bm16M infection of the murine osteoblastic MC3T3-E1 wild-type (WT), MC3T3-E1-derived RFP-tagged WT (RFP-tagged WT), or RIDD-resistant Blos1(Blos1s) overexpression (Blos1s-FLAG) cell lines (Bae et al., 2019) (gift from the Hollien lab, and used as controls to compare the effect of the Rr-Bloc1s1 cells on Brucella intracellular replication). The indicated cell lines were pretreated with either 1× phosphate buffered saline (PBS) or 4μ8C (50 μM) 1 hr before infection. The pretreated cells were then infected with Bm16M and subjected to gentamicin protection analysis. At 48 h.p.i, the intracellular CFUs were determined. Bloc1s1 mRNA expression assays for the mBloc1s1 (D) or Rr-Bloc1s1 (E) and control cells infected with or without BaS2308 and treated with or without 4μ8C at the indicated h.p.i. via qRT-PCR. Blue asterisks: compared to the uninfected control without 4μ8C. Uninf.: uninfected cells. Data represent the means ± standard error of mean (SEM) from three independent experiments. *, **, and ***: significance at p < 0.05, 0.01, and 0.001, respectively.
Figure 4—figure supplement 2.
Figure 4—figure supplement 2.. Cells with BLOS1 deficiency or RIDD resistance differently control lysosome intracellular trafficking.
Host cells were treated with or without the indicated drugs and at 4 hr post treatment, drug-treated or untreated host cells were fixed and subjected to confocal immunofluorescence assays. Late endosome/lysosome (LE/Lys) trafficking in mBloc1s1 (A) or Rr-Bloc1s1 (B) and control cells in the presence of ER stress inducer tunicamycin (Tm) or IRE1α RNase inhibitor 4μ8C. The indicated cell lines were incubated with Tm, 4μ8C, or Tm + 4μ8C for 4 hr, the cells were then fixed and subjected to confocal immunofluorescence microcopy assay analysis. Bar: 10 μm. Quantification of LE/Lys retrograde trafficking in the mBloc1s1 (C) or Rr-Bloc1s1 (D) cells treated with Tm, 4μ8C, or Tm + 4μ8C at 4 hr. U_Ctrl: untreated control. Quantification of colocalization of latex beads with Cathepsin D in mBloc1s1 (E) or Rr-Bloc1s1 (F) cells treated with Tm, 4μ8C, or Tm +4μ8C for 4 hr. Quantification of autophagic flux (using LC3b as a marker) in mBloc1s1 (G) or Rr-Bloc1s1 (H) cells treated with Tm, 4μ8C, or Tm + 4μ8C for 4 hr. Images are representative of three independent experiments. Statistical data represent the mean ± standard error of mean (SEM) from three independent experiments. *p < 0.05; **p < 0.01; ***p < 0.001.
Figure 4—figure supplement 3.
Figure 4—figure supplement 3.. Host endogenous BLOS1 and the associated proteins are specifically recognized by the indicated homemade or commercial antibodies and differential interactions of Brucella and host BLOS1 during infection.
(A) siRNA-mediated depletion of host (A549 cells) endogenous BLOS1 reduces immunofluorescence intensity detected by the homemade chicken antihuman/mouse BLOS1 antibody. (B) qRT-PCR analysis of expression levels of Bloc1s1 in the indicated siRNA transfected A549 cells at 24 or 48 h.p.t. Expression levels of Bloc1s1 gene was normalized to Gapdh expression. (C) siRNA-mediated depletion of host (RAW264.7 macrophages) endogenous ARL8b, KIF1b, or KIF5b reduces immunofluorescence intensity detected by the corresponding antibodies. (D) Brucella infection indues host BLOS1 degradation. The wild-type RAW264.7 macrophages were infected with B. abortus BaS19 at an MOI of 50, at the indicated hours post infection (h.p.i.), the control and infected cells were fixed and performed immunofluorescence microscopy assay using antibodies as mentioned above. (E) Colocalization of BCVs and host BLOS1 in Bm16M uninfected or infected RAW264.7 cells at 24 h.p.i. (F) Quantification of BCV-BLOS1+ in Bm16M-infected mBloc1s1 or Rr-Bloc1s1and control cells at 6 and 24 h.p.i. Blue asterisks: compared to the control. Images are representative of three independent experiments. Statistical data represent the mean ± standard error of mean (SEM) from three independent experiments. *p < 0.05; **p < 0.01; ***p < 0.001.
Figure 5.
Figure 5.. Brucella infection dissociates host BORC-related lysosome trafficking factor LAMTOR1 and ARL8b from lysosomes.
Colocalization of LAMTOR1 with BCVs or LAMP1 in the infected control and mBloc1s1 (A), or in wt-Bloc1s1 and Rr-Bloc1s1 (B) cells at the indicated h.p.i. Colocalization of ARL8b with BCVs or LAMP1 in the infected control and mBloc1s1 (C), or in wt-Bloc1s1 and Rr-Bloc1s1 (D) cells at the indicated h.p.i. White arrows: colocalization of BCVs with the indicated proteins. Insets: magnification of the selected areas (within windows with dash white lines). Yellow and orange arrows: the perinuclear and peripheral accumulation of BCVs-Lamp1, respectively. Bar: 5 μm. Quantification of BCV-LAMTOR1+ (E) and BCV-ARL8b+ (F) in Bm16M-infected cells at the indicated h.p.i. showing in A, B and C, D, respectively. (G, H) Dynamics of LAMP1-LAMTOR1+ (E) or LAMP1-ARL8b+ (H) in a time course (48 hr) of Bm16M infection at the indicated h.p.i. Host cells were infected with or without Bm16M, and at the indicated h.p.i., the cells were fixed and performed confocal immunofluorescence assays. Images are representative of three independent experiments. Statistical data expressed as mean ± standard error of mean (SEM) from three independent experiments. *p < 0.05; **p < 0.01; ***p < 0.001.
Figure 5—figure supplement 1.
Figure 5—figure supplement 1.. Association of the indicated BORC-related lysosome trafficking components in the indicated uninfected host cells.
The indicated nonfunctional Bloc1s1 (mBloc1s1) or RIDD-resistant Bloc1s1 (Rr-Bloc1s1) and control cell lines were overnight cultured, the cells were fixed and subjected to confocal immunofluorescence assay with the indicated antibodies. Colocalization of cell LAMP1 and LAMTOR1 in uninfected control and mBloc1s1 cells (A) or wt-Bloc1s1 and Rr-Bloc1s1 cells (B) after overnight culture. Colocalization of cell LAMP1 and ARL8b in uninfected control and mBloc1s1 cells (C) or wt-Bloc1s1 and Rr-Bloc1s1 cells (D) after overnight culture. Images are representative of three independent experiments.
Figure 6.
Figure 6.. Brucella infection dissociates BORC-related lysosome trafficking factor KIF1b but recruits KIF5b.
Colocalization of KIF1b with BCVs or LAMP1 in the infected control and mBloc1s1 (A), or in wt-Bloc1s1 and Rr-Bloc1s1 (B) cells at the indicated h.p.i. Colocalization of KIF5b with BCVs or LAMP1 in the infected control and mBloc1s1 (C), or in wt-Bloc1s1 and Rr-Bloc1s1 (D) cells at the indicated h.p.i. White arrows: colocalization of BCVs with the indicated proteins. Insets: magnification of the selected areas (within windows with dash white lines). Yellow and orange arrows: the perinuclear and peripheral accumulation of BCVs-Lamp1, respectively. Bar: 5 μm. Quantification of BCV-KIF1b+ (E) and BCV-KIF5b+ (F) in Bm16M-infected cells at the indicated h.p.i. showing in A, B and C, D, respectively. Dynamics of LAMP1-KIF1b+ (G) or LAMP1-KIF5b+ (H) in a time course (48 hr) of Bm16M infection at the indicated h.p.i. Host cells were infected with or without Bm16M, and at the indicated h.p.i., the cells were fixed and subjected to confocal immunofluorescence assays. Images are representative of three independent experiments. Statistical data represent means ± standard error of mean (SEM) from three independent experiments. *p < 0.05; **p < 0.01; ***p < 0.001.
Figure 6—figure supplement 1.
Figure 6—figure supplement 1.. Association of the BORC-related lysosome trafficking components KIF1b, KIF5b, and LAMP1 in the indicated uninfected host cells.
Colocalization of cell LAMP1 and KIF1b in uninfected control and mBloc1s1 cells (A) or wt-Bloc1s1 and Rr-Bloc1s1 cells (B) after overnight culture. Colocalization of cell LAMP1 and KIF5b in uninfected control and mBloc1s1 cells (C) or wt-Bloc1s1 and Rr-Bloc1s1 cells (D) after overnight culture. Images are representative of three independent experiments.
Figure 7.
Figure 7.. Brucella infection dissociates host BORC and degradation of Bloc1s1 mRNA supports coronavirus intracellular replication.
(A) Co-immunoprecipitation (Co-IP) analysis of the interactions of BLOS1 with other proteins that form the BLOC-1 (BLOS1, BLOS2, SNAPIN, and PALLIDIN) or BORC (BLOS1, BLOS2, SNAPIN, and KXD1) complex. The nonfunctional mBloc1s1 and control cells were cultured overnight before being subjected to Co-IP assays with BLOS1 as an input. (B) Quantification of the indicated pulled-down protein levels from overnight-cultured control and mBloc1s1 cell lysates using BLOS1 as an input. (C) Co-IP assays for Brucella-infected control and mBloc1s1 cells at the indicated h.p.i. using BLOS1 (left panel) or LYSPERSIN (LYSPS, right panel) as an input. Red arrow: BLOS1. Quantification of the indicated pulled-down protein levels of SNAPIN (D) or KXD1 (E) from Brucella-infected control and mBloc1s1 cell lysates using BLOS1 or LYSPS as an input. Red asterisks: significance when compared to the control at 2 h.p.i. (F) Co-IP assays for Brucella-infected wt- or Rr-Bloc1s1 cells at the indicated h.p.i. using LYSPERSIN as an input. (G) Quantification of the indicated pulled-down protein levels from Brucella-infected cell lysates of wt- or Rr-Bloc1s1. Red asterisk: significance when compared to the wt-Bloc1s1 control at 2 h.p.i. (H) PFU (plaque-forming units) assay of coronavirus MHV infection of the mBloc1s1 and control cells treated or untreated with 4μ8C (50 μM) at the indicated h.p.i. (I) Bloc1s1 mRNA expression assay of the indicated host cells infected with MHV via qRT-PCR. Red asterisk: significance when compared to the uninfected control. (J) A proposed model describing how Brucella subverts the host RIDD-BLOS1 pathway to support intracellular parasitism by disrupting BORC-directed lysosomal trafficking. BCV: Brucella-containing vacuole. eBCV, rBCV, and aBCV: endosomal BCV, replicative BCV, and autophagic BCV, respectively. BORC: the BLOC-1-related complex. Green arrows: BCV trafficking to the ER compartment and replication. Blue arrows: BCV trafficking to peripheral lysosome and lysosomal degradation. Host cells were infected with or without Brucella or MHV, and at the indicated h.p.i., the infected or uninfected host cells were harvested for Co-IP and immunoblotting assays, or qRT-PCR assays. Blots are representative of three independent experiments. Statistical data represent the mean ± standard error of mean (SEM) from three independent experiment. *p < 0.05; **p < 0.01; ***p < 0.001. Red asterisks: Compared to the same Brucella-infected cells at 2 h.p.i.
Author response image 1.
Author response image 1.. Brucella infection downregulates host Txnip (left panel) and miR-17 (right panel) expression.
RAW264.7 macrophages harboring the wild-type (WT) or non-functional Blos1 (mBlos1) were infected with B. abortus S2308 in the absence or presence of 4μ8C, an IRE1α RNAse and RIDD inhibitor, during infection. At the indicated hours post infection, the infected cells were harvested and performed real-time reverse transcription-PCR (qRT-PCR) assays to determine TXNIP mRNA and miR-17 expression. Un: uninfected cells. *, **, and ***: Significance at p < 0.05, 0.01 and 0.001, respectively. Data represent the mean ± standard error of means from at least 4 independent experiments were performed (expression levels of the indicated genes were normalized to Gapdh expression). Blue asterisks: comparison with those of uninfected control cells.

References

    1. Anders S, Huber W. Differential expression analysis for sequence count data. Nature Precedings. 2010;1:4282.2. doi: 10.1038/npre.2010.4282.2. - DOI - PMC - PubMed
    1. Bae D, Moore KA, Mella JM, Hayashi SY, Hollien J. Degradation of Blos1 mRNA by IRE1 repositions lysosomes and protects cells from stress. The Journal of Cell Biology. 2019;218:1118–1127. doi: 10.1083/jcb.201809027. - DOI - PMC - PubMed
    1. Bechill J, Chen Z, Brewer JW, Baker SC. Coronavirus infection modulates the unfolded protein response and mediates sustained translational repression. Journal of Virology. 2008;82:4492–4501. doi: 10.1128/JVI.00017-08. - DOI - PMC - PubMed
    1. Bright MD, Itzhak DN, Wardell CP, Morgan GJ, Davies FE. Cleavage of BLOC1S1 mRNA by IRE1 Is Sequence Specific, Temporally Separate from XBP1 Splicing, and Dispensable for Cell Viability under Acute Endoplasmic Reticulum Stress. Molecular and Cellular Biology. 2015;35:2186–2202. doi: 10.1128/MCB.00013-15. - DOI - PMC - PubMed
    1. Campeau E, Ruhl VE, Rodier F, Smith CL, Rahmberg BL, Fuss JO, Campisi J, Yaswen P, Cooper PK, Kaufman PD. A versatile viral system for expression and depletion of proteins in mammalian cells. PLOS ONE. 2009;4:e6529. doi: 10.1371/journal.pone.0006529. - DOI - PMC - PubMed

Publication types

Substances