. 2022 May 31:11:e79762.
doi: 10.7554/eLife.79762.

Canonical Wnt signaling and the regulation of divergent mesenchymal Fgf8 expression in axolotl limb development and regeneration

Affiliations

Canonical Wnt signaling and the regulation of divergent mesenchymal Fgf8 expression in axolotl limb development and regeneration

Giacomo L Glotzer et al. Elife. .

Abstract

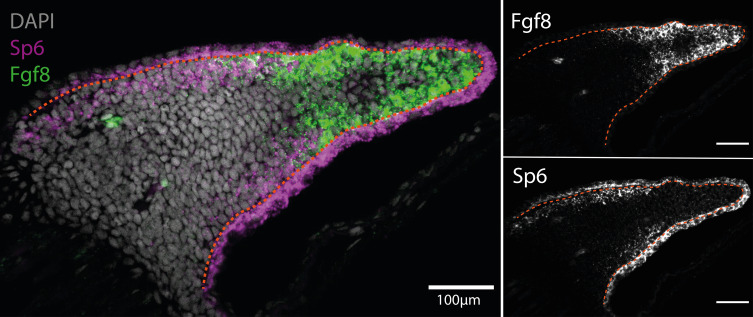
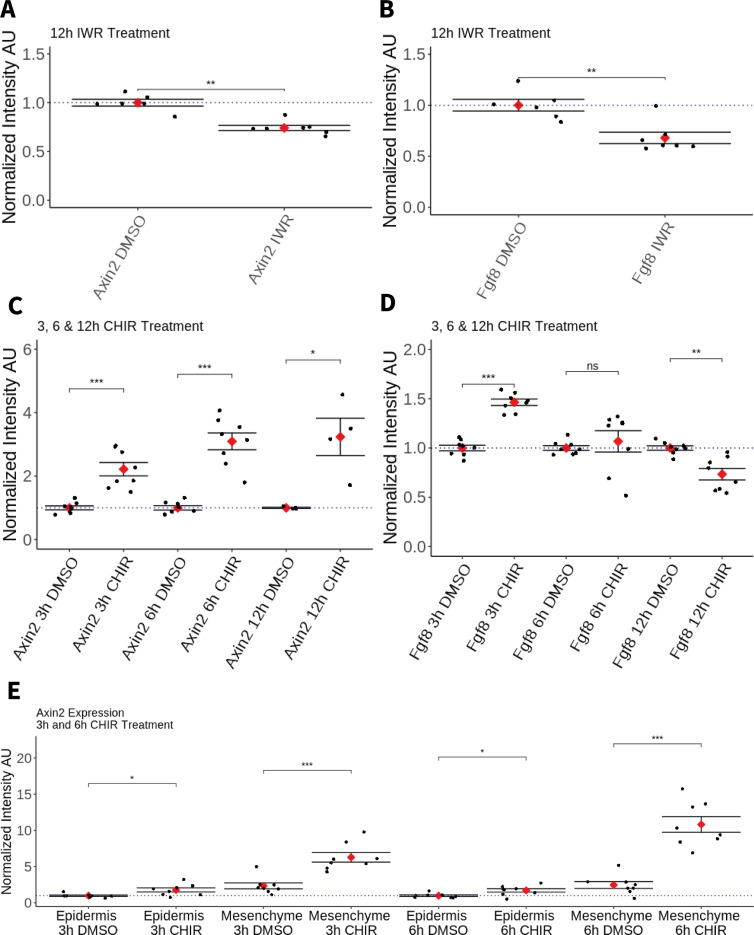
The expression of fibroblast growth factors (Fgf) ligands in a specialized epithelial compartment, the Apical Ectodermal Ridge (AER), is a conserved feature of limb development across vertebrate species. In vertebrates, Fgf 4, 8, 9, and 17 are all expressed in the AER. An exception to this paradigm is the salamander (axolotl) developing and regenerating limb, where key Fgf ligands are expressed in the mesenchyme. The mesenchymal expression of Amex.Fgf8 in axolotl has been suggested to be critical for regeneration. To date, there is little knowledge regarding what controls Amex.Fgf8 expression in the axolotl limb mesenchyme. A large body of mouse and chick studies have defined a set of transcription factors and canonical Wnt signaling as the main regulators of epidermal Fgf8 expression in these organisms. In this study, we address the hypothesis that alterations to one or more of these components during evolution has resulted in mesenchymal Amex.Fgf8 expression in the axolotl. To sensitively quantify gene expression with spatial precision, we combined optical clearing of whole-mount axolotl limb tissue with single molecule fluorescent in situ hybridization and a semiautomated quantification pipeline. Several candidate upstream components were found expressed in the axolotl ectoderm, indicating that they are not direct regulators of Amex.Fgf8 expression. We found that Amex.Wnt3a is expressed in axolotl limb epidermis, similar to chicken and mouse. However, unlike in amniotes, Wnt target genes are activated preferentially in limb mesenchyme rather than in epidermis. Inhibition and activation of Wnt signaling results in downregulation and upregulation of mesenchymal Amex.Fgf8 expression, respectively. These results implicate a shift in tissue responsiveness to canonical Wnt signaling from epidermis to mesenchyme as one step contributing to the unique mesenchymal Amex.Fgf8 expression seen in the axolotl.

Keywords: Fgf8; HCR; Wnt; axolotl; developmental biology; limb regeneration; regenerative medicine; stem cells.


Conflict of interest statement

GG, PT, ET No competing interests declared

Figures

Figure 1.
Figure 1.. Expression of AER transcription factors in the axolotl limb bud and limb blastema assessed by reanalysis of Axolotl scRNA seq datasets.
Reanalysis of scRNA seq data from blastema (A–E, data from Li et al., 2021) or limb bud (A’–E’, data from Lin et al., 2021). (A, A’) UMAPs of Axolotl scRNA seq expression data for Sp6. Expression is detected in the epidermis of the axolotl blastema and limb bud. (B, B’) UMAPs of Axolotl scRNA seq expression data for Sp8. Expression is detected in the epidermis of the axolotl blastema and limb bud. (C, C’) UMAPs of Axolotl scRNA seq expression data for Dlx5. Expression is detected in the epidermis and mesenchyme of the axolotl blastema and limb bud. (D, D’) UMAPs of Axolotl scRNA seq expression data for Dlx6. Expression is detected in the epidermis and mesenchyme of the axolotl limb bud. Expression is detected only in few blastema cells. (E, E’) UMAPs of Axolotl scRNA seq expression data for Lef1. Expression is detected in the epidermis and mesenchyme of the axolotl blastema and limb bud.
Figure 1—figure supplement 1.
Figure 1—figure supplement 1.. Cluster identification in the reanalysis of axolotl limb bud scRNA seq dataset from Lin et al., 2021.
(A) Clustering of axolotl limb bud scRNA seq expression data reveals six clusters that are readily identifiable by the expression of key markers. (B) Cdh5 labels endothelial cells in the axolotl limb bud scRNA seq dataset. (C) Runx3 labels dendritic cells in the axolotl limb bud scRNA seq dataset. (D) Pax7 labels muscle progenitors in the axolotl limb bud scRNA seq dataset. (E) Krt12 labels epidermal cells (including SSCs) in the axolotl limb bud scRNA seq dataset. (F) Prrx1 labels mesenchymal cells in the axolotl limb bud scRNA seq dataset. (G) Fcgbp labels epidermal small secretory cells in the axolotl limb bud scRNA seq dataset.
Figure 1—figure supplement 2.
Figure 1—figure supplement 2.. Cluster identification in the reanalysis of axolotl blastema scRNA seq dataset from Li et al., 2021.
(A) Clustering of axolotl limb bud scRNA seq expression data reveals six clusters that are readily identifiable by the expression of key markers. (B, C) Csf1r and Arg1 label two macrophage clusters in the axolotl blastema scRNA seq dataset. (D) Prrx1 labels mesenchymal cells in the axolotl blastema scRNA seq dataset. (E) Krt12 labels epidermal cells in the axolotl blastema scRNA seq dataset. (F) Cdh5 labels endothelial cells in the axolotl blastema scRNA seq dataset. (G) Hbz labels blood cells in the axolotl blastema scRNA seq dataset.
Figure 2.
Figure 2.. Expression of AER transcription factors in the axolotl limb blastema and limb bud assessed by HCR in situ hybridization.
(A, A’) Schematic outlining the mesenchymal and epidermal compartments in a longitudinal section of an axolotl blastema and limb bud. (B, B’) Expression of Sp6 in the epidermis and of Fgf8 in the mesenchyme of the axolotl blastema and limb bud revealed by HCR (single planes from whole-mount images, n = 4). (C, C’) Expression of Sp8 in the epidermis and of Fgf8 in the mesenchyme of the axolotl blastema and limb bud revealed by HCR (single planes from whole-mount images, n = 4). (D, D’) Expression of Fgf8 in the mesenchyme as well as of Dlx5 in the mesenchyme and basal epidermis of the axolotl limb bud and blastema (single planes from whole-mount images, n = 4). (E, E’) Expression of the mesenchymal marker Prrx1, and of Lef1 in the mesenchyme and basal epidermis of the axolotl blastema and limb bud (single planes from whole-mount images, n = 4). For microscopy images right panels represent magnifications of the outlined boxes, M = mesenchyme, E = epidermis. Dashed lines demarcate epidermal–mesenchymal boundaries.
Figure 2—figure supplement 1.
Figure 2—figure supplement 1.. Sp6 is expressed in the basal epidermis and proximal mesenchyme in the axolotl limb bud (n = 4).
(A) Single plane image from a whole-mount limb bud HCR staining of Sp6 and Fgf8 transcripts. (B) Fgf8 expression is localized to the distal mesenchyme of the axolotl limb bud. (C) Sp6 is ubiquitously expressed in the epidermis but only expressed in the proximal mesenchyme of the axolotl limb bud. Dashed lines demarcate epidermal–mesenchymal boundaries.
Figure 3.
Figure 3.. Expression of Fgf10 and of the canonical Wnt pathway components Wnt3a, Axin2, Rspo2 in the axolotl limb bud and limb blastema assessed by reanalysis of Axolotl scRNA seq datasets.
Reanalysis of scRNA seq data from blastema (A–D, data from Li et al., 2021) or limb bud (A’–D’, data from Lin et al., 2021). (A, A’) UMAPs of Axolotl scRNA seq expression data for Fgf10. Expression is detected in the mesenchyme of the axolotl blastema and limb bud. (B, B’) UMAPs of Axolotl scRNA seq expression data for Wnt3a. Expression is detected in the epidermis of the axolotl blastema and limb bud. (C, C’) UMAPs of Axolotl scRNA seq expression data for Axin2. Expression is detected in the prevalently in the mesenchyme of the axolotl blastema and limb bud. (D, D’) UMAPs of Axolotl scRNA seq expression data for Rspo2. Expression is detected in the mesenchyme of the axolotl limb bud. Expression is detected only in few blastema cells.
Figure 4.
Figure 4.. Expression of Fgf10, Fgfr2b and of the canonical Wnt pathway components Wnt3a, Axin2, Rspo2 in the axolotl limb bud and limb blastema evaluated by HCR in situ hybridization.
(A, A’) Schematic outlining the mesenchymal and epidermal compartments in a longitudinal section of an axolotl blastema and limb bud. (B, B’) Expression of Prrx1 and Fgf10 in the mesenchyme of the axolotl blastema and limb bud revealed by HCR (single planes from whole-mount images, n = 4). Arrows point to weak Fgf10 expression present in the distal basal epidermis of the blastema and limb bud. (C, C’) Expression of Fgf8 in the mesenchyme and expression of Fgfr2b in the basal epidermis of the axolotl blastema and limb bud revealed by HCR (single planes from whole-mount images, n = 4). (D, D’) Expression of Wnt3a in the basal epidermis and Axin2 in the mesenchyme and basal epidermis of the axolotl blastema and limb bud (single planes from whole-mount images, n = 4). Axin2 expression is stronger in the mesenchyme and weaker in the epidermis. (E, E’) Expression of Rspo2 in the mesenchyme and Axin2 in the mesenchyme and basal epidermis of the axolotl blastema and limb bud (single plane from whole-mount image, n = 4). Bright green structures (*) in the blastema outer epidermis are autofluorescent signal. For microscopy images right panels represent magnifications of the outlined boxes, M = mesenchyme, E = epidermis. Dashed lines demarcate epidermal–mesenchymal boundaries.
Figure 4—figure supplement 1.
Figure 4—figure supplement 1.. Epidermal cells expressing Fgf10 are not of mesenchymal origin.
(A) Fgf10 transcripts are present in epidermal cells that are not Prrx1 lineage labeled in the axolotl blastema. Fgf10 transcripts are present in epidermal cells that are not Prrx1 lineage labeled in the axolotl blastema (n = 4 blastemas). HCR in situ hybridization performed in a tissue section of a Prrx1:Cre-ER;CAGGs:lp-Cherry animal that was tamoxifen converted during limb development. Green cells are cells of mesenchymal lineage origin. (B, C) Magnifications of the box outlined in A. Dashed lines demarcate epidermal–mesenchymal boundaries.
Figure 4—figure supplement 2.
Figure 4—figure supplement 2.. Rspo2 expression is biased along the dorsoventral axis in the axolotl blastema (A–C) and limb bud (D–F) (n = 4).
(A) Single plane image from a whole-mount blastema HCR staining of Rspo2 transcripts. (B) Cross-section of the blastema proximodistal axis showing biased expression along the dorsoventral axis. (C) Cross-section of the blastema anterior–posterior axis showing biased expression along the dorsoventral axis. (D) Single plane image from a whole-mount limb bud HCR staining of Rspo2 transcripts. (E) Cross-section of the limb bud proximodistal axis showing biased expression along the dorsoventral axis. (F) Cross-section of the limb bud anterior–posterior axis showing biased expression along the dorsoventral axis.
Figure 5.
Figure 5.. Effect of pharmacological perturbation of Wnt signaling on Fgf8 expression in the axolotl blastema.
Plots depicting expression levels of Fgf8 or Axin2 as assessed by mean fluorescent intensity of HCR signal inside the corresponding gene expression domains. Each black dot represents the mean signal quantified from one blastema, each red dot represents mean values for each condition. Whiskers indicate the standard error of the mean. * indicates statistical significance (*p < 0.05, **p < 0.01, ***p < 0.001, ns = nonsignificant = p > 05). Statistics were performed using the nonparametric Wilcoxon rank sum test. (A, B) Pharmacological inhibition of Wnt signaling using IWR1-endo downregulates Axin2 and Fgf8 expression in the axolotl limb blastema. (C) CHIR treatment activates canonical Wnt signaling in the axolotl blastema as shown by upregulation of Axin2 expression after 3, 6, and 12 hr of treatment. (D) Pharmacological activation of Wnt signaling using CHIR upregulates Fgf8 in the axolotl blastema after 3 hr of treatment. Fgf8 expression comparable to DMSO control levels after 6 hr of treatment and downregulated after 12 hr of CHIR treatment. (E) Mesenchymal and epidermal Axin2 expression are both upregulated after 3 and 6 hr of CHIR treatment. Mesenchymal Axin2 increases 2.6-fold after 3 hr and 4.4-fold after 6 hr of treatment. Epidermal Axin2 increases 1.8-fold after 3 hr and 1.7-fold after 6 hrs of treatment.
Figure 5—figure supplement 1.
Figure 5—figure supplement 1.. Image analysis workflow for whole-mount HCR signal quantification inside gene expression domains.
(A) 3D images are cropped distal to the amputated bone. (B) The Image acquired using 488 illumination (no HCR staining) is used to generate a 3D mask of the autofluorescent blood cells. The mask is generated by thresholding after denoising (Gaussian Blur). (C) HCR images are background subtracted, denoised, and thresholded to generate a mask containing HCR signal + autofluorescence. (D) HCR signal is isolated subtracting the previously obtained autofluorescence mask from the gene expression mask. (E) The resulting mask is refined and used for 3D signal quantification.
Figure 5—figure supplement 2.
Figure 5—figure supplement 2.. Single plane images from whole-mount stacks of 3-hr CHIR-treated and DMSO control samples.
(A) Three hours DMSO control blastema. From left to right: composite multichannel image, Axin2 alone, Fgf8 alone. (B) Three hours CHIR-treated blastema. From left to right: composite multichannel image, Axin2 alone, Fgf8 alone. (A, B) All pairs from treated and control are displayed with the same settings. Yellow lines demarcate epidermal–mesenchymal boundaries.
Figure 5—figure supplement 3.
Figure 5—figure supplement 3.. Image analysis workflow for the quantification of Axin2 HCR signal quantification in the epidermal and mesenchymal domains.
(A) 3D images are cropped, in the cropped images the entire mesenchyme contains Fgf8 transcripts. (B, C) HCR images for Axin2 and Fgf8 are denoised and thresholded to generate a mask containing HCR signal + autofluorescence. (D) The Image acquired using 488 nm illumination (no HCR staining) is used to generate a 3D mask of the autofluorescent blood cells. (E) The Axin2 gene expression domain is isolated by subtracting the autofluorescence mask from the previously obtained masks. (F, G) The Fgf8 mask is used to outline the mesenchyme. A mask for the Axin2 epidermal expression domain is obtained subtracting the Fgf8 mask from the Axin2 mask. To obtain intensity measurements the 3D masks are applied to the raw data after background subtraction.

Similar articles

Cited by

References

    1. Anderson MJ, Magidson V, Kageyama R, Lewandoski M. Fgf4 maintains Hes7 levels critical for normal somite segmentation clock function. eLife. 2020;9:e55608. doi: 10.7554/eLife.55608. - DOI - PMC - PubMed
    1. Aoki M, Kiyonari H, Nakamura H, Okamoto H. R-spondin2 expression in the apical ectodermal ridge is essential for outgrowth and patterning in mouse limb development. Development, Growth & Differentiation. 2008;50:85–95. doi: 10.1111/j.1440-169X.2007.00978.x. - DOI - PubMed
    1. Barrow JR, Thomas KR, Boussadia-Zahui O, Moore R, Kemler R, Capecchi MR, McMahon AP. Ectodermal Wnt3/beta-catenin signaling is required for the establishment and maintenance of the apical ectodermal ridge. Genes & Development. 2003;17:394–409. doi: 10.1101/gad.1044903. - DOI - PMC - PubMed
    1. Bell SM, Schreiner CM, Wert SE, Mucenski ML, Scott WJ, Whitsett JA. R-spondin 2 is required for normal laryngeal-tracheal, lung and limb morphogenesis. Development (Cambridge, England) 2008;135:1049–1058. doi: 10.1242/dev.013359. - DOI - PubMed
    1. Campbell LJ, Crews CM. Wound epidermis formation and function in urodele amphibian limb regeneration. Cellular and Molecular Life Sciences. 2008;65:73–79. doi: 10.1007/s00018-007-7433-z. - DOI - PMC - PubMed

Publication types

MeSH terms

Associated data