. 2022 Jun 29;7(3):e0016022.
doi: 10.1128/msphere.00160-22. Epub 2022 May 19.

Disruption of Toxoplasma gondii-Induced Host Cell DNA Replication Is Dependent on Contact Inhibition and Host Cell Type

Affiliations

Disruption of Toxoplasma gondii-Induced Host Cell DNA Replication Is Dependent on Contact Inhibition and Host Cell Type

Edwin Pierre-Louis et al. mSphere. .

Abstract

The protozoan Toxoplasma gondii is a highly successful obligate intracellular parasite that, upon invasion of its host cell, releases an array of host-modulating protein effectors to counter host defenses and further its own replication and dissemination. Early studies investigating the impact of T. gondii infection on host cell function revealed that this parasite can force normally quiescent cells to activate their cell cycle program. Prior reports by two independent groups identified the dense granule protein effector HCE1/TEEGR as being solely responsible for driving host cell transcriptional changes through its direct interaction with the cyclin E regulatory complex DP1 and associated transcription factors. Our group independently identified HCE1/TEEGR through the presence of distinct repeated regions found in a number of host nuclear targeted parasite effectors and verified its central role in initiating host cell cycle changes. Additionally, we report here the time-resolved kinetics of host cell cycle transition in response to HCE1/TEEGR, using the fluorescence ubiquitination cell cycle indicator reporter line (FUCCI), and reveal the existence of a block in S-phase progression and host DNA synthesis in several cell lines commonly used in the study of T. gondii. Importantly, we have observed that this S-phase block is not due to additional dense granule effectors but rather is dependent on the host cell line background and contact inhibition status of the host monolayer in vitro. This work highlights intriguing differences in the host response to reprogramming by the parasite and raises interesting questions regarding how parasite effectors differentially manipulate the host cell depending on the in vitro or in vivo context. IMPORTANCE Toxoplasma gondii chronically infects approximately one-third of the global population and can produce severe pathology in immunologically immature or compromised individuals. During infection, this parasite releases numerous host-targeted effector proteins that can dramatically alter the expression of a variety of host genes. A better understanding of parasite effectors and their host targets has the potential to not only provide ways to control infection but also inform us about our own basic biology. One host pathway that has been known to be altered by T. gondii infection is the cell cycle, and prior reports have identified a parasite effector, known as HCE1/TEEGR, as being responsible. In this report, we further our understanding of the kinetics of cell cycle transition induced by this effector and show that the capacity of HCE1/TEEGR to induce host cell DNA synthesis is dependent on both the cell type and the status of contact inhibition.

Keywords: FUCCI; HCE1; HCE1/TEEGR; S-phase; TEEGR; Toxoplasma gondii; cell cycle; cyclin E; host-parasite interaction; parasite effectors.


Conflict of interest statement

The authors declare no conflict of interest.

Figures
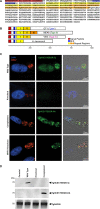
FIG 1
FIG 1
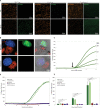
TgHCE1/TEEGR is a host nuclear targeted dense granule protein. (A) Amino acid sequence of TgHCE1/TEEGR in the GT1 type I strain displaying a predicted signal peptide in red, a nuclear localization signal (NLS) in blue, and two internal repeat sequences in yellow/orange. (B) Schematic representation of TgHCE1/TEEGR comparing type I, type II, and type III strains and the closely related species H. hammondi. The signal peptide (red), the nuclear localization signal (blue), and the differing numbers of repeated domains (light and dark orange) are highlighted. (C) HFF cells infected (20 h) with wild-type (TgHCE1/TEEGR-Ty), knockout (TgΔhce1/teegr-Ty), complement (TgΔhce1/teegr-Ty::HCE1/TEEGR-HA), and MYR1 knockout (TgΔmyr1::HCE1/TEEGR-Ty) expressing T. gondii. HCE1/TEEGR (green), dense granule marker GRA7 (red), and DAPI nuclei (blue) are highlighted. Scale bar, 10 μm. Right, merge with bright field. (D) Western blot analysis of total infected host lysates confirming Ty epitope tagging of TgHCE1/TEEGR and TgΔhce1/teegr-Ty and HA epitope tagging of TgHCE1/TEEGR in the complement.
FIG 2
FIG 2
TgHCE1/TEEGR promotes activation of the host cell cycle program. (A) Plaque assays of wild-type (TgHCE1/TEEGR-Ty), knockout (TgΔhce1/teegr-Ty), and complement (TgΔhce1/teegr-Ty::HCE1/TEEGR-HA) tachyzoites on HFF monolayers. Each well was infected with 100 parasites, and the monolayers were fixed 7 days postinfection and stained with crystal violet. (B) Volcano plot illustration of RNA-Seq data depicting fold change of genes that are statistically significant in TgΔhce1/teegr-Ty-infected HFFs showing upregulated genes (right quadrant/red dots) and downregulated genes (left quadrant/red dots and triangles). Red dots represent genes that have the highest P value with more than 1.5 log2 fold change. Red triangles are genes that are downregulated in TgΔhce1/teegr-Ty (knockout) that are involved in the cell cycle. (C) Representation of top 94 differentially expressed genes that were identified with known pathway affiliations. Following the same parameters with transcripts showing a log2 fold change of >1.5 and representing a statistically significant differential expression (adjusted P value of <0.05), they were selected and classified into 15 pathways of the most upregulated and downregulated genes in TgHCE1/TEEGR-Ty- and TgΔhce1/teegr-Ty-infected HFFs using DAVID6.8 and KEGG pathway analyses. (D) Differential expression of the top 16 genes that are upregulated (yellow) by wild type (TgHCE1/TEEGR-Ty) in infected HFF for 24 h and downregulated (blue) in knockout (TgΔhce1/teegr-Ty) in infected HFF.
FIG 3
FIG 3
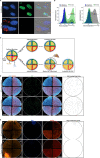
TgHCE1/TEEGR drives infected host cells into S-phase. (A) FUCCI cells infected with wild-type (TgHCE1/TEEGR-Ty), knockout (TgΔhce1/teegr-Ty), and complement (TgΔhce1/teegr-Ty::HCE1/TEEGR-HA) strain at 0 (top rows) and 20 (bottom rows) h postinfection. G1 phase (left column) and S-phase (right column) of the same field of FUCCI cells are shown. Scale bar, 400 μm. (B) FUCCI cells infected (20 h) with TgHCE1/TEEGR-Ty (top row) and TgΔhce1/teegr-Ty (bottom row) expressing T. gondii. GAP45 parasite marker (red), DAPI nuclei (blue), and S-phase FUCCI (green) are shown. Scale bar, 10 μm. Right, merge with bright field. (C) Multiplicity of infection (MOI) ratios for TgHCE1/TEEGR-Ty-infected FUCCI cells over 20 h. Ratios shown are 20:1, 10:1, 5:1, and 1:1 (T. gondii to FUCCI cell). (D and E) G1 to S-phase conversion of FUCCI cells infected with wild type (TgHCE1/TEEGR-Ty) in dark green, knockout (TgΔhce1/teegr-Ty) in red, complement (TgΔhce1/teegr-Ty::HCE1/TEEGR-HA) in light green, MYR1 knockout (TgΔmyr1) in blue, and ASP5 knockout (TgΔasp5) in purple. Results are representative of three experimental replicates quantified in panel E. Cell count represents total green nuclei in host cells. Statistical analysis was done using a Student's t test. *, P < 0.05; **, P < 0.01; ns, not significant.
FIG 4
FIG 4
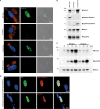
TgHCE1/TEEGR induces production of host cyclin E. (A) HFF cells infected (24 h) with wild-type (TgHCE1/TEEGR-Ty), knockout (TgΔhce1/teegr-Ty), complement (TgΔhce1/teegr-Ty::HCE1/TEEGR-HA), and MYR1 knockout expressing HCE1/TEEGR-Ty (TgΔmyr1::HCE1/TEEGR-Ty) T. gondii. Cyclin E (green), GAP45 parasite (red), and DAPI nuclei (blue) are shown. Scale, 10 μm. Right, merge with bright field. (B) Western blot analysis of cyclin E expression from wild-type (TgHCE1/TEEGR-Ty), knockout (TgΔhce1/teegr-Ty), and complement (TgΔhce1/teegr-Ty::HCE1/TEEGR-HA) strain-infected HFF cells after 24 h. (C) Western blot analysis of cyclin E expression from uninfected (UI) as well as wild-type (TgHCE1/TEEGR-Ty) and knockout (TgΔhce1/teegr-Ty) strain-infected HFF cells. Nuclear lysates were collected at 8, 16, and 24 h postinfection. (D) HFF cells transfected with pGFP-HCE1/TEEGR-Ty (24 h). DAPI nuclei (blue), GFP (green), cyclin E (red, top), and Ty-epitope (red, bottom) are shown. Scale bar, 20 μm. Right, merge.
FIG 5
FIG 5
Infected HFF and FUCCI cells in S-phase are unable to synthesize new DNA. (A) HFF cells were incubated with EdU and either left uninfected or infected with wild type (TgHCE1/TEEGR-Ty). Monolayers were fixed after 24 h and stained for EdU incorporation using Alexa Fluor 488 (green), parasites using α-GAP45 (red), and nuclei using DAPI (blue). Scale bar, 100 μm. (B) Histogram of FUCCI cells analyzed by flow cytometry. Cells were incubated with EdU and either uninfected, grown in 1% or 20% serum, or infected with wild-type (TgHCE1/TEEGR-Ty) T. gondii. Cells were fixed at 24 h and labeled with EdU and Alexa Fluor 405. (C) Schematic displaying the procedure for the wound healing assay to assess contact inhibition. Pink box represents area of zoom. (D and E) Wound healing assay either in the presence (+ contact inhibition) or absence (− contact inhibition) of contact inhibition using HFF (D) or FUCCI (E) cells. Cells were either left uninfected (UI) or infected with wild-type (TgHCE1/TEEGR-Ty), knockout (TgΔhce1/teegr-Ty), or complement (TgΔhce1/teegr-Ty::HCE1/TEEGR-HA) lines. Monolayers were then incubated for 24 h with EdU in medium containing 1% serum. The areas to the right in panels D and E represent the inverted gray scale of the original EdU from panels D and E. Graphs represent three biological replicates. Scale, 3,000 μm.
FIG 6
FIG 6
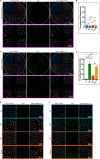
TgHCE1/TEEGR induces S-phase DNA replication in primary mouse fibroblasts upon removal of contact inhibition. (A) Wound healing assay using mouse fibroblasts (MF) in the presence of contact inhibition. Host cell DNA was stained with DAPI (blue), and parasites were stained with GAP45 (red) and EdU (green). (Top) View of all 4 quadrants with uninfected (UI), infected WT (TgHCE1/TEEGR-Ty), KO (TgΔhce1/teegr-Ty), or Comp (TgΔhce1/teegr-Ty::HCE1/TEEGR-HA) parasite lines (scale, 3,000 μm). (Bottom) Zoom of central junction of 4-quadrant dish (scale, 1,000 μm). (B) Quantitation of 3 biological replicates of panel A. (C) Wound healing assay as in panel A with contact inhibition removed. (Top) All quadrants (scale, 3,000 μm). (Bottom) Zoom of central junction of 4-quadrant dish (scale, 1,000 μm). (D) Quantitation of 3 biological replicates of panel C. (E) Zoom of central portion of each quadrant (A, + contact inhibition) (scale, 300 μm). (F) Zoom of central portion of each quadrant (C, − contact inhibition) (scale, 300 μm). Confluent monolayers were then incubated for 20 h with EdU in media containing 1% serum. Graphs represent three biological replicates comparing the different conditions in the presence or absence of contact inhibition. Statistical analysis was done using one-way ANOVA. *, P < 0.05; **, P < 0.01; ***, P < 0.001;  ns, not significant.

Similar articles

Cited by

References

    1. Pappas G, Roussos N, Falagas ME. 2009. Toxoplasmosis snapshots: global status of Toxoplasma gondii seroprevalence, and implications for pregnancy and congenital toxoplasmosis. Int J Parasitol 39:1385–1394. doi:10.1016/j.ijpara.2009.04.003. - DOI - PubMed
    1. Dubey JP, Beattie CP. 1988. Toxoplasmosis of animals and man. CRC Press, Boca Raton, FL.
    1. Chitnis CE, Blackman MJ. 2000. Host cell invasion by malaria parasites. Parasitol Today 16:411–415. doi:10.1016/S0169-4758(00)01756-7. - DOI - PubMed
    1. Hakimi MA, Olias P, Sibley LD. 2017. Toxoplasma effectors targeting host signaling and transcription. Clin Microbiol Rev 30:615–645. doi:10.1128/CMR.00005-17. - DOI - PMC - PubMed
    1. Dubey JP. 2007. The history and life cycle of Toxoplasma gondii, p 1–17. In Weiss LM, Kim K (ed), Toxoplasma gondii, the model Apicomplexan: perspectives and methods. Elsevier, New York, NY.

Publication types

LinkOut - more resources