. 2022 Jul 1;10(7):871-884.
doi: 10.1158/2326-6066.CIR-21-0691.

P2RX7 Enhances Tumor Control by CD8+ T Cells in Adoptive Cell Therapy

Affiliations

P2RX7 Enhances Tumor Control by CD8+ T Cells in Adoptive Cell Therapy

Kelsey M Wanhainen et al. Cancer Immunol Res. .

Abstract

Expression of the purinergic receptor P2RX7 by CD8+ T cells promotes the generation of memory populations following acute infections. However, data suggest that P2RX7 may limit the efficacy of antitumor responses. Herein, we show that P2RX7 is beneficial for optimal melanoma control in a mouse CD8+ T-cell adoptive transfer model. Tumor-specific P2rx7-/- CD8+ T cells exhibited impaired mitochondrial maintenance and function but did not display signs of overt exhaustion early in the antitumor response. However, as the tumor burden increased, the relative frequency of P2RX7-deficient CD8+ T cells declined within the tumor; this correlated with reduced proliferation, increased apoptosis, and mitochondrial dysfunction. Extending these studies, we found that the transient in vitro stimulation of P2RX7 using the ATP analogue BzATP led to enhanced B16 melanoma control by CD8+ T cells. These findings are in keeping with the concept that extracellular ATP (eATP) sensing by P2RX7 on CD8+ T cells is required for their ability to efficiently eliminate tumors by promoting mitochondrial fitness and underscore the potential for P2RX7 stimulation as a novel therapeutic treatment to enhance tumor immunotherapy.


Conflict of interest statement

Disclosures: The authors declare no potential conflicts of interest

Figures

Fig. 1:
Fig. 1:. P2RX7 is required for IL12-primed CD8+ T cells to effectively control tumors.
a) C57BL/6 or B6.SJL mice were injected with 3×10⁵ B16.gp33 melanoma cells subcutaneously. and once tumors became palpable (~7 days post-injection) 5×10⁵ WT or P2rx7−/− P14 cells were transferred i.v. after 72 hours activation with anti-CD3/-CD28 and 2.5 IU/mL IL2, with (b-c) or without (d) 5 ng/mL IL12. b) Survival curve and c) tumor growth curves for individual tumor-bearing mice that received no cell transfer (n=27), WT P14 cells (n=23), or P2rx7−/− P14 cells (n=18) activated with IL12 priming. d) Survival curve for tumor-bearing mice that received WT (n=15) or P2rx7−/− (n=9) P14 cells activated without IL12. Endpoint criteria for survival experiments were tumor ulceration or an area of 120mm2 (indicated by dashed line). Data are from 2–3 independent experiments. Bars show mean ± SEM. *, P ≤ 0.05; **, P ≤ 0.01; ***, P ≤ 0.001; ****, P ≤ 0.0001. Statistical significance for b, d determined by a log-rank Mantel-Cox test.
Fig. 2:
Fig. 2:. Tumor-specific P2rx7−/− CD8+ T cells within dLN have increased expression of exhaustion markers.
WT or P2rx7−/− P14 cells (activated in the presence of IL12) were transferred into C57BL/6 or B6.SJL with palpable B16.gp33 tumors. Tumors, tumor dLNs, and spleens were harvested from recipient mice 7 days after T-cell transfer. a) Number of live P14 cells per gram tumor and within dLN and spleen. b) Percentage of Tim3+ P14 cells within tumor (left) and dLN (right). c) PD1 gMFI of P14 cells within tumor (left) and dLN (right). d) Percentage of GzmB+ P14 cells post-ex vivo restimulation with PMA/Ionomycin. Data are from 3–4 independent experiments with 25 mice per group. Graphical data shown as means with error bars indicating SEM. *, P ≤ 0.05; **, P ≤ 0.01; ***, P ≤ 0.001. Statistical significance determined by a two-tailed, unpaired t-test.
Fig. 3:
Fig. 3:. P2rx7−/− CD8+ T cells show signs of mitochondrial dysfunction.
Activated WT or P2rx7−/− P14 cells were cultured with IL12 then transferred into C57BL/6 or B6.SJL bearing palpable B16.gp33 tumors. Tumors, tumor dLNs and spleens were harvested from recipient mice 7 days after T-cell transfer. Mitochondrial mass and membrane potential were measured in WT and P2rx7−/− P14 cells within tumors of B16.gp33-engrafted mice by MTG and TMRE gMFI, respectively. Fold changes of a) MTG gMFI, b) TMRE gMFI, c) relative TMRE gMFI (normalized to MTG gMFI). (a-c) For each independent experiment, fold change in gMFI for the indicated molecular probe was calculated relative to average gMFI of donor WT P14 cells within the spleen. d) Frequency of P14 cells with depolarized (MTGhiTMRElo) mitochondria. Data are from 3 independent experiments with 25 mice per group. Graphical data shown as means with error bars indicating SEM. *, P ≤ 0.05; **, P ≤ 0.01; ***, P ≤ 0.001; ****, P ≤ 0.0001. Statistical significance determined by a two-tailed, unpaired t-test.
Fig. 4:
Fig. 4:. Cell-intrisic defects in P2rx7−/− CD8+ T cells responding to tumor growth.
Equal numbers of activated WT and P2rx7−/− OT-I cells (activated with IL12) were co-transferred into C57BL/6 or B6.SJL with palpable B16.OVA tumors. Tumors, tumor dLNs, and spleens were harvested from recipient mice 7 and 18 days after T-cell transfer. a) Weight of tumors from B16.OVA engrafted mice at indicated time of harvest. b) Ratio P2rx7−/ /WT OT-I donor cells within tumor at days 7 and 18 after T-cell transfer. c) Frequency of donor WT or P2rx7−/− OT-I cells that express (from left) CD39, Tim3, PD1, and Lag3 at each time point was determined and ratio P2rx7−/−/WT OT-I cells within each population was calculated to indicate change in expression of each marker at day 7 versus day 18. d) Ex vivo expression of IFNγ in WT versus P2rx7−/− OT-I cells from tumors of mice harvested at day 18. e) Frequency of apoptotic donor OT-I cells based on Annexin V+ and propidium iodide (PI) and LiveDead (LD). f) Frequency of proliferating (Ki67+) donor cells within tumor and tumor dLN. g) Frequency of OT-I donor cells within the tumors of mice harvested at day 18 that express CD103 (left) and expression levels (right). Fold changes were calculated by normalizing the average gMFI of the indicated molecular probe in splenic T cells. Data are from 2–4 independent experiments with 10–48 mice per group. *, P ≤ 0.05; **, P ≤ 0.01; ***, P ≤ 0.001; ****, P ≤ 0.0001. Statistical significance determined by a two-tailed, paired t-test.
Fig. 5:
Fig. 5:. Impaired mitochondrial fitness of P2rx7−/− CD8+ T cells is cell-intrinsic.
Equal numbers of WT and P2rx7−/− OT-I CD8+ T cells were activated in the presence of IL12 and equal numbers of cells were co-transferred into mice with palpable B16.OVA tumors. Tumors, tumor dLNs, and spleens were harvested from recipient mice 7 and 18 days after T-cell transfer. a) Frequency of OT-I donor cells with depolarized (MTGhiTMRElo) mitochondria within the tumors of mice harvested at days 7 or 18. Fold changes of b) MTG gMFI, c) TMRE gMFI, d) relative TMRE gMFI (normalized to MTG gMFI) in OT-I donor cells from tumors and dLN at indicated time points.(b-d) For each independent experiment, fold change in gMFI of indicated molecular probe was calculated relative to average gMFI of donor WT P14 cells within the spleen. e) Frequency of OT-I donor cells producing mitochodrial ROS, as indicated by MitoSOX+, within tumors harvested at day 18. Data are from 3–4 independent experiments with 17–21 mice per group. *, P ≤ 0.05; **, P ≤ 0.01; ***, P ≤ 0.001; ****, P ≤ 0.0001. Statistical significance determined by a two-tailed, paired t-test.
Fig. 6:
Fig. 6:. Metabolic defects in P2rx7−/− CD8+ T cells arise during in vitro activation.
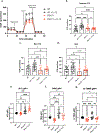
WT and P2rx7−/− P14 cells were activated for 72 hours in vitro with anti-CD3, anti-CD28, IL2, and +/− IL12. (a-d) Oxygen consumption rate (OCR) of indicated groups after 72 hour activation was evaluated using Seahorse Extracellular Flux assay. a) OCRs were determined for the indicated groups after sequential addition of the listed inhibitors. b) Baseline OCR of indicated groups (determined prior to Oligomycin addition). c) Maximum OCR of indicated groups (determined after FCCP addition). d) Spare respiratory capacity (SRC) of indicated groups (calculated based on difference between Max OCR and baseline OCR). (e-g) Mitochondrial mass and membrane potential was measured in WT and P2rx7−/− P14 cells after in vitro activation by evaluating levels of MTG or TMRE, respectively. Fold changes of e) MTG gMFI, f) TMRE gMFI, and g) relative TMRE gMFI (normalized to MTG gMFI). (e-g) For each independent experiment, fold change in gMFI of indicated molecular probe was calculated relative to average gMFI of WT (untreated) P14 cells. Data are from 3–5 independent experiments. Graphical data shown as means with error bars indicating SEM. *, P ≤ 0.05; **, P ≤ 0.01; ***, P ≤ 0.001; ****, P ≤ 0.0001. Statistical significance determined by One-way ANOVA.
Fig. 7:
Fig. 7:. P2RX7 agonism during in vitro activation improves survival and tumor control of WT CD8+ T cells.
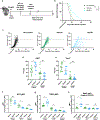
a) C57BL/6 or B6.SJL were injected with 3×10⁵ B16.gp33 melanoma subcutaneously and once tumors became palpable (~7 days post-injection) 5×10⁵ P14 cells were transferred i.v. after 72 hours activation with anti-CD3/-CD28, 2.5 IU/mL IL2, and +/− 100uM of BzATP (or vehicle dH2O treatment) every 24 hours of activation. b) Survival curves and c) tumor growth curves for tumor-bearing mice that received vehicle-treated WT P14 cells (n=25), BzATP-treated WT P14 (n=20), or no T-cell transfer (n=40). (d-h) Tumors, tumor dLN and spleens from mice with B16.gp33 tumors that received either vehicle- or BzATP-treated WT P14 donor cells were harvested at day 7 after T-cell transfer to determine: d) frequency of Ki67+ P14 cells; e) frequency of Tim3+ P14 cells; f) mitochondrial mass (MTG staining gMFI); g) mitochondrial membrane potential (TMRE gMFI), and h) relative TMRE gMFI. In f-h), values were normalized to vehicle-treated WT P14 cells in the spleen. (f-h) For each independent experiment, fold change in gMFI of indicated molecular probe was calculated relative to average gMFI of vehicle-treated WT P14 cells within the spleen. (b-c) Endpoint criteria for survival experiments were tumor ulceration or an area of 120mm2 (indicated by dashed line). Data are from 3 independent experiments. Graphical data shown as means with error bars indicating SEM. *, P ≤ 0.05; **, P ≤ 0.01; ***, P ≤ 0.001; ****, P ≤ 0.0001. Statistical significance for b determined by a log-rank Mantel–Cox test. Statistical significance for d-h evaluated by a two-tailed, unpaired t-test.

References

    1. Di Virgilio F, et al., The P2X7 Receptor in Infection and Inflammation. Immunity, 2017. 47(1): p. 15–31. - PubMed
    1. Rissiek B, et al., P2X7 on Mouse T Cells: One Channel, Many Functions. Front Immunol, 2015. 6: p. 204. - PMC - PubMed
    1. Pellegatti P, et al., Increased level of extracellular ATP at tumor sites: in vivo imaging with plasma membrane luciferase. PLoS One, 2008. 3(7): p. e2599. - PMC - PubMed
    1. Ghiringhelli F, et al., Activation of the NLRP3 inflammasome in dendritic cells induces IL-1beta-dependent adaptive immunity against tumors. Nat Med, 2009. 15(10): p. 1170–8. - PubMed
    1. Adinolfi E, et al., Accelerated tumor progression in mice lacking the ATP receptor P2X7. Cancer Res, 2015. 75(4): p. 635–44. - PubMed

Publication types

MeSH terms

Substances