. 2022 Nov;112(5):1343-1356.
doi: 10.1002/JLB.4MA0422-616R. Epub 2022 May 19.

HIV-1-induced type I IFNs promote viral latency in macrophages

Affiliations

HIV-1-induced type I IFNs promote viral latency in macrophages

Laura L Dickey et al. J Leukoc Biol. 2022 Nov.

Abstract

Macrophages chronically infected with HIV-1 serve as a reservoir that contributes to HIV-1 persistence during antiretroviral therapy; however, the mechanisms governing the establishment and maintenance of this virus reservoir have not been fully elucidated. Here, we show that HIV-1 enters a state reminiscent of latency in monocyte-derived macrophages (MDMs), characterized by integrated proviral DNA with decreased viral transcription. This quiescent state is associated with decreased NF-κB p65, RNA polymerase II, and p-TEFb recruitment to the HIV-1 promoter as well as maintenance of promoter chromatin in a transcriptionally nonpermissive state. MDM transition to viral latency is mediated by type I IFN signaling, as inhibiting type I IFN signaling or blocking type 1 IFN prevents the establishment of latent infection. Knockdown studies demonstrate that the innate immune signaling molecule mitochondrial antiviral signaling protein (MAVS) is required for the transition to latency. Finally, we demonstrate a role for the viral accessory protein Vpr in the establishment of HIV-1 latency in macrophages. Our data indicate that HIV-1-induced type I IFN production is responsible for the establishment of viral latency in MDMs and identify possible therapeutic targets for the prevention or elimination of this important HIV-1 reservoir.

Keywords: HIV-1; IFN; MAVS; NF-κB; latency; macrophage.


Conflict of interest statement

The authors declare no conflict of interest

Figures

FIGURE 1
FIGURE 1
HIV‐1 enters a state resembling latency in MDMs during extended time in culture. (A–D). MDMs (5 × 105 cells/well) were infected with VSV‐G‐pseudotyped DHIV3‐nanoluciferase and cultured for up to 24 days. Culture supernatant was sampled every 3 days and viral replication was measured by nanoluciferase activity. Viral replication in MDMs from 1 representative donor (A and C) and comparison of peak and endpoint viral replication in MDMs from all donors (C and D) are shown. (E) Viability of MDMs infected and cultured as in (A). (F) Comparison of MDM donor sex demonstrating latent and not latent viral replication. Male donors: 11 latent (black) and 2 not latent (gray). Female donors: 7 latent (black) and 6 not latent (gray). (G) Comparison of peak replication levels in MDMs demonstrating latent and not latent viral replication. (H) MDMs (1 × 106/well) were infected as in (A), and cytoplasmic RNA was isolated at days 6 and 24 postinfection. HIV‐1 transcription was measured by RT‐qPCR. (I and J) MDMs (1 × 106/well) were infected as in (A). Cellular DNA was isolated at days 6 and 24 postinfection. Total (I) and integrated (J) HIV‐1 DNA was measured by qPCR. (K) MDMs were infected as in (A) and cultured for 24 days. At day 24 postinfection, MDMs were treated with PAM3CSK4 (100 ng/ml), TNF‐ α (50 ng/ml), PMA (100 nM), or vehicle control. Culture supernatant was sampled 3 days after treatment and viral replication was measured by nanoluciferase activity. (L and M) MDMs (5 × 105 cells/well) were infected with replication competent HIV‐1BaL and cultured for up to 24 days. Culture supernatant was sampled every 3 days and viral replication was measured by p24 ELISA. Viral replication in MDMs from 1 representative donor (L) and comparison of peak and endpoint viral replication in MDMs from all donors (M) are shown. Statistical analysis: two‐tailed t‐test (B, D, E, H, I, J, K, M); one‐tailed t‐test (G), and Fisher's exact test (F)
FIGURE 2
FIGURE 2
HIV‐1 enters a latent state in individual MDMs. (A and B) MDMs (5 × 105 cells/well) were infected with VSV‐G‐pseudotyped DHIV3‐GFP or VSV‐G‐pseudotyped DHIV3‐mCherry and cultured for up to 24 days. Cells were sampled at the indicated days postinfection and viral replication was measured by flow cytometry. Viral replication in MDMs from 1 representative donor (A) and comparison of viral replication in MDMs from all donors (B) are shown. (C) Viability of HIV‐1 infected and uninfected MDMs was monitored during culture. (D) MDMs (5 × 105 cells/well) were treated with Vpx VLPs and subsequently infected with VSV‐G‐pseudotyped DHIV3‐GFP and cultured for up to 24 days. At day 24 postinfection, MDMs were treated with TNF‐α (50 ng/ml), PMA (100 nM), or vehicle control. Viral replication was measured by flow cytometry. (E and F) MDMs (1.2 × 107 cells) were infected with HIV‐1BaL expressing murine CD24 and sorted at day 3 or 6 postinfection to enrich for HIV‐1‐infected MDMs. Sorted MDMs were cultured for an addition 18–21 days and viral replication was measured by flow cytometry. One representative donor is shown (E) and composite data from 5 donors are shown (F). (G) Viability of HIV‐1 infected and uninfected MDMs was monitored during culture. (H) A subset of sorted MDMs were treated at day 24 with TNF‐α (50 ng/ml), PMA (100 nM), or vehicle control and viral replication was measured by flow cytometry. Statistical analysis: two‐tailed t‐test (B, C, D, F, G, and H)
FIGURE 3
FIGURE 3
Latent HIV‐1 infection in MDMs is associated with changes in transcription factor recruitment and chromatin structure at the 5′ LTR. (A) MDMs (1.2 × 107 cells) were infected with VSV‐G‐pseudotyped DHIV3‐GFP and cultured for up to 24 days. Cells were harvested at day 6 or 24 postinfection, fixed with formaldehyde, lysed, sonicated, and subjected to immunoprecipitation with antibodies against NF‐κB p65, RNA polymerase II, Cyclin T1, or rabbit IgG (isotype control). Association with the HIV‐1 5′ LTR was assessed by PCR using HIV‐1 specific primers. (B) MDMs were infected as in (A) and cultured for up to 24 days. At day 6 or 24 postinfection, nuclei were prepared from the cells and digested with EcoRV or AflII to evaluate accessibility at Nuc‐0 and Nuc‐1, respectively. (C) MDMs (1 × 106/well) were infected as in (A), and cytoplasmic RNA was isolated at days 6 and 24 postinfection. HIV‐1 transcription was measured by RT‐qPCR. Transcription initiation was measured using primers for TAR and transcription elongation was measured using primers for tat exon 1 as described previously. Statistical analysis: two‐tailed t‐test (A, B, and C)
FIGURE 4
FIGURE 4
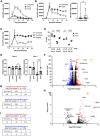
HIV‐1 latency is induced by type I IFN signaling. (A) MDMs (5 × 105/well) were infected with VSV‐G‐pseudotyped DHIV3‐nanoluciferase and cultured for up to 24 days. MDMs were treated with a single dose of IFN‐α or IFN‐β at day 3 postinfection. Viral replication was measured by luciferase assay. Data from 1 representative donor (of 3) are shown. (B) MDMs (5 × 105 cells/well) were infected with VSV‐G‐pseudotyped DHIV3‐nanoluciferase and cultured for up to 24 days in the absence or presence of the soluble type I IFN inhibitor, B18R (100 ng/ml), starting at day 6 postinfection. Viral replication was measured by nanoluciferase assay. Data from 1 representative donor and composite endpoint data from 12 donors are shown. (C) MDMs were infected as in (B) and cultured for up to 24 days in the absence or presence of ruxolitinib (10 μM), itacitinib (10 μM), or vehicle control starting at day 6 postinfection. Viral replication was measured by nanoluciferase assay. Data from 1 representative donor (of 5) are shown. (D) MDMs (1.2 × 107 cells) were infected with VSV‐G‐pseudotyped DHIV3‐GFP and cultured for up to 24 days in the absence or presence of B18R (100 ng/ml), starting at day 3 postinfection. Cells were harvested at day 6 or 24 postinfection, fixed with formaldehyde, lysed, sonicated, and subjected to immunoprecipitation with antibodies against NF‐κB p65, RNA polymerase II, or rabbit IgG (isotype control). Association with the HIV‐1 5′ LTR was assessed by PCR using HIV‐1 specific primers. (E) MDMs were infected and cultured as in (D). At day 6 or 24 postinfection, nuclei were prepared from the cells and digested with EcoRV or AflII to evaluate accessibility at Nuc‐0 and Nuc‐1, respectively. (F–I) MDMs from 4 donors (2 males and 2 females) were infected with A‐MLV‐pseudotyped DHIV3‐mCherry and cultured for 7 days. At day 7 postinfection, the MDMs were harvested and submitted for scRNASeq. A volcano plot comparing parallel HIV‐1‐infected and uninfected MDMs is shown in (F). Data from uninfected and infected MDMs were analyzed using the Interferome database to assess for enrichment for IRGs (G). Infected MDMs were stratified by mCherry (HIV‐1) mRNA expression. A volcano plot comparing MDMs with high levels of mCherry transcripts and those with low levels of mCherry transcripts is shown in (H). Data from uninfected and infected MDMs were analyzed using the Interferome database to assess for enrichment for IRGs (I). Statistical analysis: two‐tailed t‐test (B, D, and E)
FIGURE 5
FIGURE 5
MAVS signaling is required for the establishment of HIV‐1 latency in MDMs. (A) MDMs (5 × 105 cells/well) were infected with VSV‐G‐pseudotyped DHIV3‐nanoluciferase and cultured for up to 24 days in the absence or presence of the TBK1 inhibitor, BX795 (1 μM) starting at day 6 postinfection. Viral replication was measured by nanoluciferase assay. Data from 1 representative donor (of 5) are shown. (B) MDMs were infected as in (A) and cultured for up to 24 days in the presence or absence of inhibitors to TLR3 (TLR3 inhibitor, 10 μM), TLR7/8 (ODN 20959, 5 μM), endosomal acidification (Bafilomycin A1, 100 nM) or PKR (2‐AP, 1 mM), starting at day 6 postinfection. Viral replication was measured by nanoluciferase assay. Data from 1 representative donor (of 3) are shown. (C) MDMs were infected as in A and cultured for up to 24 days in the presence or absence of inhibitors to STING (H‐151, 15 μM), cGAS (G150, 10 μM and RU.521, 48.2 μM), or cGAS/TLR9 (A151, 10 μM) starting at day 6 postinfection. Viral replication was measured by nanoluciferase assay. Data from 1 representative donor (of 5) are shown. (D–G) MDMs (2 × 106 cells/well) were treated with Vpx VLPs and then infected with retroviral particles encoding the indicated shRNAs and a puromycin resistance gene. MDMs were selected in puromycin for 5 days and knockdown was assessed by immunoblot (D). Puromycin‐selected MDMs were then infected with VSV‐G‐pseudotyped DHIV3‐GFP, cultured for 3 days, and analyzed by flow cytometry (E). Puromycin‐selected MDMs were infected with VSV‐G‐pseudotyped DHIV3‐nanoluciferase and cultured for up to 18 days. Culture supernatant was sampled every 3 days and viral replication was measured by nanoluciferase activity. Data from 1 representative donor (F) and composite relative replication (ratio of endpoint to peak viral replication) data from 7 donors (G) are shown. Statistical analysis: two‐tailed t‐test (E and G)
FIGURE 6
FIGURE 6
HIV‐1 accessory protein Vpr contributes to the establishment of latency. MDMs (5 × 105 cells/well) were infected with wild‐type HIV‐1BaL, HIV‐1BaL ΔVpr, HIV‐1BaL ΔVpu, HIV‐1BaL ΔVif, HIV‐1BaL Vpr R80A, or HIV‐1BaL Vpr Q54R and cultured for up to up to 24 days. (A) IFN‐β production was measured by ELISA at day 3 postinfection. (B and C) Viral replication was measured by p24 ELISA. Data from 1 representative donor (B) and composite relative replication (ratio of endpoint to peak replication) data from up to 7 donors (C) are shown. Statistical analysis: two‐tailed t‐test (A)

References

    1. Gallant J, Hsue PY, Shreay S, Meyer N. Comorbidities among US patients with prevalent HIV INFECTION‐A trend analysis. J Infect Dis. 2017;216:1525‐1533. - PubMed
    1. Finzi D, Hermankova M, Pierson T, et al. Identification of a reservoir for HIV‐1 in patients on highly active antiretroviral therapy. Science. 1997;278:1295‐300. - PubMed
    1. Chun TW, Carruth L, Finzi D, et al. Quantification of latent tissue reservoirs and total body viral load in HIV‐1 infection. Nature. 1997;387:183‐8. - PubMed
    1. Wong JK, Hezareh M, Gunthard HF, et al. Recovery of replication‐competent HIV despite prolonged suppression of plasma viremia. Science. 1997;278:1291‐5. - PubMed
    1. Bosque A, Planelles V. Induction of HIV‐1 latency and reactivation in primary memory CD4+ T cells. Blood. 2009;113:58‐65. - PMC - PubMed

Publication types