. 2022 May 19:11:e75046.
doi: 10.7554/eLife.75046.

A crowd of BashTheBug volunteers reproducibly and accurately measure the minimum inhibitory concentrations of 13 antitubercular drugs from photographs of 96-well broth microdilution plates

Collaborators, Affiliations

A crowd of BashTheBug volunteers reproducibly and accurately measure the minimum inhibitory concentrations of 13 antitubercular drugs from photographs of 96-well broth microdilution plates

Philip W Fowler et al. Elife. .

Abstract

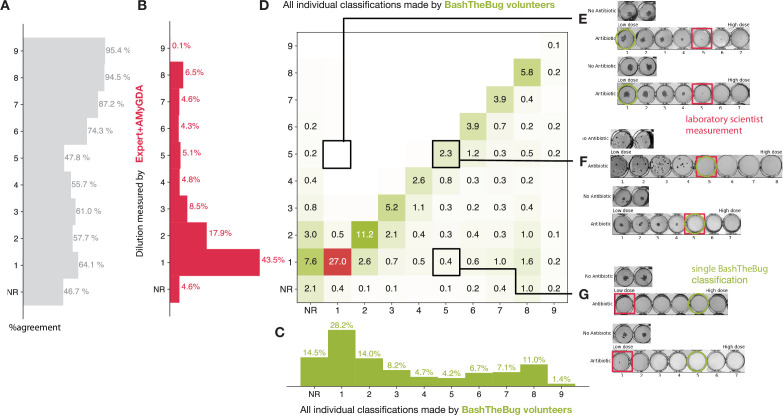
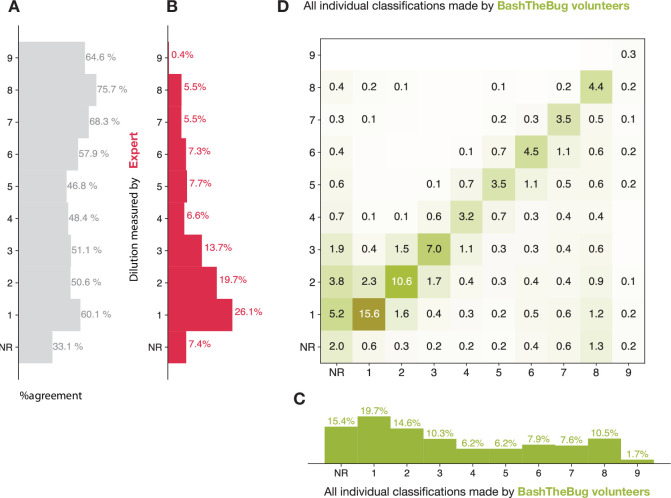
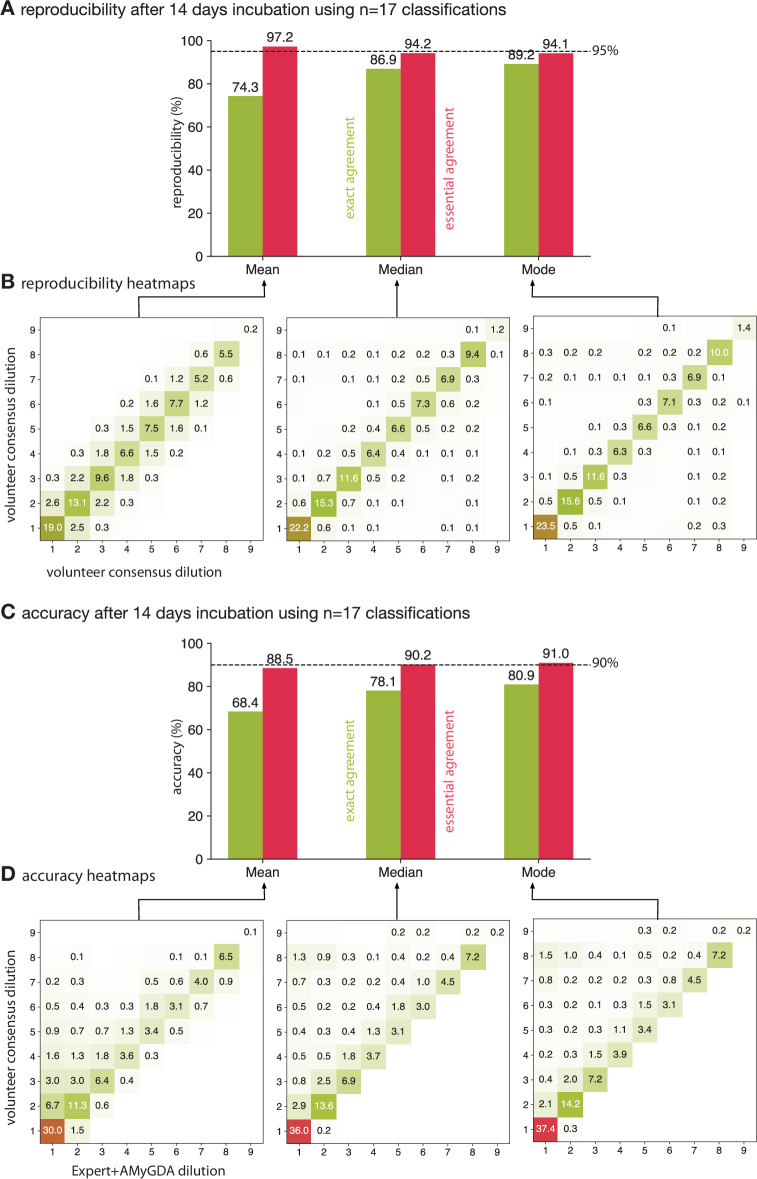
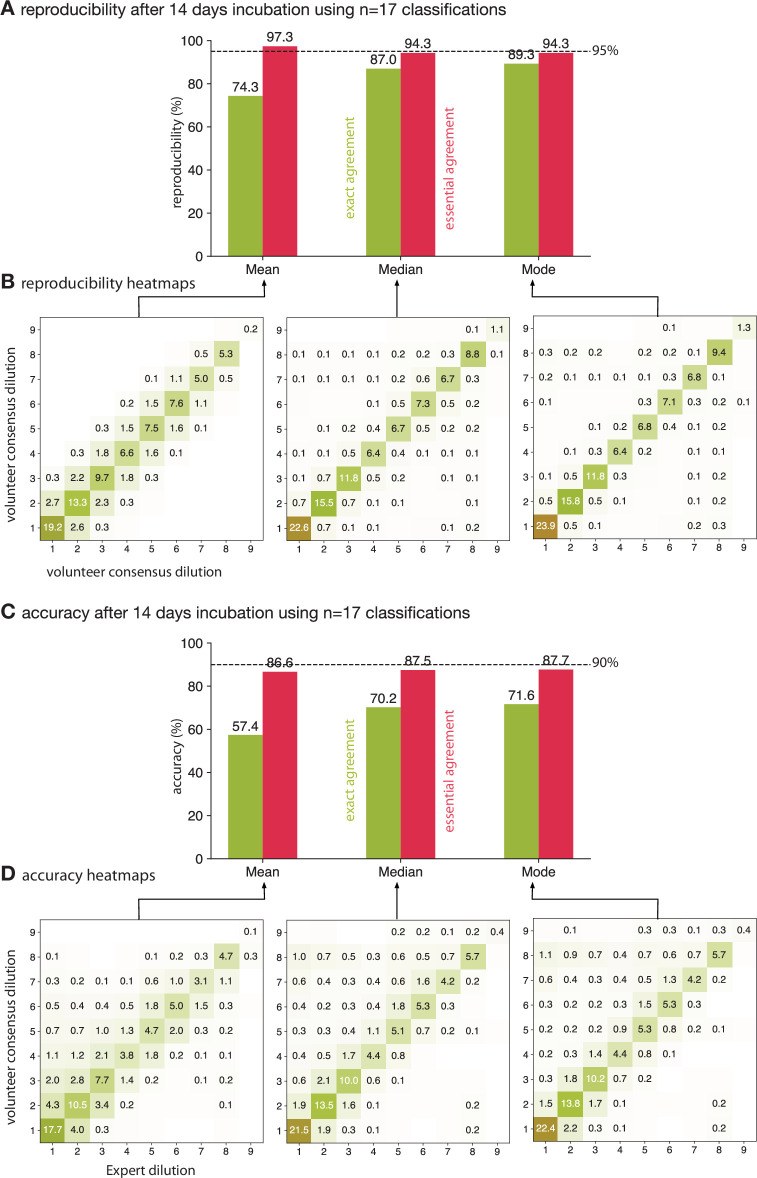
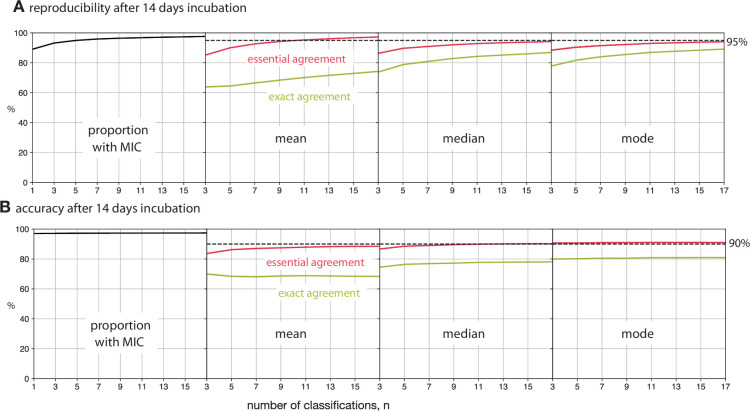
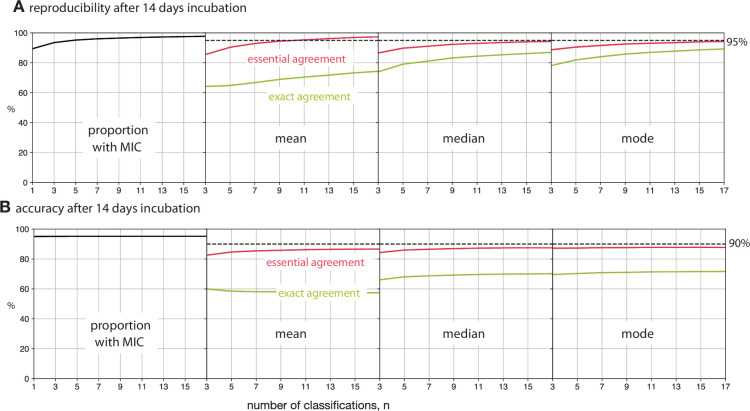
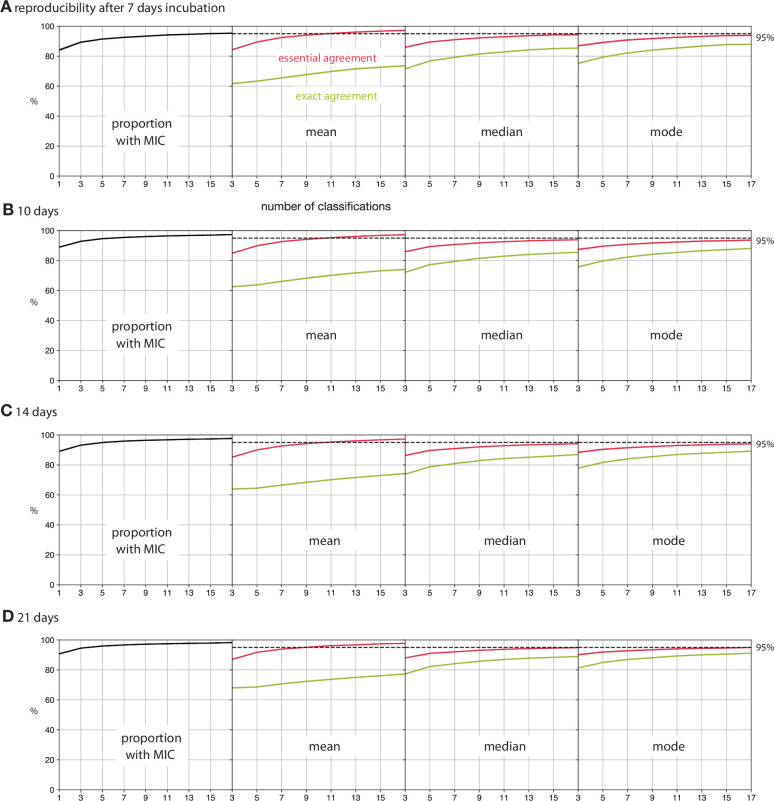
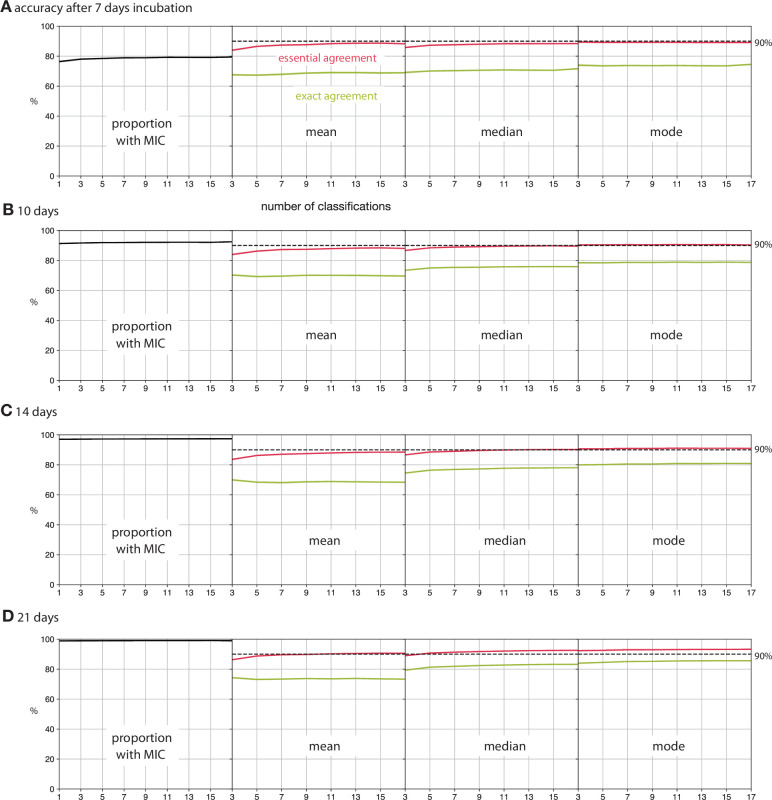
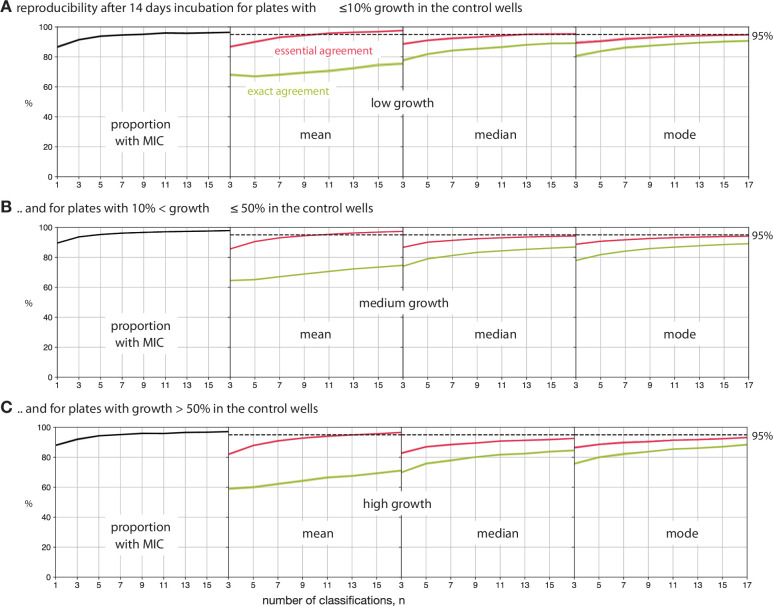
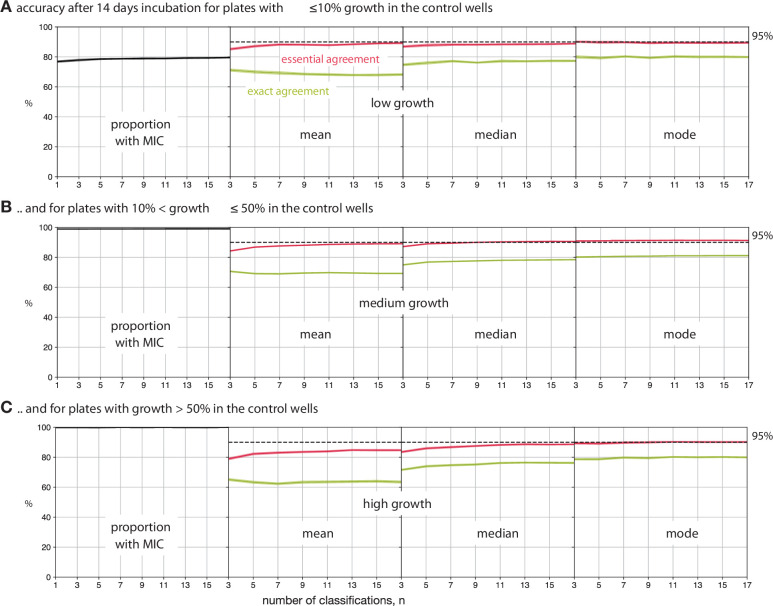
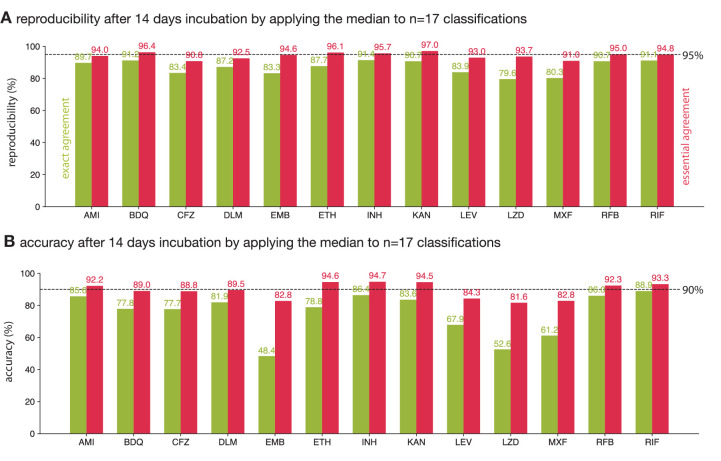
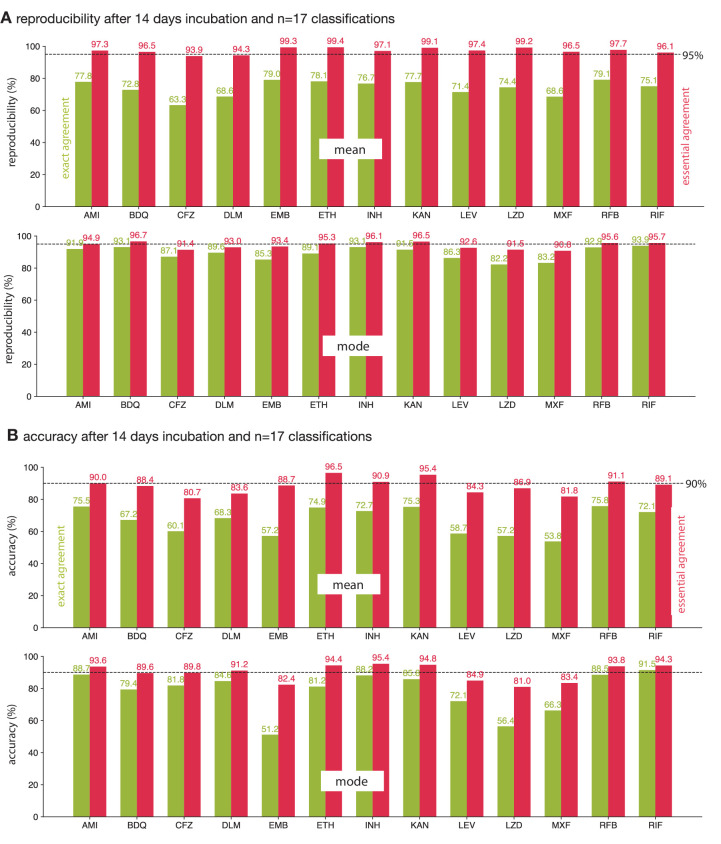
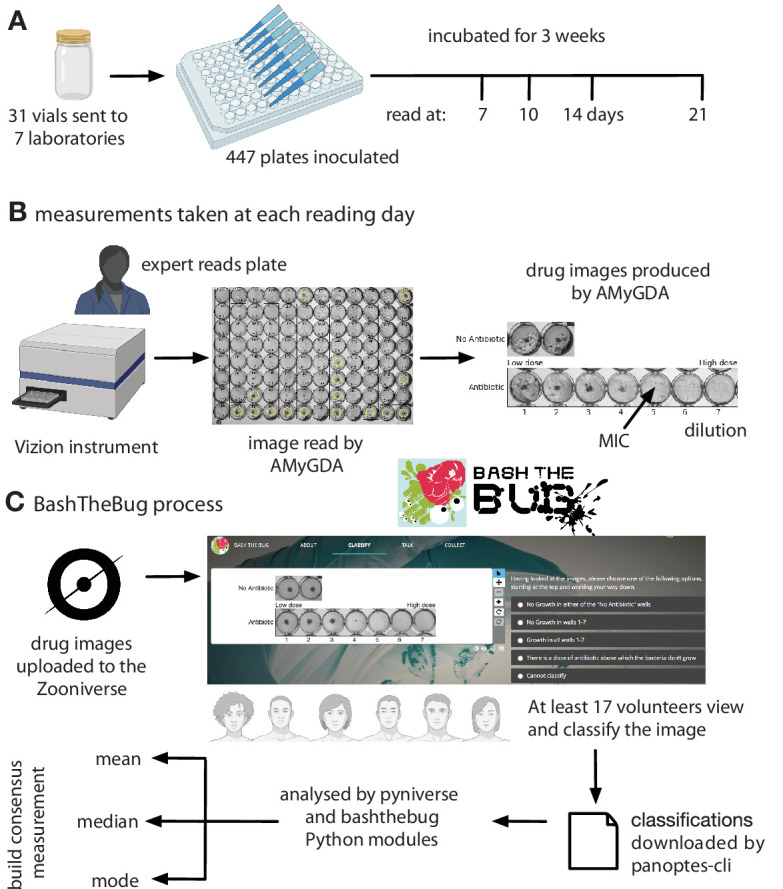
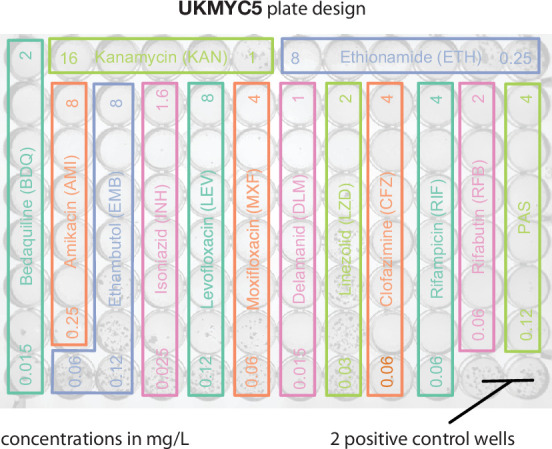
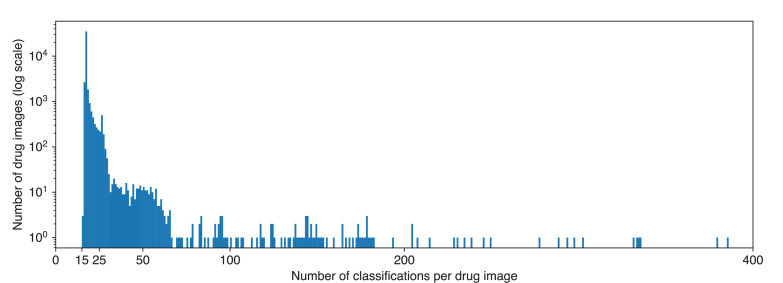
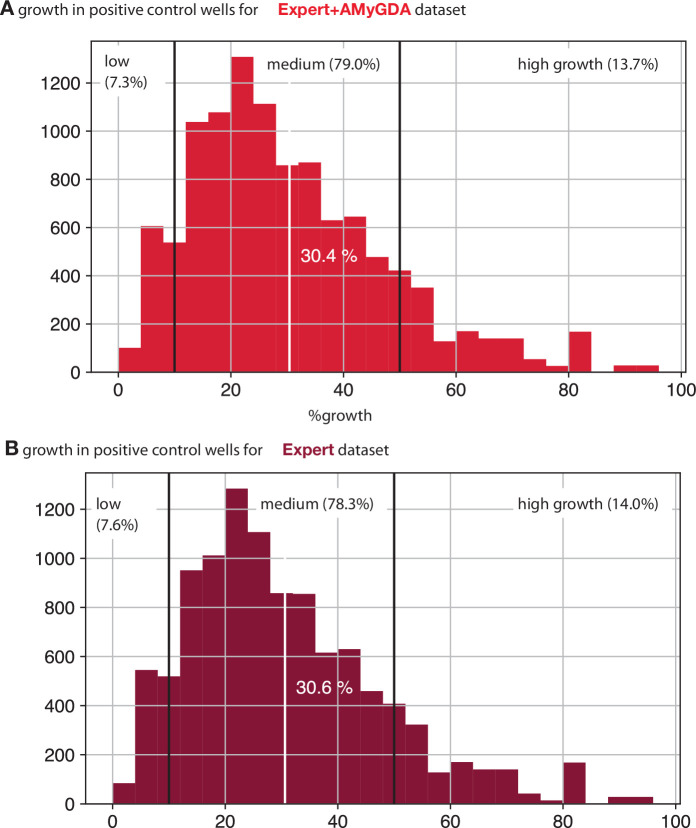
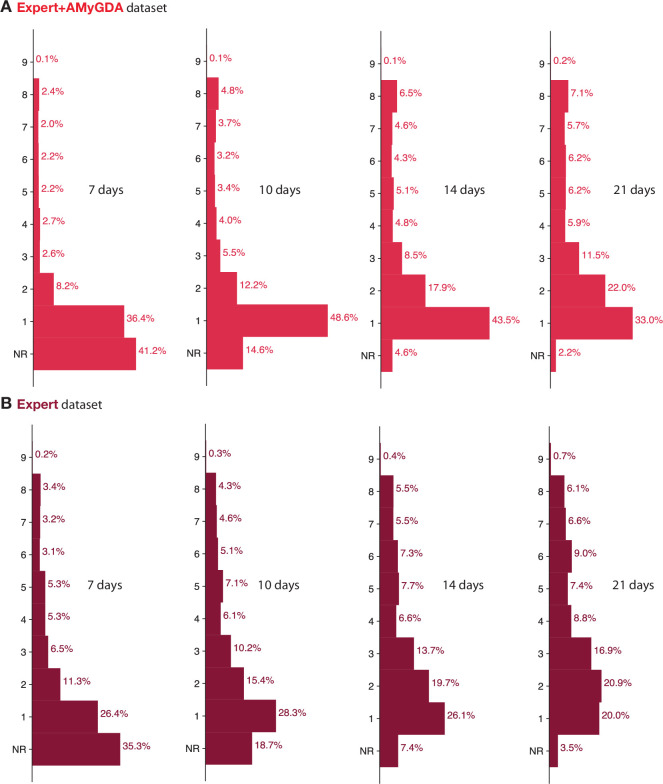
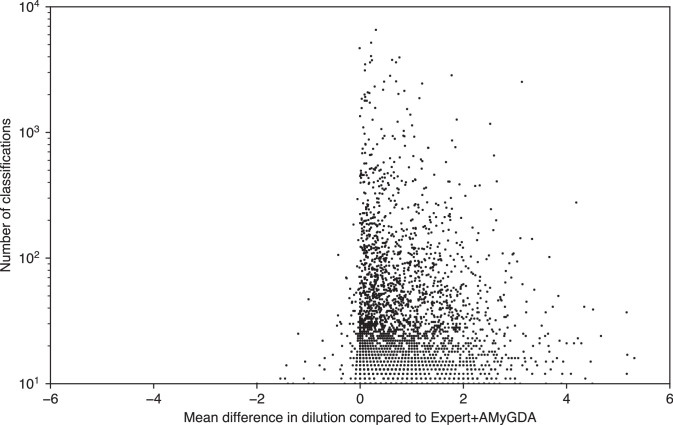
Tuberculosis is a respiratory disease that is treatable with antibiotics. An increasing prevalence of resistance means that to ensure a good treatment outcome it is desirable to test the susceptibility of each infection to different antibiotics. Conventionally, this is done by culturing a clinical sample and then exposing aliquots to a panel of antibiotics, each being present at a pre-determined concentration, thereby determining if the sample isresistant or susceptible to each sample. The minimum inhibitory concentration (MIC) of a drug is the lowestconcentration that inhibits growth and is a more useful quantity but requires each sample to be tested at a range ofconcentrations for each drug. Using 96-well broth micro dilution plates with each well containing a lyophilised pre-determined amount of an antibiotic is a convenient and cost-effective way to measure the MICs of several drugs at once for a clinical sample. Although accurate, this is still an expensive and slow process that requires highly-skilled and experienced laboratory scientists. Here we show that, through the BashTheBug project hosted on the Zooniverse citizen science platform, a crowd of volunteers can reproducibly and accurately determine the MICs for 13 drugs and that simply taking the median or mode of 11-17 independent classifications is sufficient. There is therefore a potential role for crowds to support (but not supplant) the role of experts in antibiotic susceptibility testing.

Keywords: M. tuberculosis; antibiotics; citizen science; clinical microbiology; infectious disease; microbiology; tuberculosis.

Plain language summary

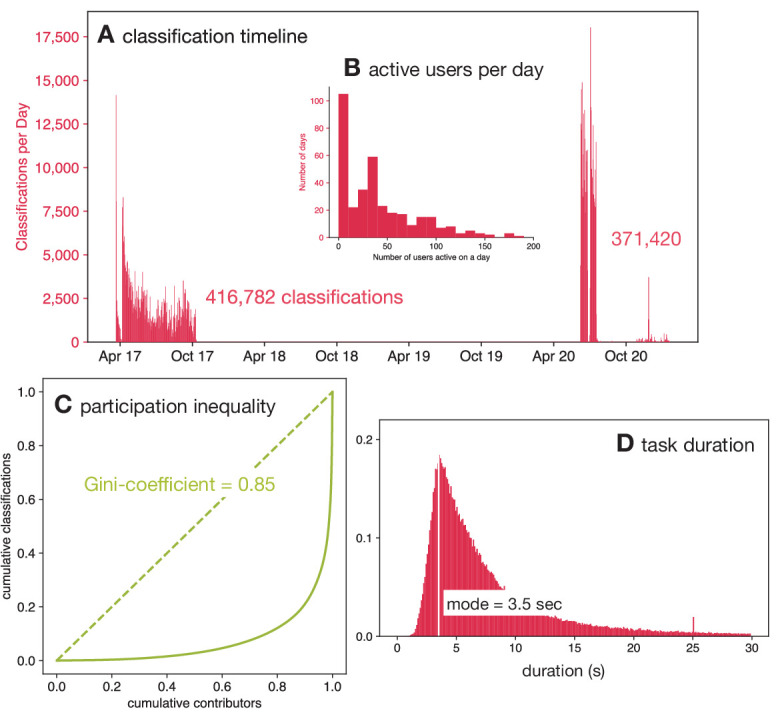
Tuberculosis is a bacterial respiratory infection that kills about 1.4 million people worldwide each year. While antibiotics can cure the condition, the bacterium responsible for this disease, Mycobacterium tuberculosis, is developing resistance to these treatments. Choosing which antibiotics to use to treat the infection more carefully may help to combat the growing threat of drug-resistant bacteria. One way to find the best choice is to test how an antibiotic affects the growth of M. tuberculosis in the laboratory. To speed up this process, laboratories test multiple drugs simultaneously. They do this by growing bacteria on plates with 96 wells and injecting individual antibiotics in to each well at different concentrations. The Comprehensive Resistance Prediction for Tuberculosis (CRyPTIC) consortium has used this approach to collect and analyse bacteria from over 20,000 tuberculosis patients. An image of the 96-well plate is then captured and the level of bacterial growth in each well is assessed by laboratory scientists. But this work is difficult, time-consuming, and subjective, even for tuberculosis experts. Here, Fowler et al. show that enlisting citizen scientists may help speed up this process and reduce errors that arise from analysing such a large dataset. In April 2017, Fowler et al. launched the project ‘BashTheBug’ on the Zooniverse citizen science platform where anyone can access and analyse the images from the CRyPTIC consortium. They found that a crowd of inexperienced volunteers were able to consistently and accurately measure the concentration of antibiotics necessary to inhibit the growth of M. tuberculosis. If the concentration is above a pre-defined threshold, the bacteria are considered to be resistant to the treatment. A consensus result could be reached by calculating the median value of the classifications provided by as few as 17 different BashTheBug participants. The work of BashTheBug volunteers has reduced errors in the CRyPTIC project data, which has been used for several other studies. For instance, the World Health Organization (WHO) has also used the data to create a catalogue of genetic mutations associated with antibiotics resistance in M. tuberculosis. Enlisting citizen scientists has accelerated research on tuberculosis and may help with other pressing public health concerns.


Conflict of interest statement

PF, CW, HS, TZ, EB, SH, AG, AR, SK, TW, TP, GM, CL, DC, DC, AW No competing interests declared

Figures

Figure 1.
Figure 1.. This dataset of 778,202 classifications was collected in two batches between April 2017 and Sep 2020 by 9372 volunteers.
(A) The classifications were done by the volunteers in two distinct batches; one during 2017 and a later one in 2020. Note that the higher participation during 2020 was due to the national restrictions imposed due to the SARS-Cov-2 pandemic. (B) The number of active users per day varied from zero to over 150. (C) The Lorenz curve demonstrates that there is considerable participation inequality in the project resulting in a Gini-coefficient of 0.85. (D) Volunteers spent different lengths of time classifying drug images after 14 days of incubation with a mode duration of 3.5 s.
Figure 1—figure supplement 1.
Figure 1—figure supplement 1.. Thank you to all the volunteers who contributed one or more classifications to this manuscript.
There are the 5810 usernames of all the volunteers in this montage – volunteers who did not register or sign in are not included.
Figure 1—figure supplement 2.
Figure 1—figure supplement 2.. The time spent by volunteers on each classification varied with a mode of 3.5 s.
Since one would expect different amounts of bacterial growth on the microdilution plates after (A) 7, (B) 10, (C) 14 and (D) 21 days the distributions of these were examined separately. All were, however, similar indicating that this did not have a significant effect.
Figure 1—figure supplement 3.
Figure 1—figure supplement 3.. The time spent by volunteers on each classification varied depending on the drug being considered.
The mode of each distribution is labelled. The drug the volunteers spent the longest on (bedaquiline, mode 4.8 s) was also one of those with the largest number (8) of wells. As measured by its mode of 3.2 s, the volunteers spent the least time classifying delamanid.
Figure 1—figure supplement 4.
Figure 1—figure supplement 4.. Every new user is shown this tutorial when they first join the BashTheBug Zooniverse project.
It uses example images to explain the task and then each of the options that they can choose to classify a drug image.
Figure 2.
Figure 2.. Heatmap showing how all the individual BashTheBug classifications (n=214,164) compare to the dilution measured by the laboratory scientist using the Thermo Fisher Vizion instrument after 14 days incubation (n=12,488).
(A) The probability that a single volunteer exactly agrees with the Expert +AMyGDA dataset varies with the dilution. (B) The distribution of all dilutions in the Expert +AMyGDA dataset after 14 days incubation. The differences are due to different drugs having different numbers of wells as well as the varying levels of resistance in the supplied strains. NR includes both plates that could not be read due to issues with the control wells and problems with individual drugs such as skip wells. (C) The distribution of all dilutions measured by the BashTheBug volunteers. (D) A heatmap showing the concordance between the Expert +AMyGDA dataset and the classifications made by individual BashTheBug volunteers. Only cells with gt0.1% are labelled. (E) Two example drug images where both the Expert and AMyGDA assessed the MIC as being a dilution of 5 whilst a single volunteer decided no growth could be seen in the image. (F) Two example drug images where both the laboratory scientist and a volunteer agreed that the MIC was a dilution of 5. (G) Two example drug images where the laboratory scientist decided there was no growth in any of the wells, whilst a single volunteer decided there was growth in the first four wells.
Figure 2—figure supplement 1.
Figure 2—figure supplement 1.. Heatmap showing how all the individual BashTheBug classifications (n=214,164) compare to the set of dilutions where the measurement made by the laboratory scientist using the Thermo Fisher Vizion instrument and a mirrored box after 14 days incubation concur (n=9402) (A).
The probability that a single volunteer exactly agrees with the Expert dataset varies with the dilution. The distribution of all MIC dilutions after 14 days incubation read by (B) laboratory scientists and (C) BashTheBug volunteers. NR includes both plates that could not be read due to issues with the control wells and problems with individual drugs such as skip wells. (D) A heatmap showing how for each set of images assessed by the laboratory scientist has having a specific dilution as the MIC, the classifications made by BashTheBug volunteers varied considerably. It is normalised so that each row sums to 100% and only cells with >0.1 % are labelled.
Figure 3.
Figure 3.. Taking the mean of 17 classifications is ≥95% reproducible whilst applying either the median or mode is ≥90% accurate.
(A) Only calculating the mean of 17 classifications achieves an essential agreement ≥95% for reproducibility International Standards Organization, 2007, followed by the median and the mode. (B) Heatmaps of the consensus formed via the mean, median or mode after 14 days incubation. Only drug images from the Expert + AMyGDA dataset are included. (C) The essential agreement between a consensus dilution formed from 17 classifications using the median or mode and the consensus Expert +AMyGDA dilution both exceed the required 90% threshold International Standards Organization, 2007. (D) The heatmaps clearly show how the volunteer consensus dilution is likely to be the same or greater than the Expert + AMyGDA consensus.
Figure 3—figure supplement 1.
Figure 3—figure supplement 1.. Taking the mean of 17 classifications is ≥95% reproducible whilst none of the methods reach have an essential agreement for accuracy of ≥90% when using the Expert dataset.
(A) Only calculating the mean of 17 classifications achieves an essential agreement ≥95% for reproducibility International Standards Organization, 2007, followed by the median and then the mode. There is no specified threshold for exact agreement; the trend is reversed with the mode performing best, followed by the median and then the mean. (B) Heatmaps of the consensus formed via the mean, median, or mode after 14 days incubation. Each consensus dilution is a different selection, with replacement, of the original classifications. Drug images from the larger Expert dataset are included. (C) The essential agreement between a consensus dilution formed from 17 classifications using the median or mode and the consensus Expert dilution is ≥ 90%, which is the required threshold International Standards Organization, 2007. (D) The heatmaps clearly show how the volunteer consensus dilution is likely to be the same or greater than the Expert consensus.
Figure 4.
Figure 4.. Reducing the number of classifications, n, used to build the consensus dilution decreases the reproducibility and accuracy of the consensus measurement.
(A) The consensus dilution becomes less reproducible as the number of classifications is reduced, as measured by both the exact and essential agreements. (B) Likewise, the consensus dilution becomes less accurate as the number of classifications is decreased, however the highest level of exact agreement using the mean is obtained when n=3 and the mode, and to a lesser extent the median, are relatively insensitive to the number of classifications. These data are all with respect to the Expert +AMyGDA dataset.
Figure 4—figure supplement 1.
Figure 4—figure supplement 1.. Reducing the number of classifications, n, used to build the consensus dilution decreases the reproducibility and accuracy of the consensus measurement.
(A) The consensus dilution becomes less reproducible as the number of classifications is reduced, as measured by both the exact and essential agreements. (B) Likewise, the consensus dilution becomes less accurate as the number of classifications is decreased, however the highest level of exact agreement using the mean is obtained when n=3 and the mode, and to a lesser extent the median, are relatively insensitive to the number of classifications. These data are all with respect to the Expert dataset.
Figure 4—figure supplement 2.
Figure 4—figure supplement 2.. Altering the number of days incubation does not markedly affect the observed trends in reproducibility.
Shown are results for the Expert +AMyGDA dataset after (A) 7, (B) 10, (C) 14 and (D) 21 days of incubation. A previous study (Rancoita et al., 2018) showed that optimal results were achieved after 14 days incubation.
Figure 4—figure supplement 3.
Figure 4—figure supplement 3.. Altering the number of days incubation does not markedly affect the observed trends in accuracy.
Shown are results for the Expert +AMyGDA dataset after (A) 7, (B) 10, (C) 14 and (D) 21 days of incubation. A previous study (Rancoita et al., 2018) showed that optimal results were achieved after 14 days incubation.
Figure 4—figure supplement 4.
Figure 4—figure supplement 4.. Segmenting the drug images by the mean amount of growth in the positive control wells (Figure 6—figure supplement 3) does not markedly affect the reproducibility of the three consensus methods.
The plates are split into those with (A) low (≤ 10 %) growth, (B) medium (10 < growth ≤) growth and (C) high (> 50 %) growth. The drug images from the Expert +AMyGDA dataset were used and the proportion with MIC is the proportion of consensus readings that are a definite numerical minimum inhibitory concentration.
Figure 4—figure supplement 5.
Figure 4—figure supplement 5.. Segmenting the drug images by the mean amount of growth in the positive control wells (Figure 6—figure supplement 3) does not markedly affect the accuracy of the three consensus methods.
The plates are split into those with (A) low (≤ 10% %) growth, (B) medium (10 < growth ≤ 50 %) growth and (C) high (> 50 %) growth. The drug images from the Expert +AMyGDA dataset were used and the proportion with MIC is the proportion of consensus readings that are a definite numerical minimum inhibitory concentration.
Figure 5.
Figure 5.. The reproducibility and accuracy of the consensus MICs varies by drug.
Consensus MICs were arrived at by taking the median of 17 classifications after 14 days incubation. The essential and exact agreements are drawn as red and green bars, respectively. For the former the minimum thresholds required are 95% and 90% for the reproducibility and accuracy, respectively (International Standards Organization, 2007). See (Figure 5—figure supplement 1) for the other consensus methods.
Figure 5—figure supplement 1.
Figure 5—figure supplement 1.. The reproducibility and accuracy after 14 days incubation of the 13 antibiotics on the UKMYC5 plate.
A total of 17 classifications were used for each measurement and either the mean or mode was used to obtain a consensus reading of the (A) reproducibility and (B) accuracy. The essential agreement is drawn in red and the required thresholds are 95% and 90% for the reproducibility and accuracy, respectively (International Standards Organization, 2007). The exact agreement is drawn in green and no threshold is defined. The drug abbreviations are defined in (Figure 6—figure supplement 1). The dataset used was Expert +AMyGDA.
Figure 6.
Figure 6.. Each UKMYC5 plate was read by an Expert, by some software (AMyGDA) and by at least 17 citizen scientist volunteers via the BashTheBug project.
(A) 447 UKMYC5 plates were prepared and read after 7, 10, 14 and 21 days incubation. (B) The minimum inhibitory concentrations (MIC) for the 14 drugs on each plate were read by an by Expert, using a Vizion instrument. The Vizion also took a photograph which was subsequently analysed by AMyGDA – this software then composited 14 drug images from each photograph, each containing an image of the two positive control wells. To allow data from different drugs to be aggregated, all MICs were converted to dilutions. (C) All drug images were then uploaded to the Zooniverse platform before being shown to volunteers through their web browser. Images were retired once they had been classified by 17 different volunteers. Classification data were downloaded and processed using two Python modules (pyniverse +bashthebug) before consensus measurements being built using different methods.
Figure 6—figure supplement 1.
Figure 6—figure supplement 1.. The UKMYC5 plate contains 14 different anti-TB drugs.
A previous study (Rancoita et al., 2018) showed that para-aminosalicylic acid (PAS) performed poorly and it has been removed from the subsequent UKMYC6 plate design. We have therefore excluded this drug from all analyses. Each drug was contained in 5, 6, 7, or 8 wells with each well having double the concentration of drug as the one before. The concentration of the first and last well in each drug series is labelled (mg/L). Two wells contain no drug and are therefore positive control wells.
Figure 6—figure supplement 2.
Figure 6—figure supplement 2.. Although the retirement limit within the Zooniverse platform was set to 17, over 1800 images received more classifications than this and a small number were only classified 15 or 16 times.
Figure 6—figure supplement 3.
Figure 6—figure supplement 3.. The Expert +AMyGDA consensus dataset has the same distribution of bacterial growth in the positive control wells as the Expert dataset after 14 days incubation.
(A) The distribution of the mean positive control well growth, as measured by AMyGDA, for the Expert +AMyGDA dataset. The dataset is arbitrarily split into three categories: low (<10%), medium (10 ≤ growth < 50 %) and high (≥ 50 %) growth. The proportions of the dataset in each category are labelled. (B) The distribution of the mean positive control well growth, as measured by AMyGDA, for the Expert dataset. There are around twice as many plates in this dataset (Supplementary file 1c).
Figure 6—figure supplement 4.
Figure 6—figure supplement 4.. The Expert +AMyGDA dataset has a greater proportion of drug images with low dilutions compared to the Expert dataset.
The growth of the bacteria is also evident as the number of days the sample was incubated for is increased.
Figure 6—figure supplement 5.
Figure 6—figure supplement 5.. The average bias per volunteer decreases with experience.
The average bias per volunteer, as defined by the difference between a volunteer’s reading and that from the Expert +AMyGDA dataset, is plotted against the total number of classifications done by each volunteer. Only volunteers who have done 10 or more classifications are plotted.

References

    1. Cox J, Oh EY, Simmons B, Lintott C, Masters K, Greenhill A, Graham G, Holmes K. Defining and Measuring Success in Online Citizen Science: A Case Study of Zooniverse Projects. Computing in Science & Engineering. 2015;17:28–41. doi: 10.1109/MCSE.2015.65. - DOI
    1. CRyPTIC Consortium Epidemiological cutoff values for a 96-well broth microdilution plate for high-throughput research antibiotic susceptibility testing of M. tuberculosis. The European Respiratory Journal. 2022;1949:2200239. doi: 10.1183/13993003.00239-2022. - DOI - PMC - PubMed
    1. Fowler PW. Help us fight antibiotic resistance. 2017. [June 10, 2022]. https://bashthebug.net/bashthebug-on-the-zooniverse/
    1. Fowler PW. pyniverse: a Python package to analyse classifications made by volunteers in a generic Zooniverse citizen science project. ce066f5Github. 2018a https://github.com/fowler-lab/pyniverse
    1. Fowler PW. bashthebug: a Python package to analyse the results of the Zooniverse volunteers for the BashTheBug citizen science project. 8b22907Github. 2018b https://github.com/fowler-lab/bashthebug

Publication types

Substances