. 2022 May 19;79(6):303.
doi: 10.1007/s00018-022-04319-w.

Macrophages evoke autophagy of hepatic stellate cells to promote liver fibrosis in NAFLD mice via the PGE2/EP4 pathway

Affiliations

Macrophages evoke autophagy of hepatic stellate cells to promote liver fibrosis in NAFLD mice via the PGE2/EP4 pathway

Ying Cao et al. Cell Mol Life Sci. .

Abstract

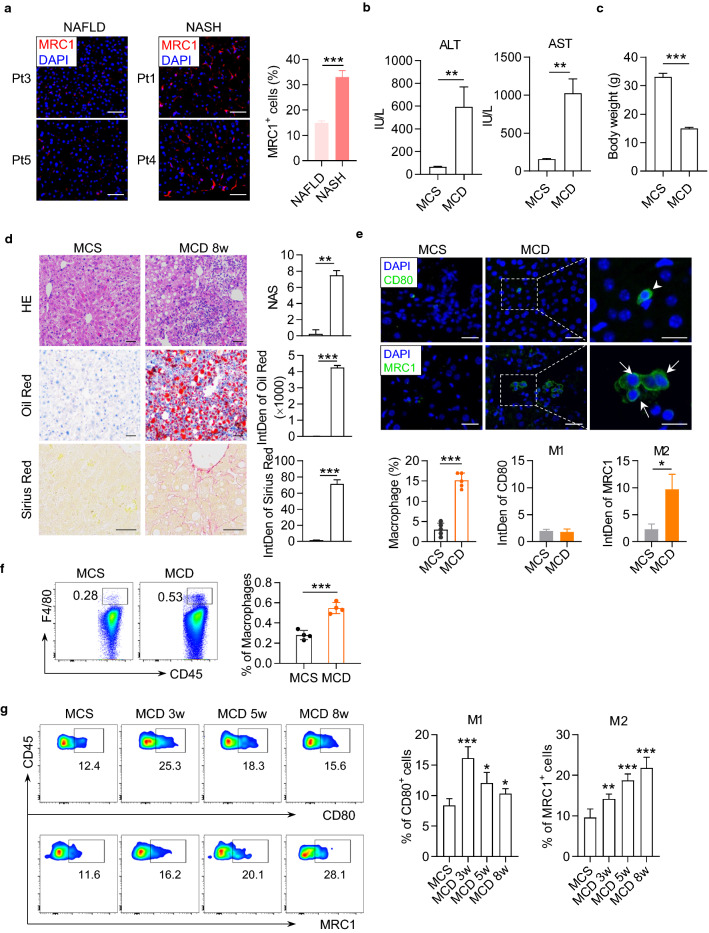
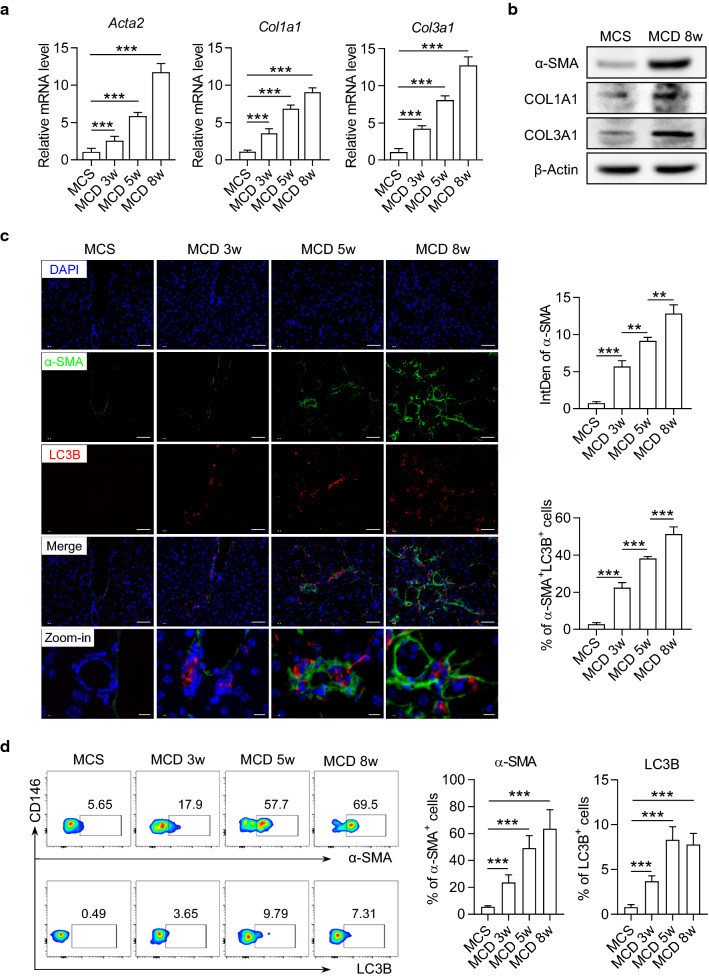
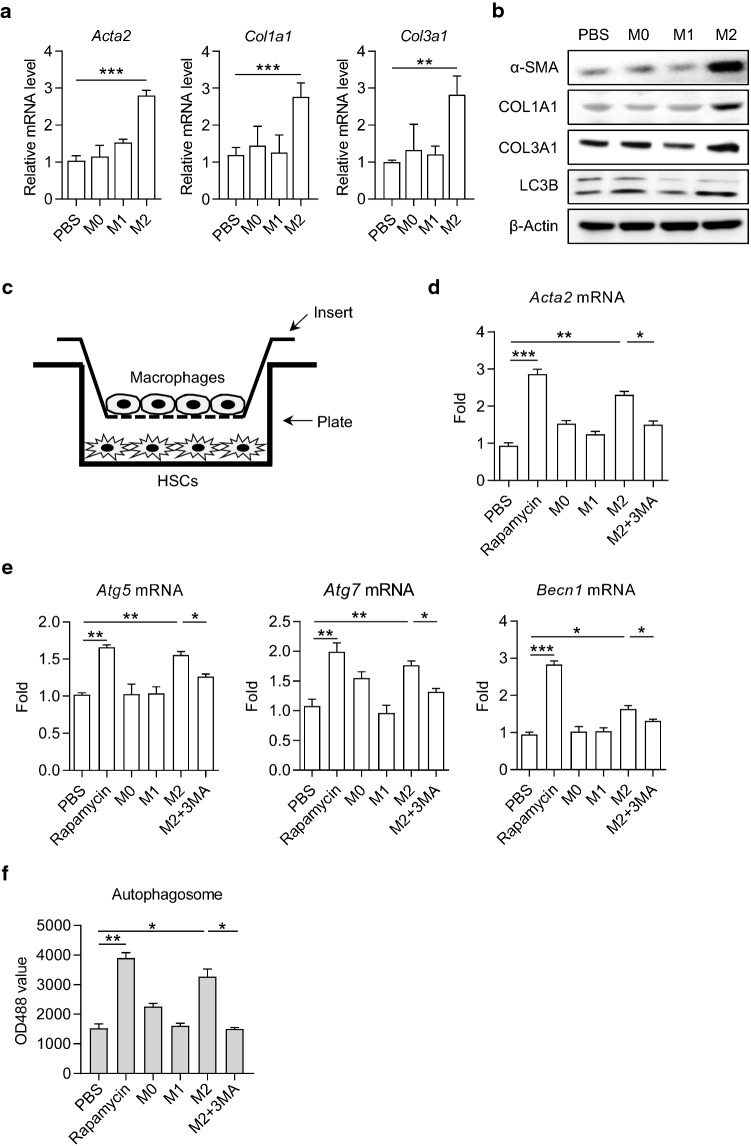
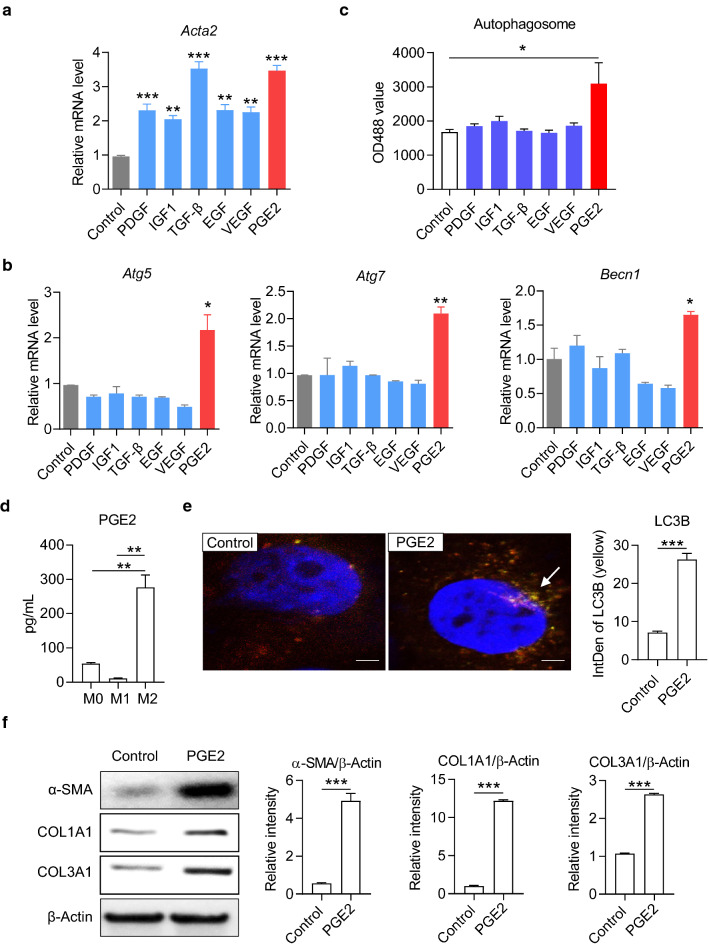
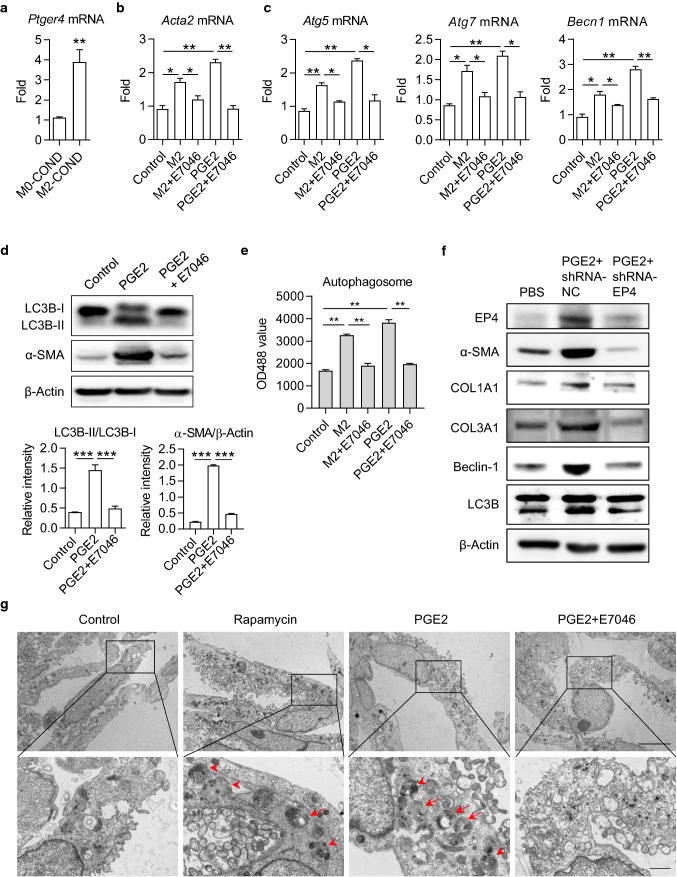
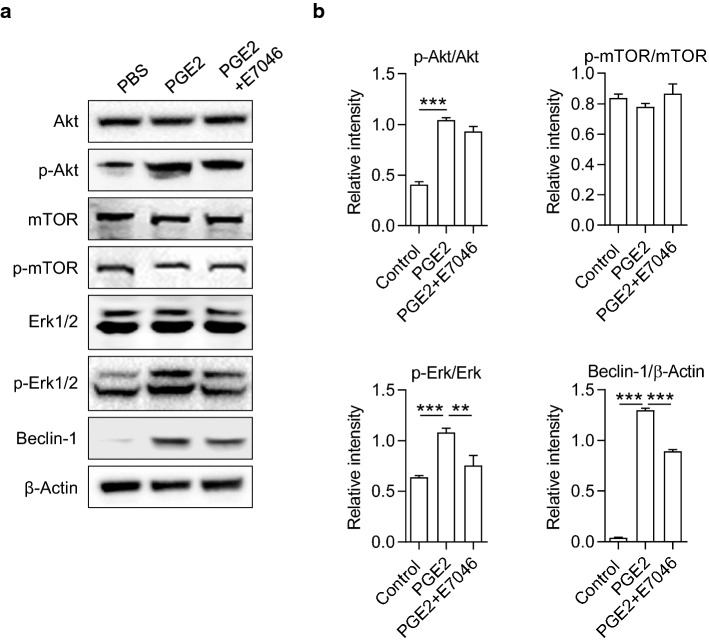
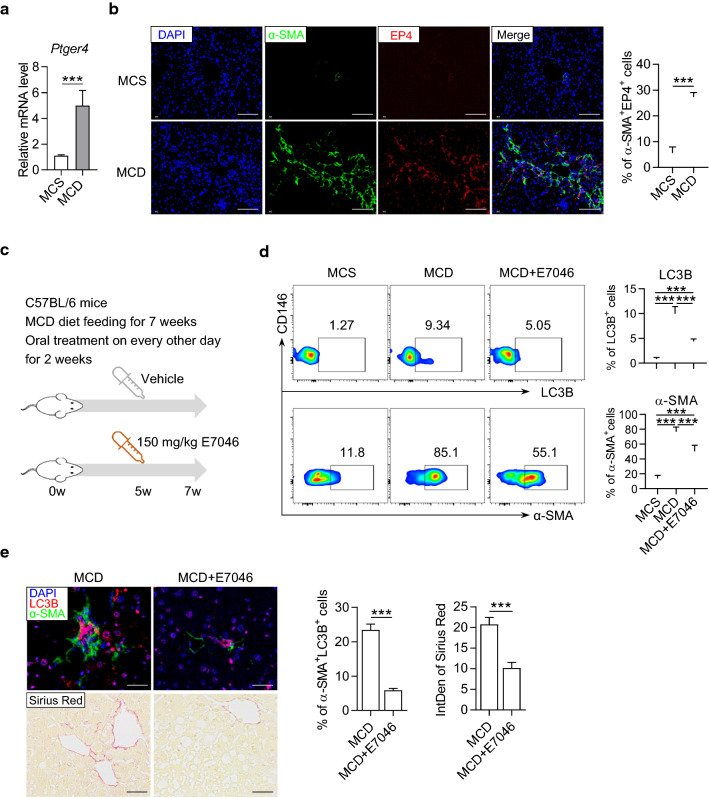
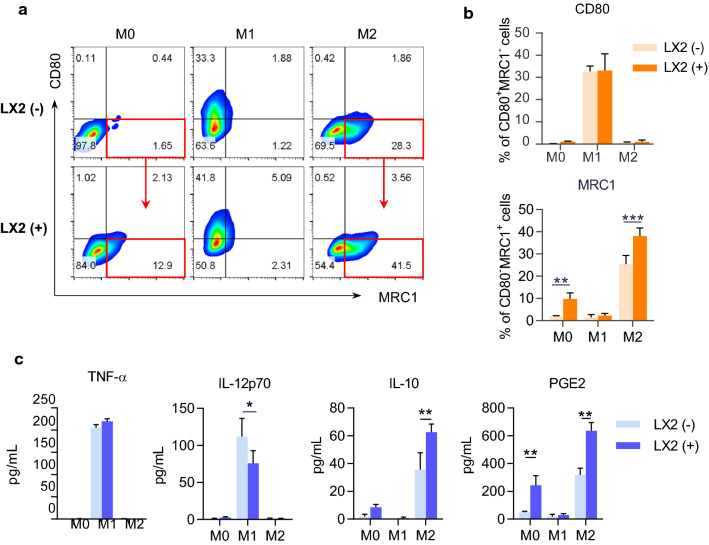
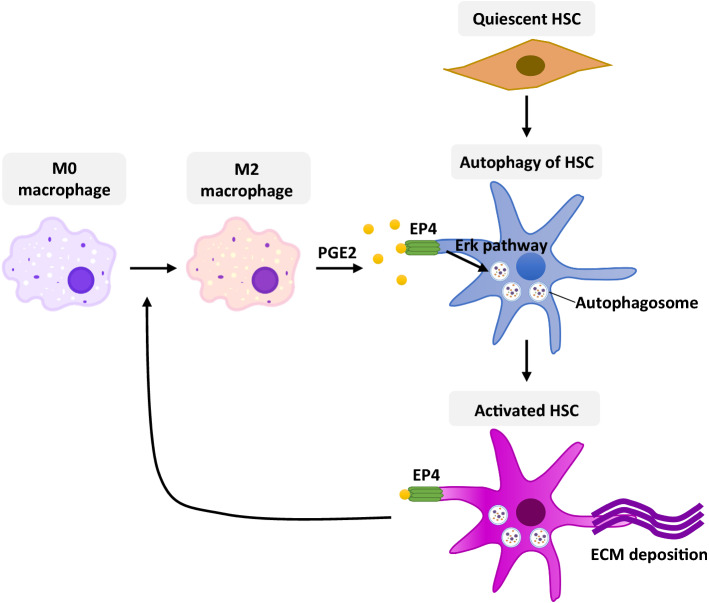
The pathogenesis of liver fibrosis in nonalcoholic fatty liver disease (NAFLD) remains unclear and the effective treatments have not been explored yet. The activation of hepatic stellate cells (HSCs) is considered as the most critical factor in the progression of liver fibrosis and cirrhosis. Autophagy has recently been identified as a new mechanism to regulate HSC activation. Here, we found that liver macrophages were polarized toward type 2 (M2) during the progression of nonalcoholic steatohepatitis (NASH) and liver fibrosis in both patients and NAFLD mice. Using the methionine-choline-deficient (MCD) diet NAFLD murine model and the in vitro cell culture system, we identified that the M2 macrophages promoted HSC autophagy by secreting prostaglandin E2 (PGE2) and binding its receptor EP4 on the surface of HSCs, which consequently enhanced HSC activation, extracellular matrix deposition, and liver fibrosis. Mechanistically, PGE2/EP4 signals enhanced HSC autophagy through the Erk pathway. A specific PGE2/EP4 antagonist E7046 significantly inhibited M2 macrophage-mediated HSC autophagy and improved liver fibrosis and histopathology in NAFLD mice. Our study provides novel mechanistic insights into the regulation of HSC activation and liver fibrosis. Our findings suggest that the PGE2/EP4 pathway is a promising therapeutic target to prevent NASH progression into cirrhosis.

Keywords: Autophagy; E7046; Erk1/2; Macrophage polarization; Type 2 macrophage.


Conflict of interest statement

The authors declare no competing of interest.

Figures

Fig. 1
Fig. 1
Liver macrophages polarized toward M2 phenotype during the progression of fibrosis in MCD-fed mice and human patients with NASH. a Immunofluorescence pictures of MRC1 (red) and DAPI (blue) staining in the liver of human patients with nonalcoholic steatosis or NASH. Integrated density of MRC1 signals in the staining pictures were quantified and compared between groups. Scale bar = 100 μm. b Serum concentrations of ALT and AST in the mice fed with MCS or MCD diet for 8 weeks. c The body weight of mice. d Representative histopathologic staining pictures of hematoxylin and eosin (HE), Oil red and Sirius red in the liver of mice. NAFLD Activity Score (NAS) was calculated according to the performance of HE staining. Integrated density of positive staining signals was quantified with ImageJ software and compared between groups. HE and Oil red staining picture, scale bar = 25 μm. Sirius red staining picture, scale bar = 100 μm. e Representative immunofluorescence pictures of CD80 (green) and DAPI (blue) staining in the upper panels, or MCR1 (green) and DAPI (blue) staining in the lower panels in the liver of mice. Mice fed with MCS or MCD diet for 8 weeks. Integrated density of positive signals in the staining pictures were quantified and compared between groups. Original photo, scale bar = 20 μm; Zoomed photo, scale bar = 100 μm. f Gating strategy for mouse liver macrophages by flow cytometry. Macrophages were gated as CD45+7aadF4/80+. g Representative dot plots displaying the expression of CD80 (upper) and MRC1 (lower) gated on CD45+F4/80+ macrophages from liver of mice. Percentage of CD80+ (M1 phenotype) and MRC1+ (M2 phenotype) cells in macrophages. Data represent mean ± standard deviation (SD) (n = 4 in each group). P-values were obtained by unpaired t test (two groups) or one-way ANOVA (multiple groups). *P < 0.05, **P < 0.01 and ***P < 0.001 compared with MCS group
Fig. 2
Fig. 2
The autophagy and activation of HSCs were enhanced in liver of mice during the progression of NASH. C57BL/6 mice were fed with MCS normal diet or MCD diet for 3, 5, and 8 weeks. a The mRNA levels of Acta2, Col1a1 and Col3a1 in the liver of mice were detected by real-time PCR assay. Data in bar graphs represent mean ± SD (n = 5 in each group). b The protein levels of α-SMA, COL1A1 and COL3A1 in the liver of mice were detected by Western blot. c Representative immunofluorescence staining pictures of α-SMA (green), LC3B (red) and DAPI (blue) in the liver of mice. Integrated density of positive signals and the percentage of positive cells in the staining pictures were quantified and compared between groups. Scale bar = 100 μm. d Representative dot plots displaying the expression of α-SMA (upper) and LC3B (lower) gated on CD45CD146UVAF+ HSCs in the liver of mice. Percentage of α-SMA+ and LC3B+ cells in HSCs from the liver of mice. Data in bar graphs represent mean ± SD (n = 5 in each group). P-values were obtained by one-way ANOVA. **P < 0.01 and ***P < 0.001 between indicated groups
Fig. 3
Fig. 3
M2 macrophages promoted HSC autophagy by the secretory pathway. a The mRNA levels of Acta2, Col1a1 and Col3a1 in LX-2 cells cultured with PBS, M0, M1 and M2 conditioned medium, respectively. Data represent mean ± SD (n = 3 in each group). b The protein levels of α-SMA, COL1A1, COL3A1 and LC3B in LX-2 cells were detected by Western blot. c Schematic diagram of transwell co-culture system. d, e The mRNA level of Acta2, Atg5, Atg7 and Becn1 in LX-2 cells were detected by real-time PCR. LX-2 cells were supplied with rapamycin, 3-MA or conditional medium as indicated for 24 h. f Autophagosome in LX-2 cells. Cells were stained with autophagy-specific dye and analyzed by microplate reader. Data represent mean ± SD (n = 4 in each group). P-values were obtained by one-way ANOVA. *P < 0.05, **P < 0.01 and ***P < 0.001 between indicated groups
Fig. 4
Fig. 4
M2 macrophages promoted activation and autophagy of HSCs by secreting PGE2. a, b The mRNA level of Acta2, Atg5, Atg7 and Becn1 in LX-2 cells were detected by real-time PCR. LX-2 cells were cultured with recombinant protein platelet derived growth factor (PDGF; 10 ng/mL), insulin-like growth factor-1 (IGF1; 100 ng/mL), transforming growth factor β (TGF-β; 10 ng/mL), epidermal growth factor (EGF; 10 ng/mL), vascular endothelial growth factor (VEGF; 10 ng/mL) and phenyl glycidyl ether 2 (PGE2; 100 ng/mL) for 48 h, respectively. c The autophagic activity in LX-2 cells. The autophagy flux was measured by the fluorescence-based autophagy assay kit. d The concentration of PGE2 in the media of macrophages was detected by ELIS(A) Macrophage polarization was induced by 40 ng/mL IFN-γ and 100 ng/mL LPS (for M1), or 40 ng/mL IL-4 and 20 ng/mL IL-13 (for M2) for 2 days. e Autophagosome in LX-2 cells was examined by laser scanning confocal microscope. Representative confocal images are shown. Integrated density of LC3B yellow fluorescence was quantified with ImageJ software and compared between groups. f The expression levels of α-SMA, COL1A1 and COL3A1 in LX-2 cells were detected by Western blot. Cells were cultured with or without 100 ng/mL PGE2 for 48 h. The levels of β-Actin were determined as internal reference. The intensity of α-SMA, COL1A1 and COL3A1 blot was quantified with ImageJ software and normalized to β-Actin. P-values were obtained by unpaired t test (two groups) or one-way ANOVA (multiple groups). *P < 0.05, **P < 0.01 and ***P < 0.001 compared with controls
Fig. 5
Fig. 5
PGE2-induced autophagy in HSCs was restrained by EP4 inhibitor E7046. a The mRNA level of EP4 coding gene Ptger4 in LX-2 cells. LX-2 cells were cultured with M0- or M2-conditional medium (COND) for 48 h and total RNA was isolated for real-time PCR assay. b, c The mRNA levels of Acta2, Atg5, Atg7 and Becn1 in LX-2 cells were detected by real-time PCR. LX-2 cells were cultured with M2-conditional medium or 100 ng/mL PGE2, in the presence or absence of 1 μM E7046 for 48 h. d The expression levels of LC3B-I, LC3B-II and α-SMA in LX-2 cells were determined by Western blot. Cells were cultured with 100 ng/mL PGE2, in the presence or absence of 1 μM E7046 for 48 h. The intensity of α-SMA blot was quantified with ImageJ software. The conversion ratio of LC3B-I to LC3B-II was calculated and the expression level of α-SMA was normalized to β-Actin. e Autophagosome in LX-2 cells. Cells were stained with autophagy-specific dye and analyzed by microplate reader. f The expression levels of EP4, α-SMA, COL1A1, COL3A1, Beclin-1, and LC3B in LX-2 cells were detected by Western blot. LX-2 cells were transfected with EP4 shRNA and stimulated with recombinant PGE2. g The bilayer autophagosomes and lysosomes were observed with transmission electron microscope. Scale bar = 5 μm (top panel). The panels on the bottom are higher-magnification images of the cropped regions. Scale bar = 1 μm (bottom panel). P-values were obtained by unpaired t test (two groups) or one-way ANOVA (multiple groups). *P < 0.05, **P < 0.01 and ***P < 0.001 compared with controls
Fig. 6
Fig. 6
PGE2 activated Erk 1/2 /Beclin-1 pathway was inhibited by E7046. The expression levels of Akt, phosphorylated-Akt (p-Akt), mTOR, p-mTOR, Erk1/2, p-Erk1/2 and Beclin-1 in LX-2 cells were determined by Western blot. Cells were cultured with 100 ng/mL PGE2, in the presence or absence of 1 μM E7046 for 48 h. The intensity of blots was quantified with ImageJ software. The protein and phosphorylation levels were normalized by relative intensity. P-values were obtained by one-way ANOVA. **P < 0.01 and ***P < 0.001 compared with controls
Fig. 7
Fig. 7
The autophagy of HSCs and liver fibrosis was improved by in vivo blockade of EP4 with E7046. a The expression of EP4 coding gene Ptger4 in the liver of MCD mice. The mice were fed with MCD diet for 8 weeks and the liver homogenate was subjected to real-time PCR assay. b Representative immunofluorescence staining pictures of α-SMA (green), EP4 (red) and DAPI (blue) in the liver of mice feeding with MCS or MCD diet for 8 w. Integrated density of positive signals and the percentage of α-SMA+EP4+ cells in the staining pictures were quantified and compared between groups. Scale bar = 100 μm. c Schematic diagram of E7046 treatment to MCD mice. d Representative dot plots displaying the expression of LC3B (upper) and α-SMA (lower) gated on CD45CD146UVAF+ HSCs in the liver of mice. Percentage of LC3B+ and α-SMA+ cells were calculated and compared between groups. Data in bar graphs represent mean ± SD (n = 5 in each group). e The upper pictures are representative immunofluorescence staining of α-SMA (green), LC3B (red) and DAPI (blue) in the liver of mice. Scale bar = 100 μm. The lower pictures are representative Sirius red staining in the liver of mice. Scale bar = 200 μm. The percentage of α-SMA+LC3B+ cells and the integrated density of Sirius red in the staining pictures were quantified and compared between groups. P-values were obtained by unpaired t test (two groups) or one-way ANOVA (multiple groups). ***P < 0.001 between indicated groups
Fig. 8
Fig. 8
LX-2 cells promoted M2 macrophage polarization and PGE2 secretion. BMDMs were cultured in the presence or absence of LX-2 cells for 48 h. BMDMs and the cell culture supernatant were collected to identify cell polarization phenotypes. a Representative flow cytometry plots displaying the expression of CD80 (M1 marker) and MRC1 (M2 marker) gated on F4/80+ BMDMs. b Percentage of CD80+MRC1 (M1) and CD80MRC1+ (M2) subsets in BMDMs. c The cytokine concentrations in the culture media of BMDMs. Data represent mean ± SD (n = 4 in each group). P-values were obtained by Student t test or Mann–Whitney test. *P < 0.05, **P < 0.01 and ***P < 0.001 between indicated groups
Fig. 9
Fig. 9
A schematic diagram of the regulatory mechanism between M2 macrophage polarization and HSC activation in liver

Similar articles

Cited by

References

    1. Eslam M, Sanyal AJ, George J. MAFLD: a consensus-driven proposed nomenclature for metabolic associated fatty liver disease. Gastroenterology. 2020;158:1999–2014e1991. doi: 10.1053/j.gastro.2019.11.312. - DOI - PubMed
    1. Matteoni CA, Younossi ZM, Gramlich T, et al. Nonalcoholic fatty liver disease: a spectrum of clinical and pathological severity. Gastroenterology. 1999;116:1413–1419. doi: 10.1016/s0016-5085(99)70506-8. - DOI - PubMed
    1. Huang DQ, El-Serag HB, Loomba R. Global epidemiology of NAFLD-related HCC: trends, predictions, risk factors and prevention. Nat Rev Gastroenterol Hepatol. 2021;18:223–238. doi: 10.1038/s41575-020-00381-6. - DOI - PMC - PubMed
    1. Sheka AC, Adeyi O, Thompson J, et al. Nonalcoholic steatohepatitis: a review. JAMA. 2020;323:1175–1183. doi: 10.1001/jama.2020.2298. - DOI - PubMed
    1. Rockey DC, Bell PD, Hill JA. Fibrosis—a common pathway to organ injury and failure. N Engl J Med. 2015;372:1138–1149. doi: 10.1056/NEJMra1300575. - DOI - PubMed