

Surveillance for Violent Deaths - National Violent Death Reporting System, 42 States, the District of Columbia, and Puerto Rico, 2019
- PMID: 35588398
- PMCID: PMC9129903
- DOI: 10.15585/mmwr.ss7106a1
Surveillance for Violent Deaths - National Violent Death Reporting System, 42 States, the District of Columbia, and Puerto Rico, 2019
Abstract
Problem/condition: In 2019, approximately 67,000 persons died of violence-related injuries in the United States. This report summarizes data from CDC's National Violent Death Reporting System (NVDRS) on violent deaths that occurred in 42 states, the District of Columbia, and Puerto Rico in 2019. Results are reported by sex, age group, race and ethnicity, method of injury, type of location where the injury occurred, circumstances of injury, and other selected characteristics.
Period covered: 2019.
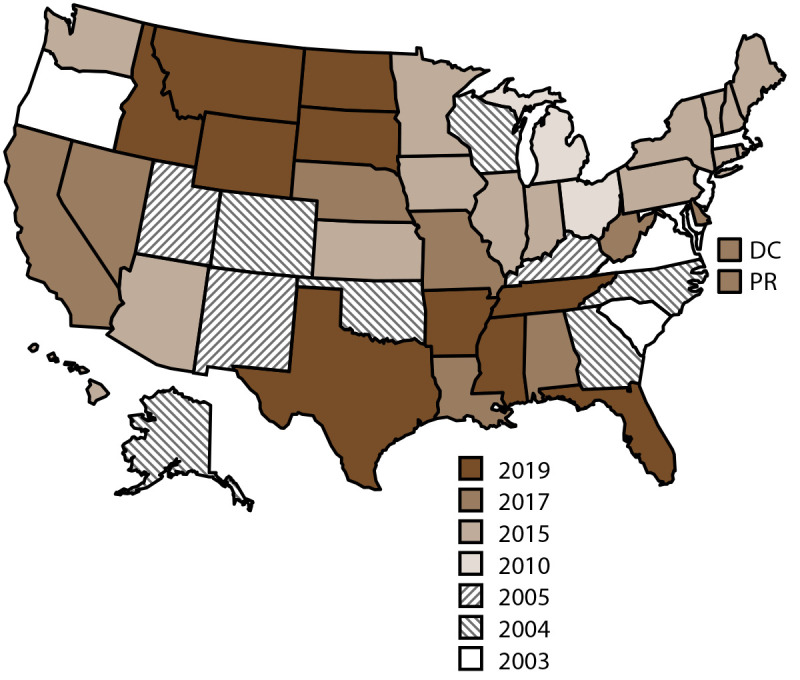
Description of system: NVDRS collects data regarding violent deaths obtained from death certificates, coroner and medical examiner records, and law enforcement reports. This report includes data collected for violent deaths that occurred in 2019. Data were collected from 39 states with statewide data (Alabama, Alaska, Arizona, Colorado, Connecticut, Delaware, Georgia, Hawaii, Indiana, Iowa, Kansas, Kentucky, Louisiana, Maine, Maryland, Massachusetts, Michigan, Minnesota, Missouri, Montana, Nebraska, Nevada, New Hampshire, New Jersey, New Mexico, North Carolina, North Dakota, Ohio, Oklahoma, Oregon, Rhode Island, South Carolina, Utah, Vermont, Virginia, Washington, West Virginia, Wisconsin, and Wyoming), three states with data from counties representing a subset of their population (30 California counties, representing 57% of its population, and 47 Illinois counties and 40 Pennsylvania counties, representing at least 80% of their populations), the District of Columbia, and Puerto Rico. NVDRS collates information for each violent death and links deaths that are related (e.g., multiple homicides, homicide followed by suicide, or multiple suicides) into a single incident.
Results: For 2019, NVDRS collected information on 50,374 fatal incidents involving 51,627 deaths that occurred in 42 states (39 states collecting statewide data, 30 California counties, 47 Illinois counties, and 40 Pennsylvania counties), and the District of Columbia. In addition, information was collected for 831 fatal incidents involving 897 deaths in Puerto Rico. Data for Puerto Rico were analyzed separately. Of the 51,627 deaths, the majority (64.1%) were suicides, followed by homicides (25.1%), deaths of undetermined intent (8.7%), legal intervention deaths (1.4%) (i.e., deaths caused by law enforcement and other persons with legal authority to use deadly force acting in the line of duty, excluding legal executions), and unintentional firearm deaths (<1.0%). The term "legal intervention" is a classification incorporated into the International Classification of Diseases, Tenth Revision, and does not denote the lawfulness or legality of the circumstances surrounding a death caused by law enforcement. Demographic patterns and circumstances varied by manner of death. The suicide rate was higher for males than for females. Across all age groups, the suicide rate was highest among adults aged 45-54 years. In addition, non-Hispanic American Indian or Alaska Native (AI/AN) and non-Hispanic White (White) persons had the highest suicide rates among all racial and ethnic groups. Among males, the most common method of injury for suicide was a firearm, whereas poisoning was the most common method of injury among females. Among all suicide victims, suicide was most often preceded by a mental health, intimate partner, or physical health problem or by a recent or impending crisis during the previous or upcoming 2 weeks. The homicide rate was higher for males than for females. Among all homicide victims, the homicide rate was highest among persons aged 20-24 years compared with other age groups. Non-Hispanic Black (Black) males experienced the highest homicide rate of any racial or ethnic group. Among all homicide victims, the most common method of injury was a firearm. When the relationship between a homicide victim and a suspect was known, the suspect was most frequently an acquaintance or friend for male victims and a current or former intimate partner for female victims. Homicide most often was precipitated by an argument or conflict, occurred in conjunction with another crime, or, for female victims, was related to intimate partner violence. Nearly all victims of legal intervention deaths were male, and the legal intervention death rate was highest among men aged 25-29 years. The legal intervention death rate was highest among AI/AN males, followed by Black males. A firearm was used in the majority of legal intervention deaths. When a specific type of crime was known to have precipitated a legal intervention death, the type of crime was most frequently assault or homicide. The three most frequent circumstances reported for legal intervention deaths were as follows: the victim's death was precipitated by another crime, the victim used a weapon in the incident, and the victim had a mental health or substance use problem (other than alcohol use). Unintentional firearm deaths were most frequently experienced by males, White persons, and persons aged 15-24 years. These deaths most frequently occurred while the shooter was playing with a firearm and were precipitated by a person unintentionally pulling the trigger or mistakenly thinking the firearm was unloaded. The rate of deaths of undetermined intent was highest among males, particularly among Black and AI/AN males, and among adults aged 30-44 years. Poisoning was the most common method of injury in deaths of undetermined intent, and opioids were detected in nearly 80% of decedents tested for those substances.
Interpretation: This report provides a detailed summary of data from NVDRS on violent deaths that occurred in 2019. The suicide rate was highest among AI/AN and White males, whereas the homicide rate was highest among Black males. Mental health problems, intimate partner problems, interpersonal conflicts, and acute life stressors were primary circumstances for multiple types of violent death.
Public health action: Violence is preventable, and data can guide public health action. NVDRS data are used to monitor the occurrence of violence-related fatal injuries and assist public health authorities in developing, implementing, and evaluating programs, policies, and practices to reduce and prevent violent deaths. For example, the New Hampshire Violent Death Reporting System (VDRS), Indiana VDRS, and Colorado VDRS have used their VDRS data to guide suicide prevention efforts and generate reports highlighting where additional focus is needed. In New Hampshire, VDRS data have been used to monitor the increase in suicide rates during 2014-2018 and guide statewide collaborative prevention efforts. Indiana VDRS used local data to demonstrate differences in suicide and other related mental health problems among Black persons and highlight a need for improved suicide awareness and culturally competent mental health care. The Colorado VDRS conducted geospatial and demographic analysis, considering local VDRS data with existing suicide prevention efforts and resources, to identify regions with high suicide rates regions and populations at high risk for suicide. Similarly, states participating in NVDRS have used their VDRS data to examine related to homicide in their state. In North Carolina for example, where homicide rates among AI/AN and Black persons were approximately 2.5 times higher than the statewide homicide rate, the North Carolina VDRS program aims to partner with historically Black colleges and universities in the state to train researchers to use VDRS data to address health equity issues in and around their immediate community.
Conflict of interest statement
All authors have completed and submitted the International Committee of Medical Journal Editors form for disclosure of potential conflicts of interest. No potential conflicts of interest were disclosed.
Figures
References
-
- CDC. Web-based Injury Statistics Query and Reporting System (WISQARS), Atlanta, GA: US Department of Health and Human Services, CDC, National Center for Injury Prevention and Control; 2020. https://www.cdc.gov/injury/wisqars/index.html
-
- Bonnie RJ, Fulco CE, Livermore CT, eds. Reducing the burden of injury: advancing prevention and treatment. Washington, DC: National Academies Press; 1999. https://nap.nationalacademies.org/read/6321/chapter/1 - PubMed
-
- World Health Organization. International classification of diseases, tenth revision. Geneva, Switzerland: World Health Organization; 2007. https://www.who.int/classifications/classification-of-diseases
Publication types
MeSH terms
LinkOut - more resources
Full Text Sources
Medical
Research Materials