. 2022 Jun 20;32(12):2632-2639.e2.
doi: 10.1016/j.cub.2022.04.085. Epub 2022 May 18.

Mixing genome annotation methods in a comparative analysis inflates the apparent number of lineage-specific genes

Affiliations

Mixing genome annotation methods in a comparative analysis inflates the apparent number of lineage-specific genes

Caroline M Weisman et al. Curr Biol. .

Abstract

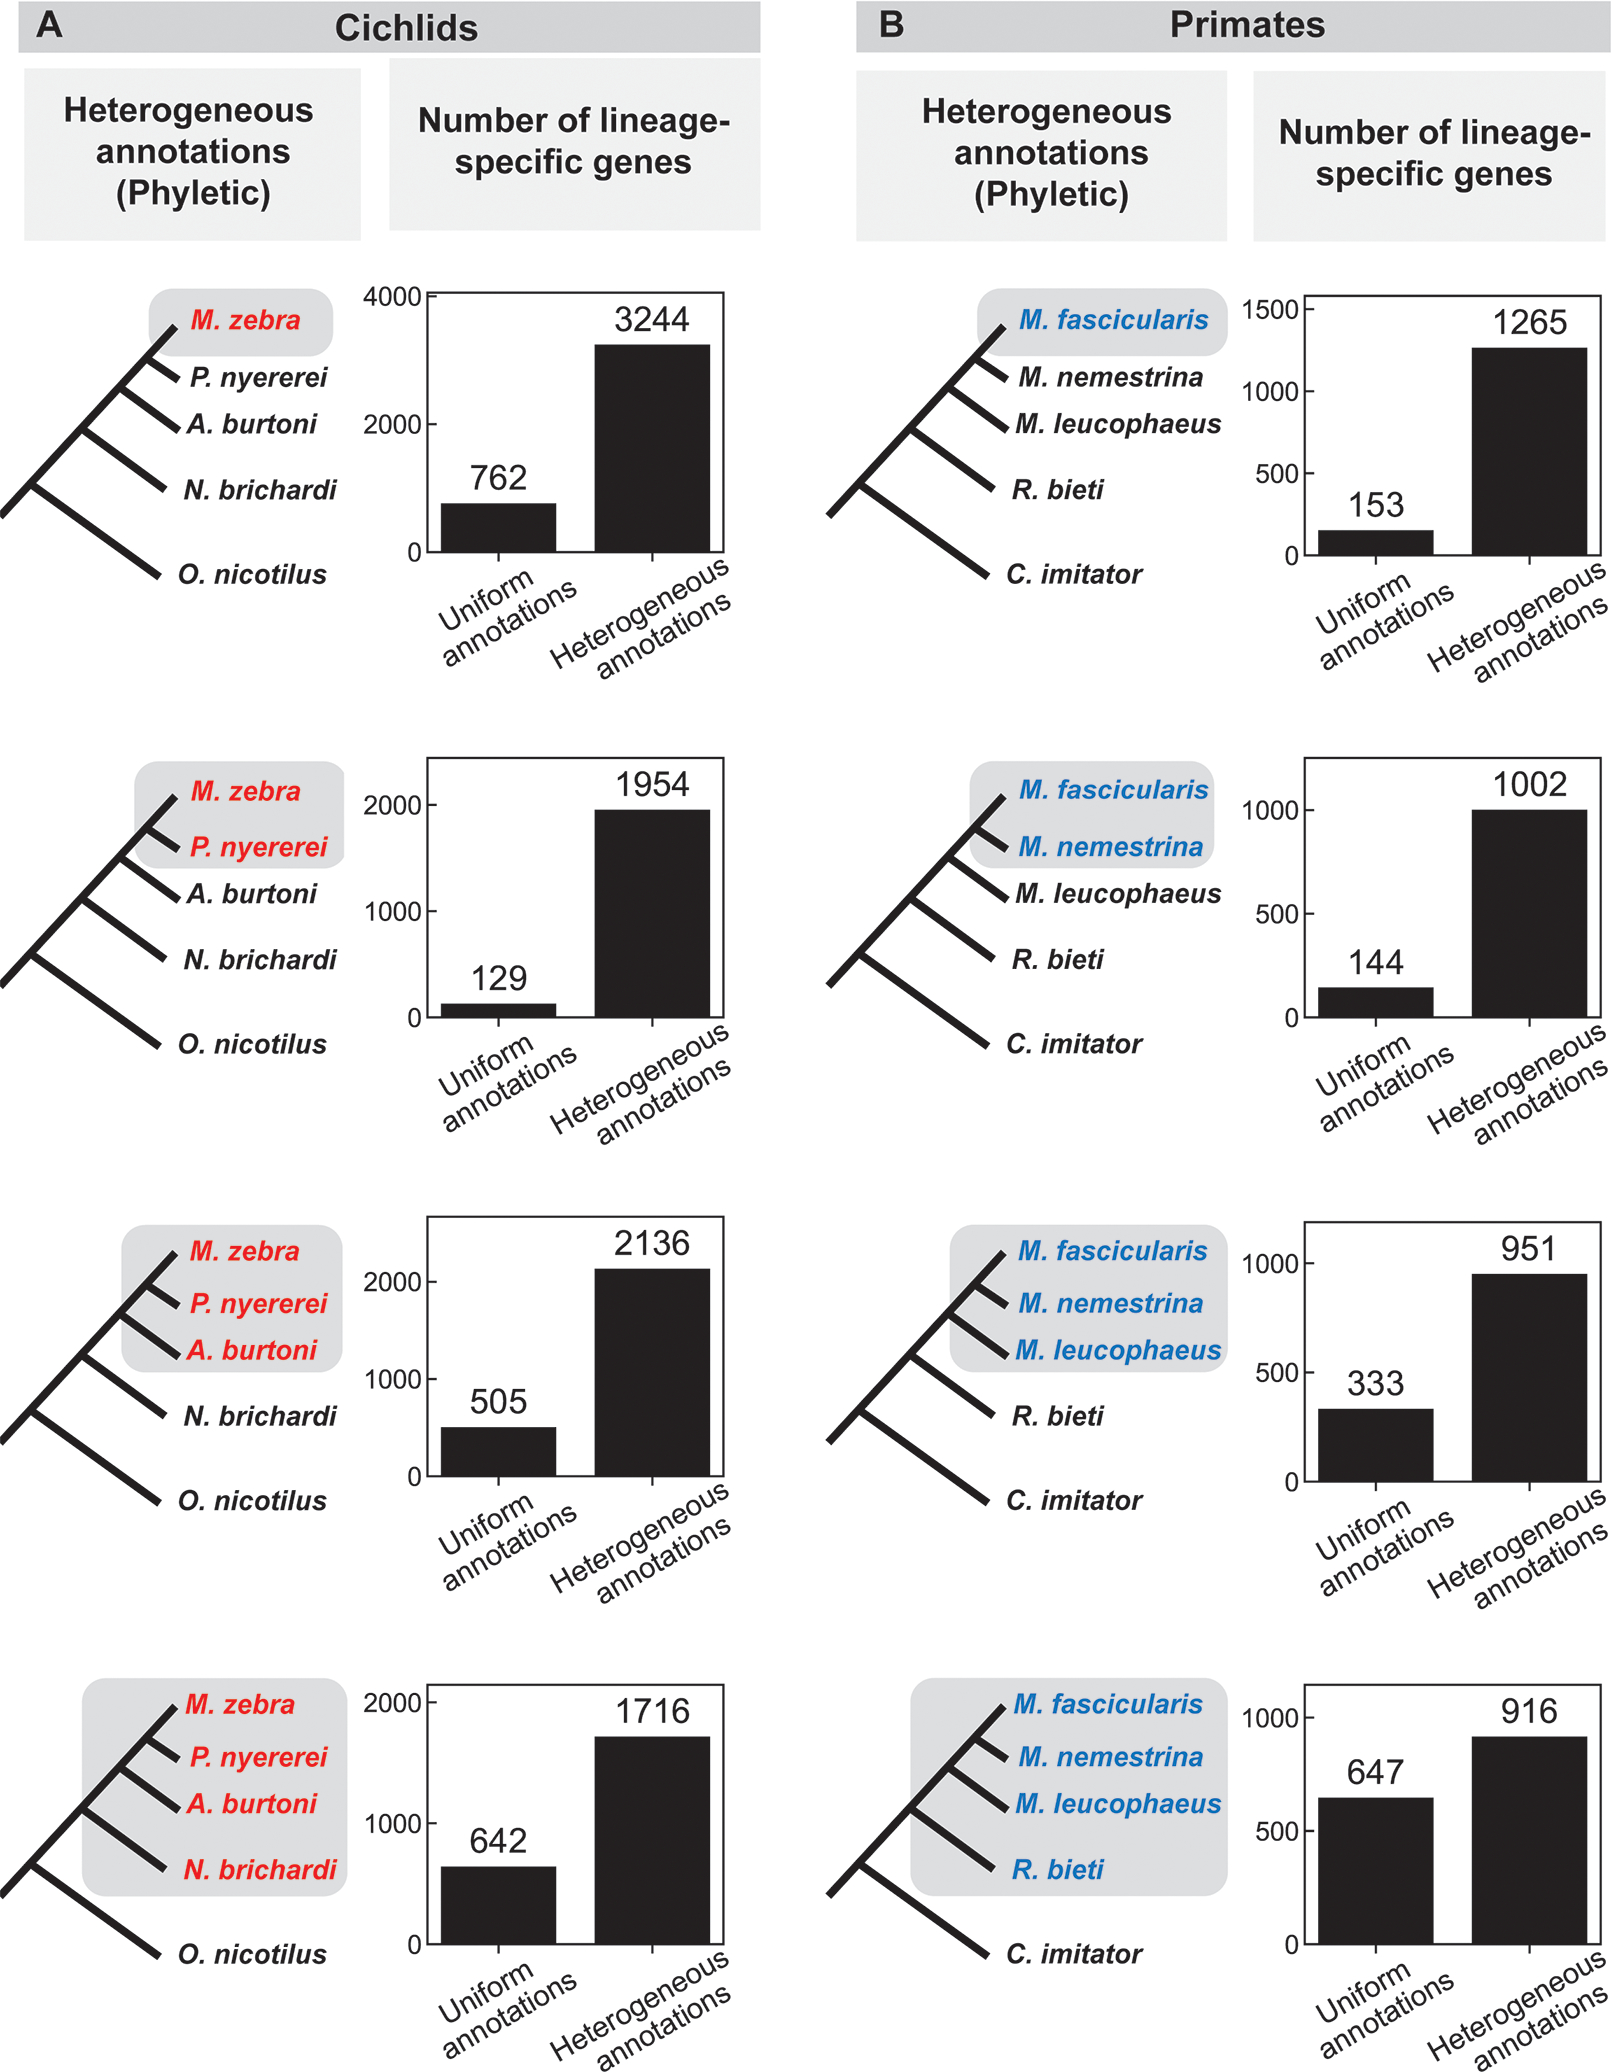
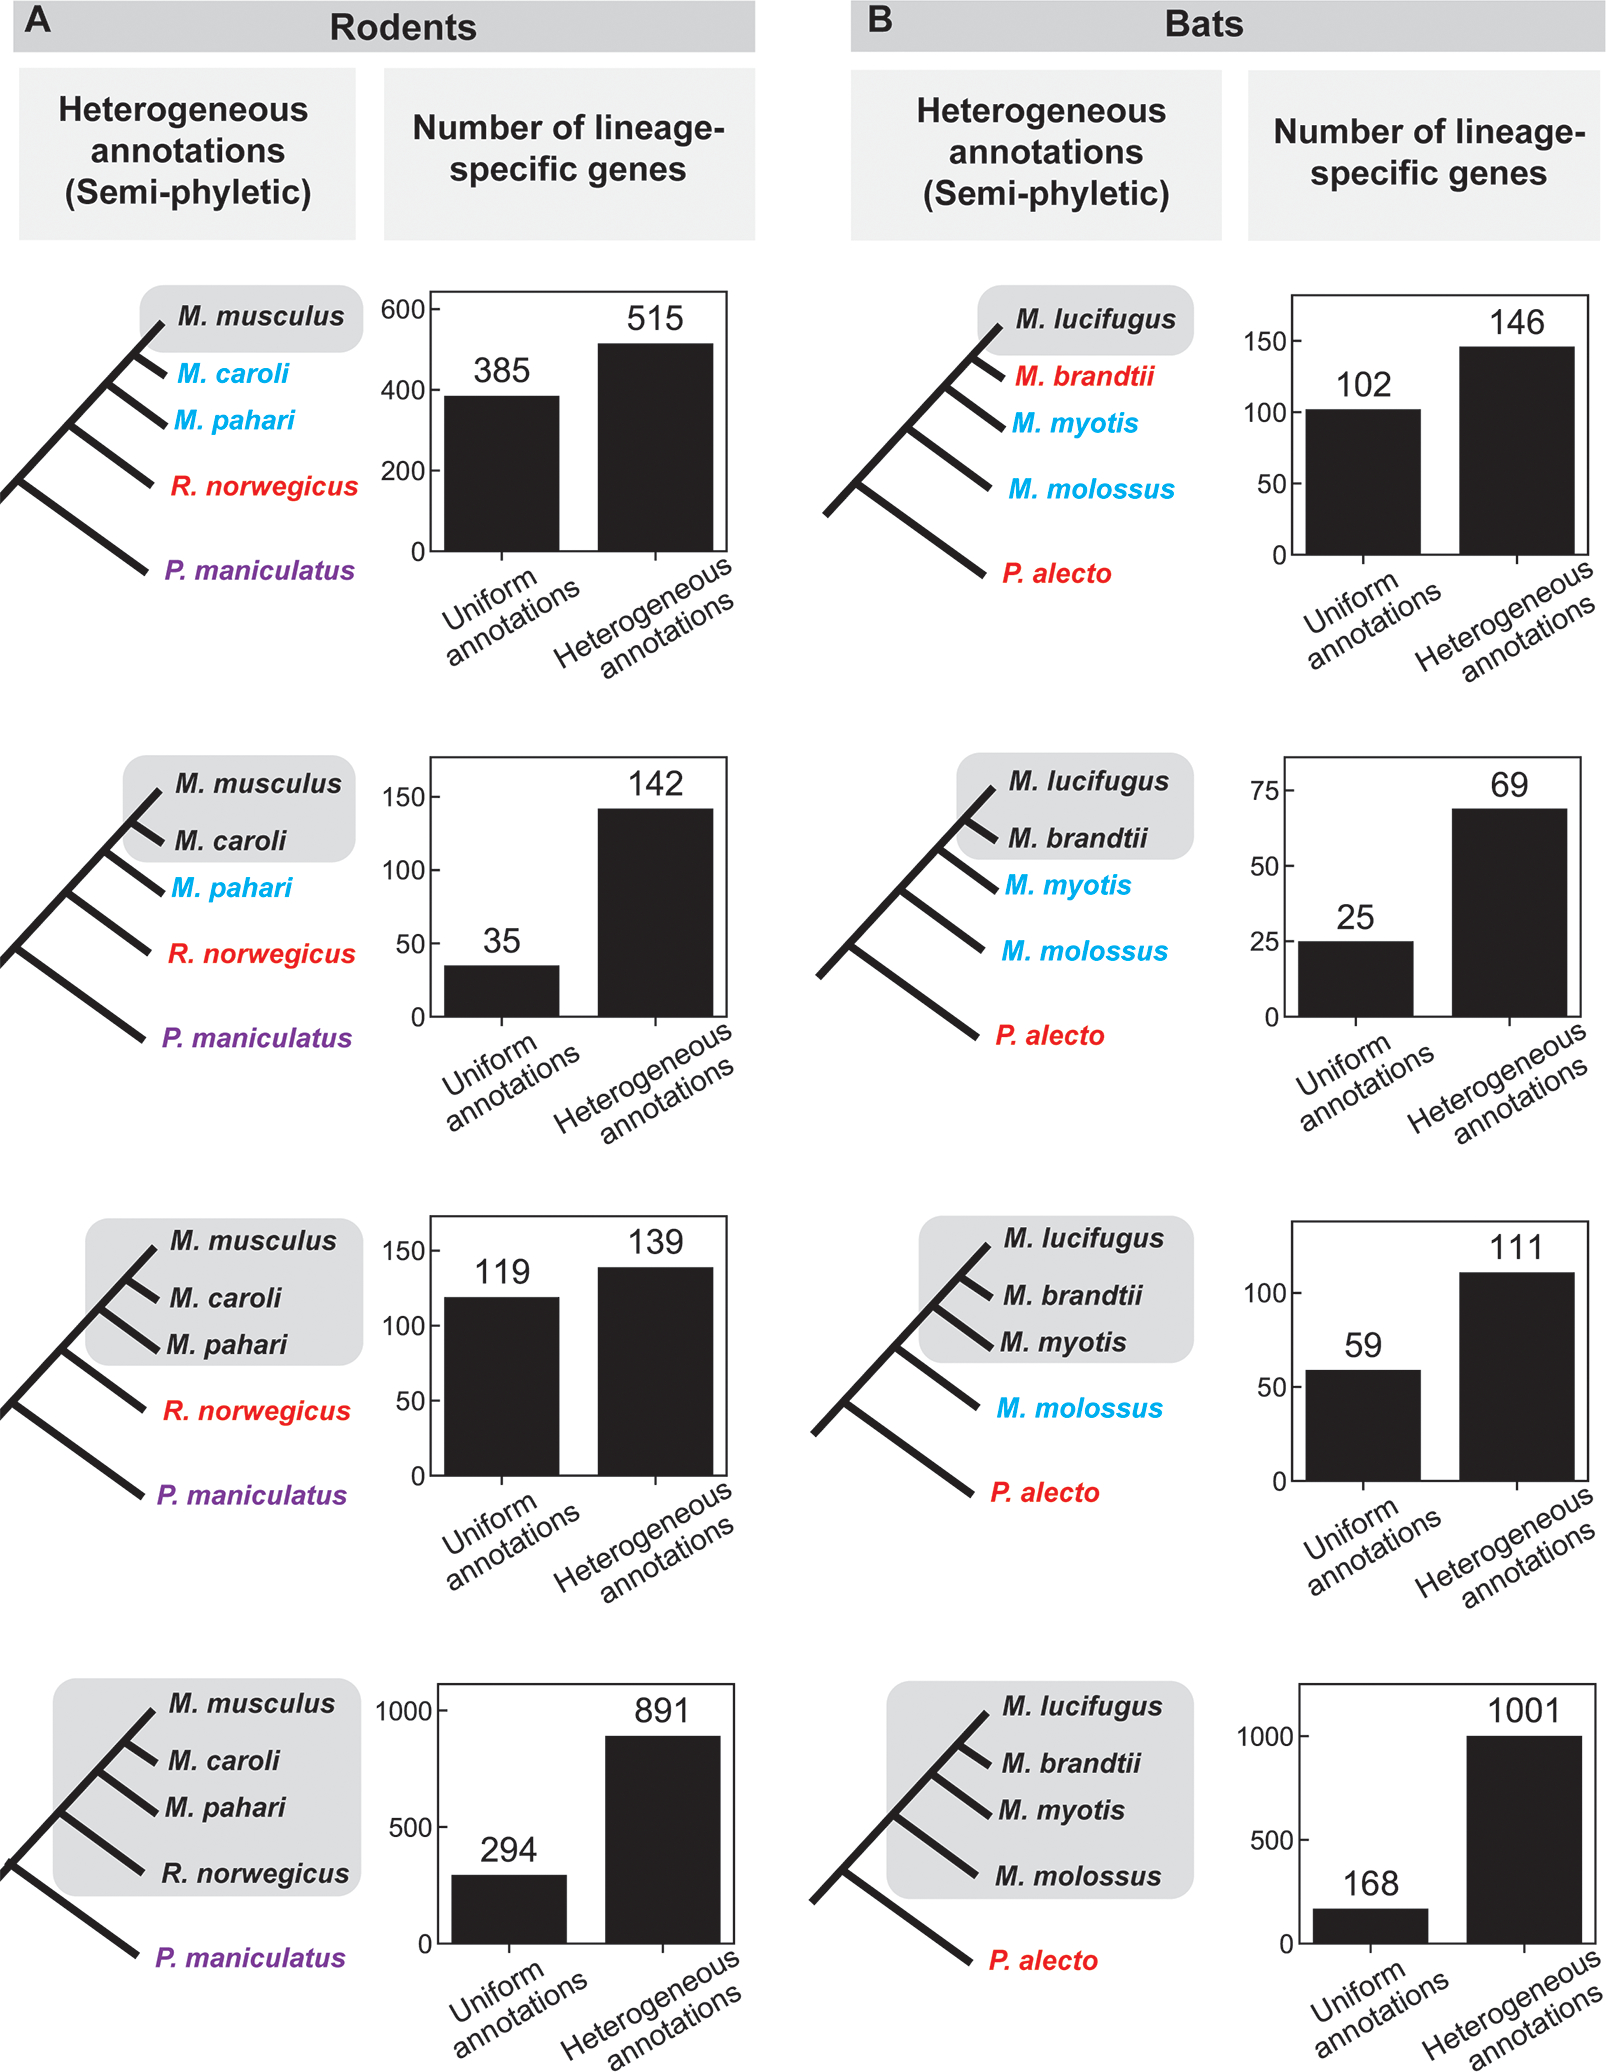
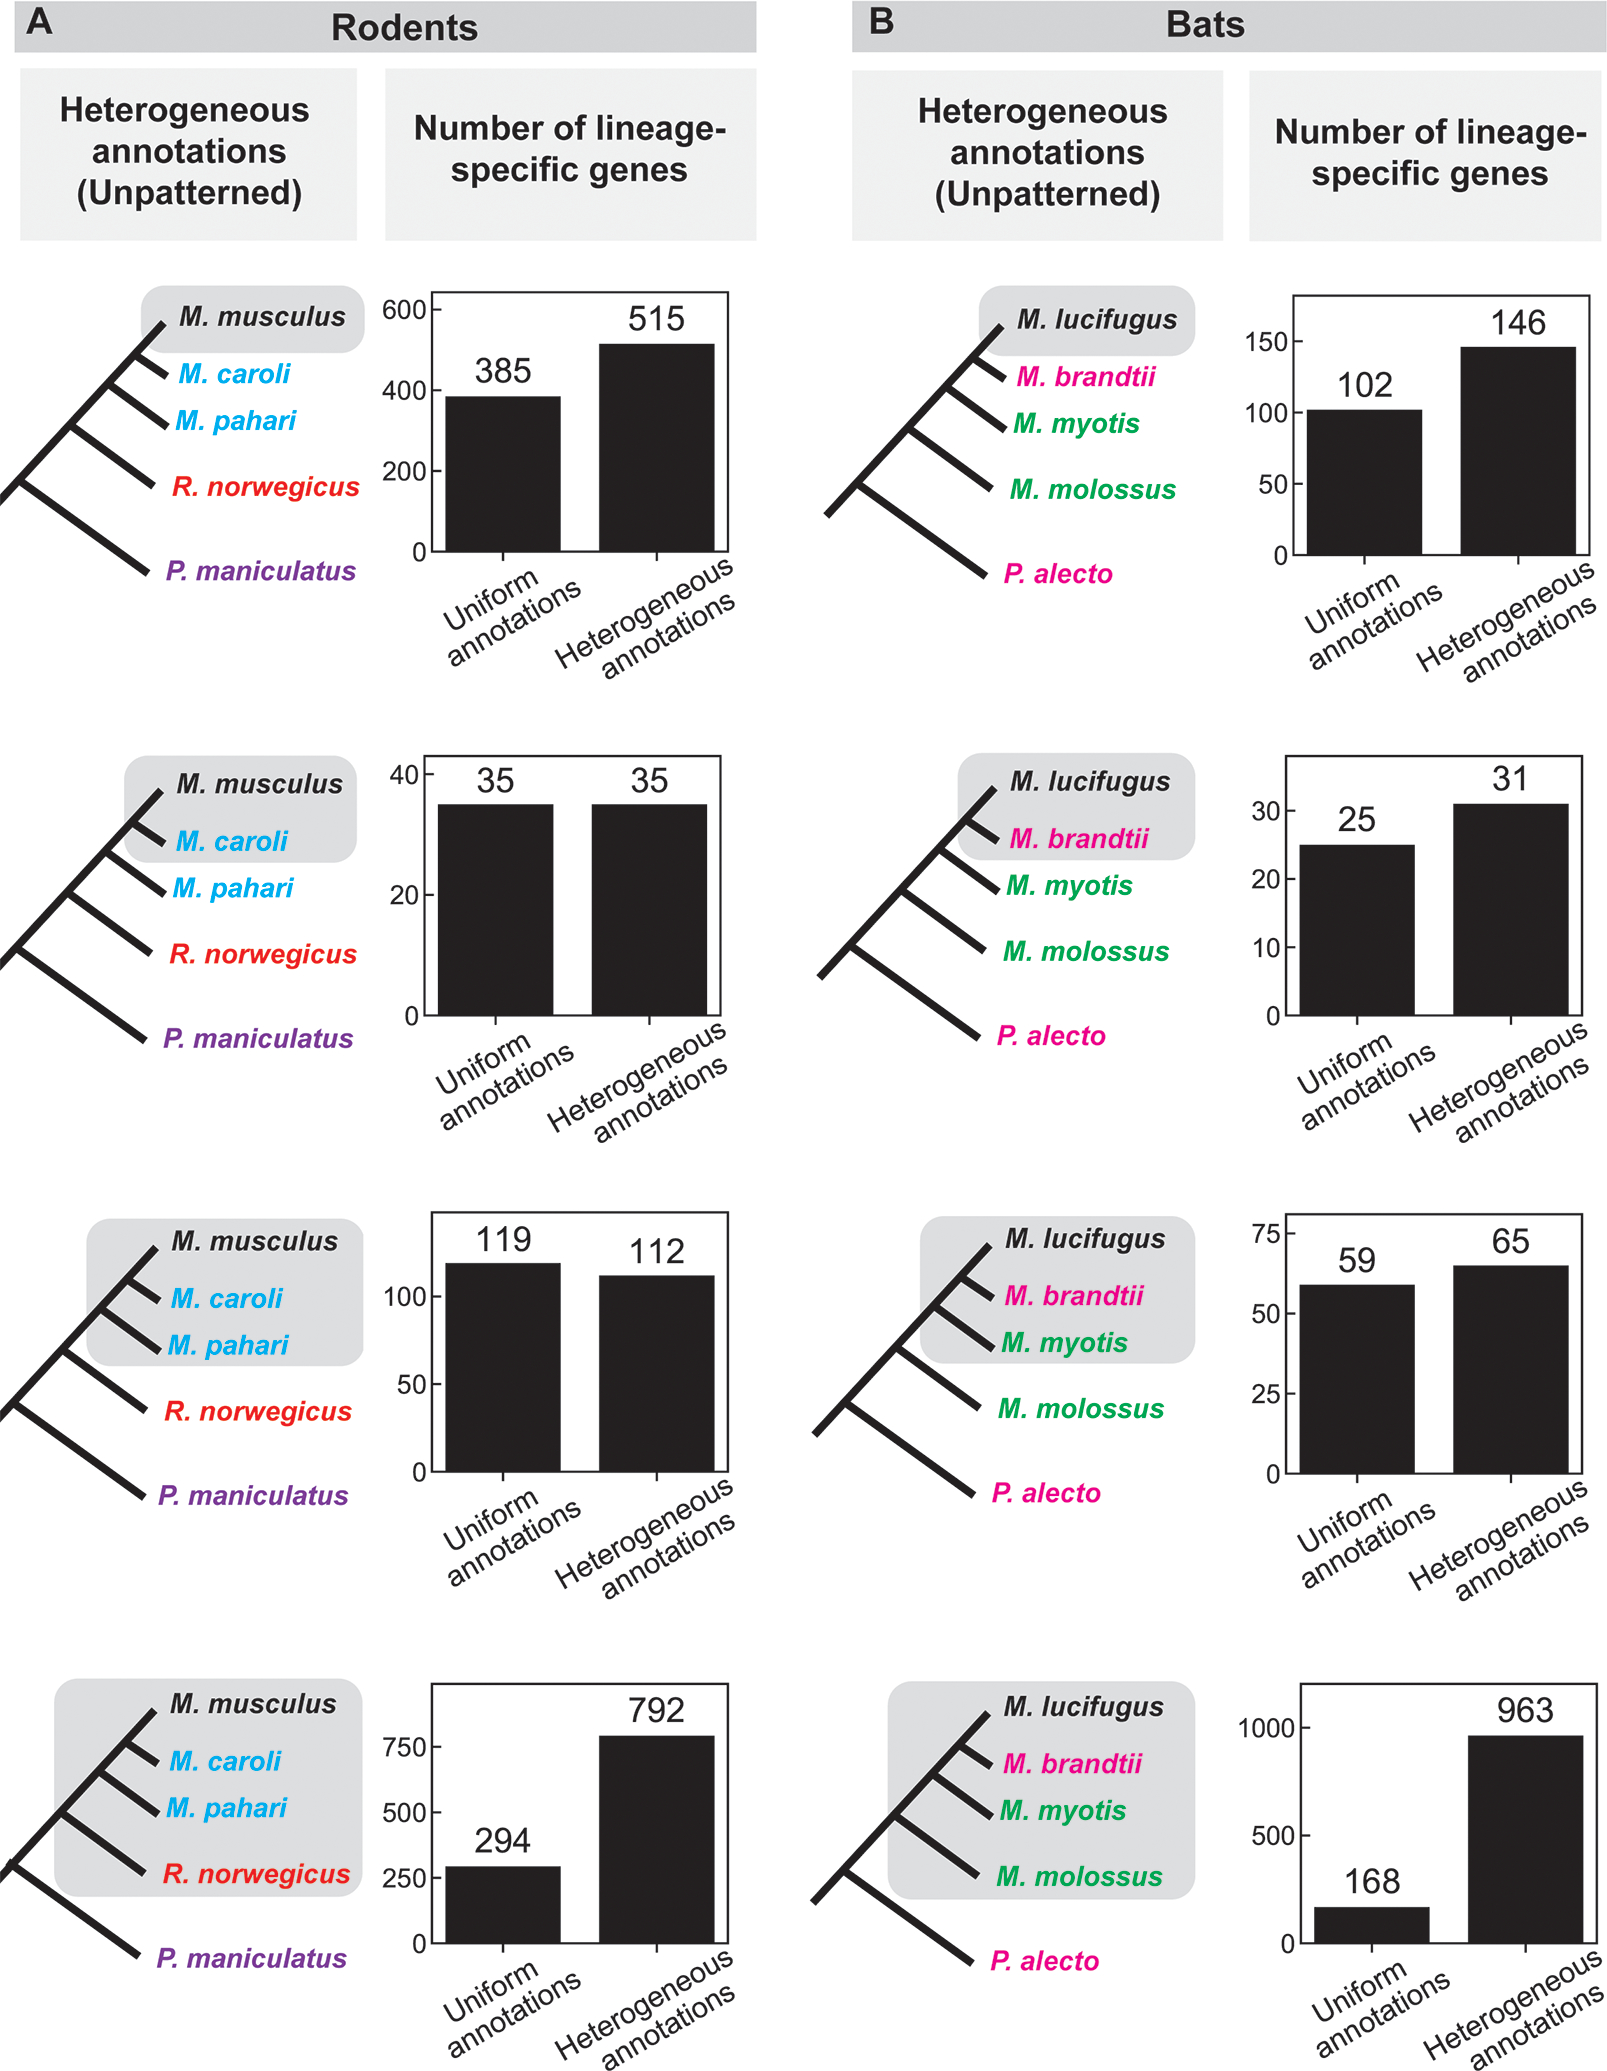
Comparisons of genomes of different species are used to identify lineage-specific genes, those genes that appear unique to one species or clade. Lineage-specific genes are often thought to represent genetic novelty that underlies unique adaptations. Identification of these genes depends not only on genome sequences, but also on inferred gene annotations. Comparative analyses typically use available genomes that have been annotated using different methods, increasing the risk that orthologous DNA sequences may be erroneously annotated as a gene in one species but not another, appearing lineage specific as a result. To evaluate the impact of such "annotation heterogeneity," we identified four clades of species with sequenced genomes with more than one publicly available gene annotation, allowing us to compare the number of lineage-specific genes inferred when differing annotation methods are used to those resulting when annotation method is uniform across the clade. In these case studies, annotation heterogeneity increases the apparent number of lineage-specific genes by up to 15-fold, suggesting that annotation heterogeneity is a substantial source of potential artifact.

Keywords: genome annotation; lineage-specific genes; novel genes; orphan genes; taxonomically restricted genes.


Conflict of interest statement

Declaration of interests The authors declare no competing interests.

Figures

Figure 1:
Figure 1:. Comparison of the number of lineage-specific genes found using uniform and heterogeneous (phyletic) annotations in a) cichlids and b) primates.
The species tree on the left indicates the lineage under consideration (grey shading); different text colors indicate different annotation sources in the heterogeneous annotation analysis (black, NCBI; red, research group at the Broad Institute; blue, Ensembl; see also Supplemental Table 3, 4). A depiction of the uniform annotation pattern, in which all annotations are from NCBI (black), is not shown. Bar graphs indicate the number of genes that appear specific to the lineage shaded on the species tree to the left using either uniform or heterogeneous annotations. See also Supplemental Table 5 for results of tBLASTx searches in this group.
Figure 2:
Figure 2:. Comparison of the number of lineage-specific genes found using uniform and heterogeneous (semi-phyletic) annotations in a) rodents and b) bats.
The species tree on the left indicates the lineage under consideration (grey shading); different text colors indicate different annotation sources in the heterogeneous annotation analysis (black, NCBI; blue, UCSC; red, Ensembl “mixed genebuild”; purple, Ensembl “full genebuild”; green, Bat1k; pink, Beijing Genomics Institute; see also Supplemental Table 3, 4). A depiction of the uniform annotation pattern, in which all annotations are from NCBI (black), is not shown. Bar graphs indicate the number of genes that appear specific to the lineage shaded on the species tree to the left using either uniform or heterogeneous annotations. See also Supplemental Table 5 for results of tBLASTx searches in this group.
Figure 3:
Figure 3:. Comparison of the number of lineage-specific genes found using uniform and heterogeneous (unpatterned) annotations in a) rodents and b) bats.
The species tree on the left indicates the lineage under consideration (grey shading); different text colors indicate different annotation sources in the heterogeneous annotation analysis (black, NCBI; blue, UCSC; red, Ensembl “mixed genebuild”; purple, Ensembl “full genebuild”; green, Bat1k; pink, Beijing Genomics Institute; see also Supplemental Table 3, 4). A depiction of the uniform annotation pattern, in which all annotations are from NCBI (black), is not shown. Bar graphs indicate the number of genes that appear specific to the lineage shaded on the species tree to the left using either uniform or heterogeneous annotations. See also Supplemental Table 5 for results of tBLASTx searches in this group.

References

    1. Khalturin K, Hemmrich G, Fraune S, Augustin R, and Bosch TC (2009). More than just orphans: are taxonomically-restricted genes important in evolution? Trends in Genetics 25, 404–413. - PubMed
    1. Tautz D, and Domazet-Lošo T (2011). The evolutionary origin of orphan genes. Nature Reviews Genetics 12, 692. - PubMed
    1. Wilson G, Bertrand N, Patel Y, Hughes J, Feil E, and Field D (2005). Orphans as taxonomically restricted and ecologically important genes. Microbiology 151, 2499–2501. - PubMed
    1. McLysaght A, and Guerzoni D (2015). New genes from non-coding sequence: the role of de novo protein-coding genes in eukaryotic evolutionary innovation. Philosophical Transactions of the Royal Society B: Biological Sciences 370, 20140332. - PMC - PubMed
    1. Tautz D (2014). The discovery of de novo gene evolution. Perspectives in biology and medicine 57, 149–161. - PubMed

Publication types