
Worldwide Disparities in Recovery of Cardiac Testing 1 Year Into COVID-19

Andrew J Einstein et al. J Am Coll Cardiol. .

Abstract

Background: The extent to which health care systems have adapted to the COVID-19 pandemic to provide necessary cardiac diagnostic services is unknown.

Objectives: The aim of this study was to determine the impact of the pandemic on cardiac testing practices, volumes and types of diagnostic services, and perceived psychological stress to health care providers worldwide.

Methods: The International Atomic Energy Agency conducted a worldwide survey assessing alterations from baseline in cardiovascular diagnostic care at the pandemic's onset and 1 year later. Multivariable regression was used to determine factors associated with procedure volume recovery.

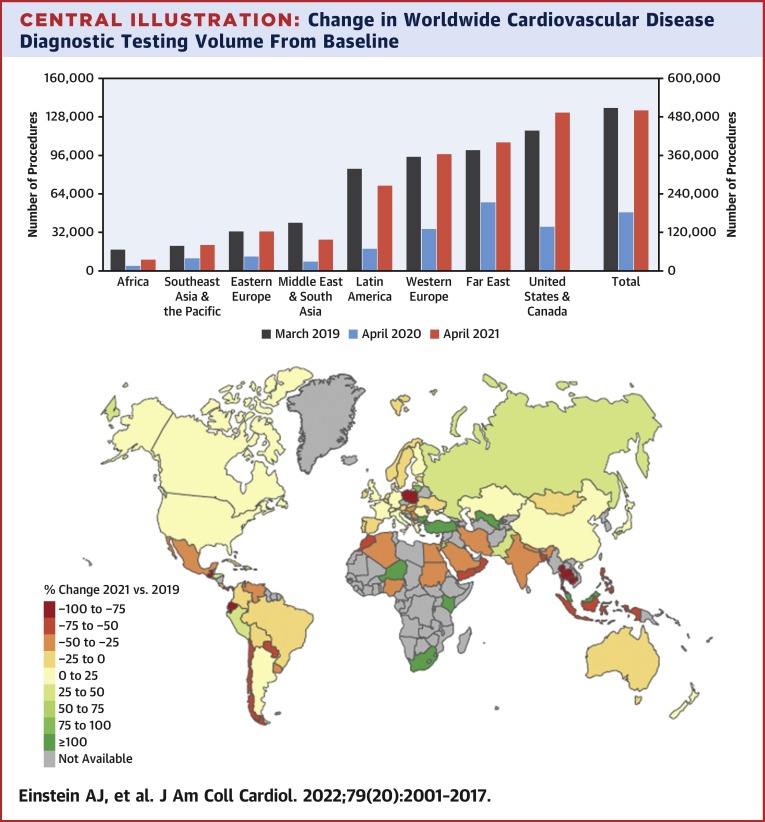
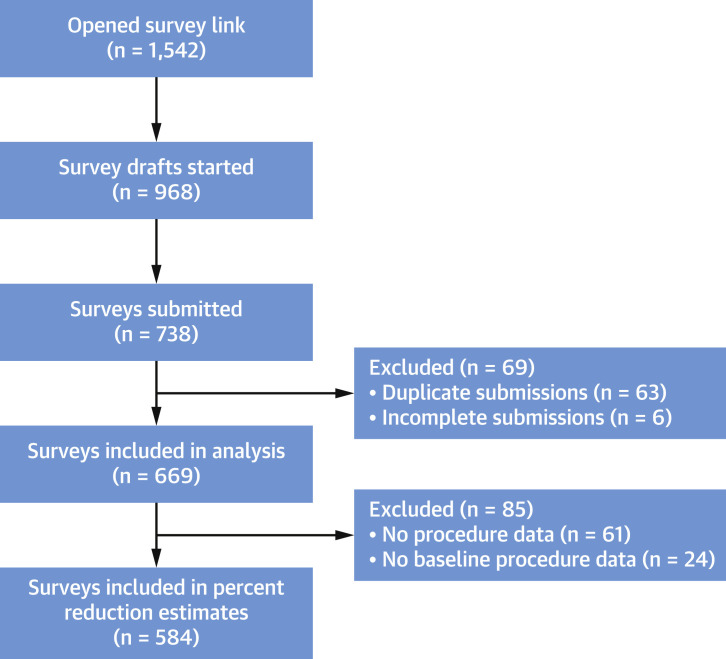
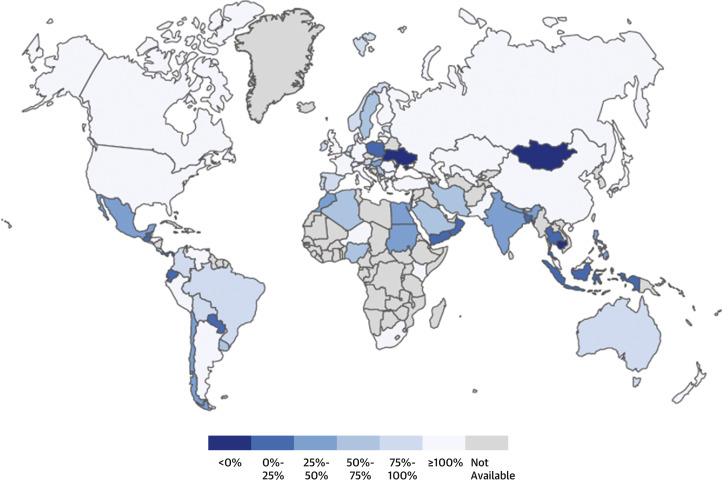
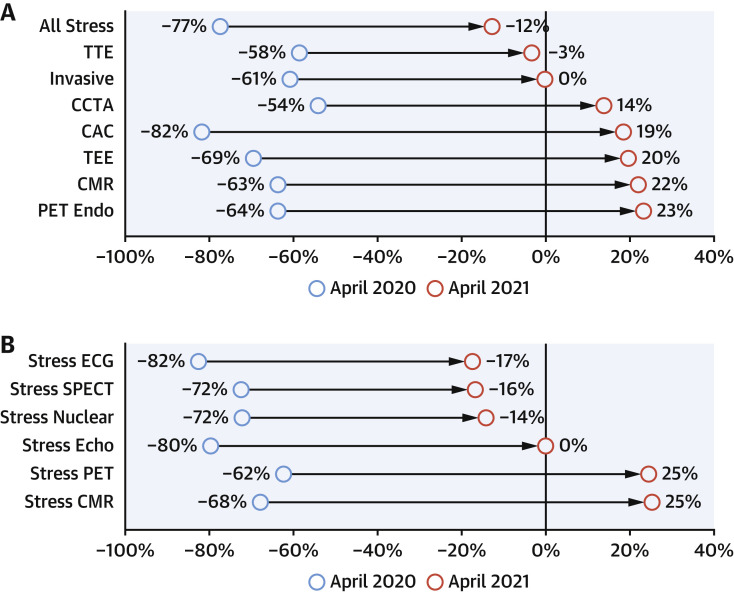
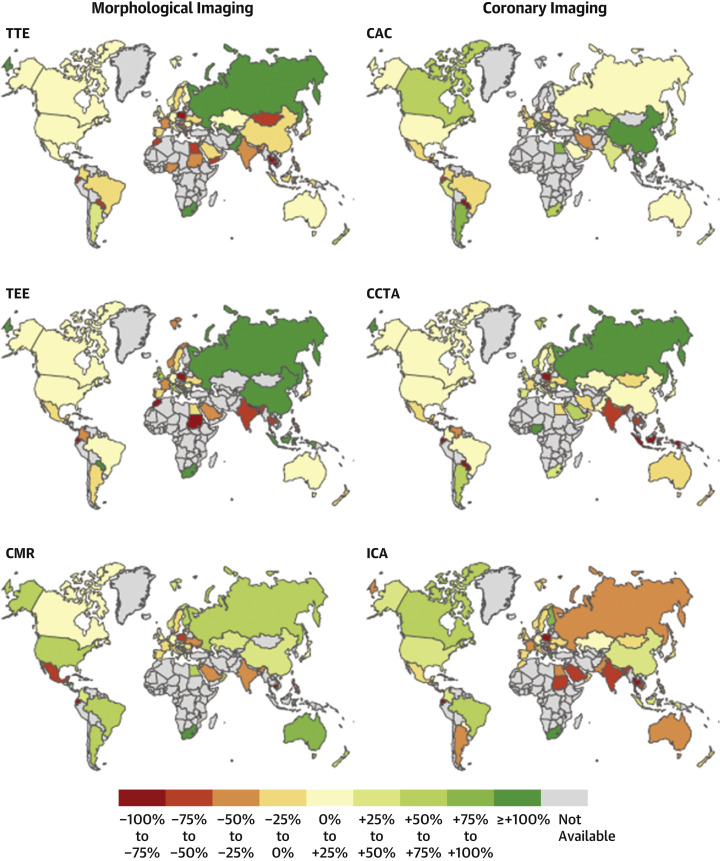
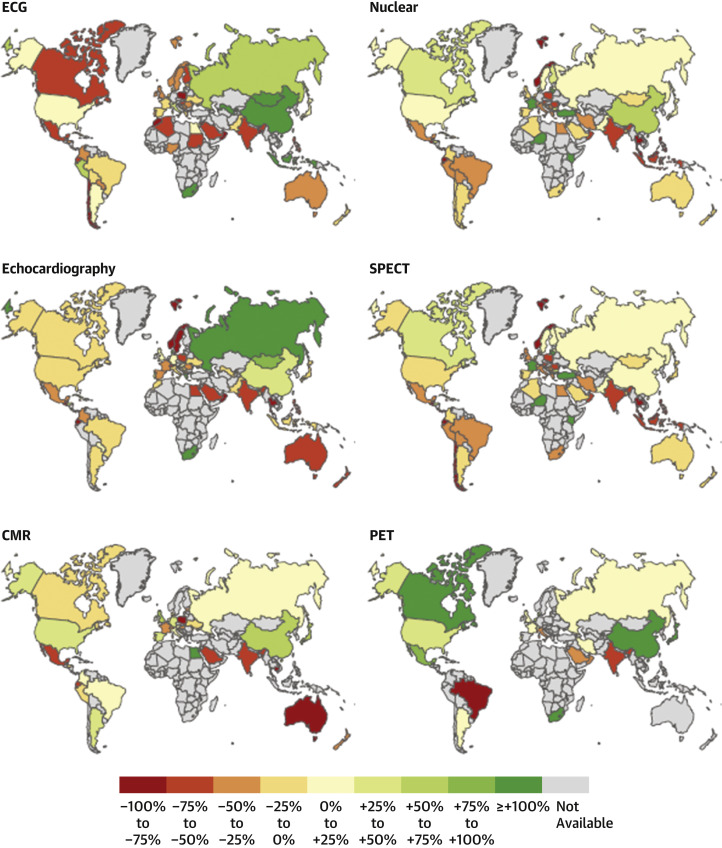
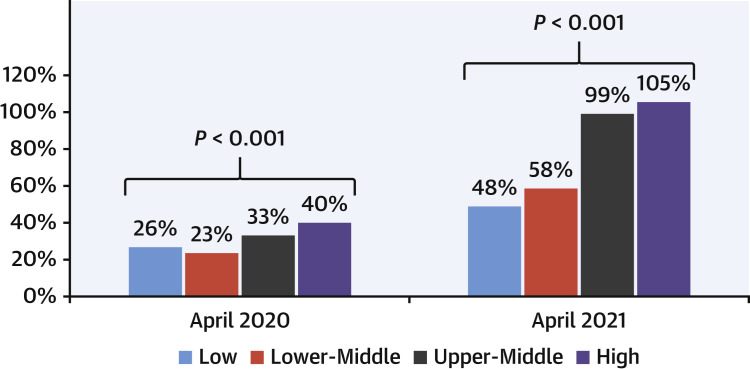
Results: Surveys were submitted from 669 centers in 107 countries. Worldwide reduction in cardiac procedure volumes of 64% from March 2019 to April 2020 recovered by April 2021 in high- and upper middle-income countries (recovery rates of 108% and 99%) but remained depressed in lower middle- and low-income countries (46% and 30% recovery). Although stress testing was used 12% less frequently in 2021 than in 2019, coronary computed tomographic angiography was used 14% more, a trend also seen for other advanced cardiac imaging modalities (positron emission tomography and magnetic resonance; 22%-25% increases). Pandemic-related psychological stress was estimated to have affected nearly 40% of staff, impacting patient care at 78% of sites. In multivariable regression, only lower-income status and physicians' psychological stress were significant in predicting recovery of cardiac testing.

Conclusions: Cardiac diagnostic testing has yet to recover to prepandemic levels in lower-income countries. Worldwide, the decrease in standard stress testing is offset by greater use of advanced cardiac imaging modalities. Pandemic-related psychological stress among providers is widespread and associated with poor recovery of cardiac testing.

Keywords: COVID-19; cardiac testing; cardiovascular disease; coronavirus; global health.


Conflict of interest statement

Funding Support and Author Disclosures Dr Williams is supported by the British Heart Foundation (FS/ICRF/20/26002). Dr Einstein has received speaker fees from Ionetix; has received consulting fees from W. L. Gore & Associates; has received authorship fees from Wolters Kluwer Healthcare – UpToDate; and has received grants or grants pending to his institution from Attralus, Canon Medical Systems, Eidos Therapeutics, GE Healthcare, Pfizer, Roche Medical Systems, W. L. Gore & Associates, and XyloCor Therapeutics. Dr Williams has received speaker fees from Canon Medical Systems. Dr Dorbala has received honoraria from Pfizer and GE Healthcare; and has received grants to her institution from Pfizer and GE Healthcare. Dr Sinitsyn has received congress speaker honoraria from Bayer, GE Healthcare, Siemens, and Philips. Dr Kudo has received research grants from Nihon Medi-physics and FUJIFILM Toyama Chemical. Dr Bucciarelli-Ducci is CEO (part-time) of the Society for Cardiovascular Magnetic Resonance; and has received speaker fees from Circle Cardiovascular Imaging, Bayer, and Siemens Healthineers. All other authors have reported that they have no relationships relevant to the contents of this paper to disclose.

Figures

None
Graphical abstract
Figure 1
Figure 1
Flow Diagram Detailing Survey Completion The 8-page online survey was completed by July 25, 2021. The survey link was opened 1,542 times, which includes multiple counts for the same respondent opening it on multiple devices. Six hundred sixty-nine participants from 107 countries submitted survey data that were included in the final analysis.
Central Illustration
Change in Worldwide Cardiovascular Disease Diagnostic Testing Volume From Baseline (Top) Bar chart of cardiovascular disease test volumes at the 669 participating centers, by International Atomic Energy Agency world regions, for 2019 baseline, the beginning of the pandemic (April 2020), and 1 year into the pandemic (April 2021). Note different y-axes for world regions and worldwide. Percentage reductions from 2019 are reported at the tops of the columns. (Bottom) World map demonstrating changes in total cardiovascular procedural volume from March 2019 to April 2021 across the 107 participating countries. Countries or territories of a country in gray did not have data available. Procedures recorded included morphologic and other types of rest imaging (transthoracic and transesophageal echocardiography, cardiac magnetic resonance [CMR], and positron emission tomography [PET] for infective endocarditis), coronary imaging (coronary computed tomographic angiography, coronary artery calcium scoring, and invasive coronary angiography), and stress testing (stress electrocardiography, stress echocardiography, nuclear stress imaging [single-photon emission computed tomography and PET], and stress CMR). For each numerical range specified by a color, the lower limit provided is inclusive whereas the upper limit is exclusive; for example, –100 to –75 reflects a % change that is ≥–100%, but <–75%, while 75 to 100 reflects a % change that is ≥75%, but <100%.
Figure 2
Figure 2
Worldwide Recovery in Cardiac Diagnostic Testing Recovery is defined as percentage return in 2021 to 2019 baseline, from 2020 volumes at the initial phase of the pandemic. Lightest blue reflects full recovery, and darker shades of blue reflect lower recovery. For each range specified by a shade of blue in the color bar, the lower limit provided is inclusive whereas the upper limit is exclusive; for example, 0%-25% reflects a percentage recovery that is ≥0%, but <25%.
Figure 3
Figure 3
Changes From Baseline Procedure Volumes Percentage change from March 2019 baseline, for the early phase of the pandemic (April 2020; blue circles) and 1 year later (April 2021; red circles). (A) Changes for noninvasive testing procedures. (B) Changes for the different types of stress tests. CAC = coronary artery calcium scoring; CCTA = coronary computed tomographic angiography; CMR = cardiac magnetic resonance; ECG = electrocardiography; Echo = echocardiography; Nuclear = single-photon emission computed tomography and positron emission tomography combined; PET = positron emission tomography; PET Endo = positron emission tomography for infective endocarditis; SPECT = single-photon emission computed tomography; TEE = transesophageal echocardiography; TTE = transthoracic echocardiography.
Figure 4
Figure 4
Worldwide Changes in Morphologic and Coronary Imaging Procedure Volumes Maps displaying by-country estimated changes in procedure volume for common morphologic imaging (left column) and coronary imaging (right column) procedures, from prepandemic to 1 year into the pandemic. Changes as displayed are color coded on the basis of percentage change in volume from March 2019 to April 2021. For each range specified by a color in the color bar, the lower limit provided is inclusive whereas the upper limit is exclusive; for example, –100% to –75% reflects a % change that is ≥–100%, but <–75%, while +75% to +100% reflects a % change that is ≥75%, but <100%. ICA = invasive coronary angiography; other abbreviations as in Figure 3.
Figure 5
Figure 5
Worldwide Changes in Stress Testing Procedure Volumes Maps displaying by-country estimated changes in procedure volume for common cardiac stress testing procedures, from prepandemic to 1 year into the pandemic. Changes are color coded on the basis of percentage change in volume from March 2019 to April 2021. For each range specified by a color in the color bar, the lower limit provided is inclusive whereas the upper limit is exclusive; for example, –100% to –75% reflects a % change that is ≥–100%, but <–75%, while +75% to +100% reflects a % change that is ≥75%, but <100%. Abbreviations as in Figure 3.
Figure 6
Figure 6
Worldwide Shortages of Personal Protective Equipment Percentage of centers reporting types of shortage of 5 important forms of personal protective equipment during the COVID-19 pandemic. Green denotes no shortage, red denotes lack of availability throughout the pandemic, and shades of yellow/orange denote shortage at some times, with specific shade specifying whether availability was greater in 2020 or 2021. (A) By world region. (B) By World Bank income level.
Figure 6
Figure 6
Worldwide Shortages of Personal Protective Equipment Percentage of centers reporting types of shortage of 5 important forms of personal protective equipment during the COVID-19 pandemic. Green denotes no shortage, red denotes lack of availability throughout the pandemic, and shades of yellow/orange denote shortage at some times, with specific shade specifying whether availability was greater in 2020 or 2021. (A) By world region. (B) By World Bank income level.
Figure 7
Figure 7
Procedure Volumes Compared With 2019 Baseline, by World Bank Income Group The bar graph demonstrates the greater effect of the pandemic on cardiac testing procedure volume on poorer countries, with a persisting reduction from March 2019 baseline in low-income and lower middle-income countries, but strong recovery in upper middle- and high-income countries

Comment in

References

    1. Einstein A.J., Shaw L.J., Hirschfeld C., et al. International impact of COVID-19 on the diagnosis of heart disease. J Am Coll Cardiol. 2021;77:173–185. - PMC - PubMed
    1. World Bank Data Team World Bank country and lending groups. https://datahelpdesk.worldbank.org/knowledgebase/articles/906519-world-b... Available at:
    1. Mathieu E., Ritchie H., Ortiz-Ospina E., et al. A global database of COVID-19 vaccinations. Nat Hum Behav. 2021;5:947–953. - PubMed
    1. United Nations UN/DESA Policy Brief #81: impact of COVID-19 on SDG progress: a statistical perspective. https://www.un.org/development/desa/dpad/publication/un-desa-policy-brie... Available at:
    1. Thienemann F., Pinto F., Grobbee D.E., et al. World Heart Federation briefing on prevention: coronavirus disease 2019 (COVID-19) in low-income countries. Glob Heart. 2020;15:31. - PMC - PubMed

Publication types