. 2022 May 19;13(1):2778.
doi: 10.1038/s41467-022-30123-y.

Shape and structural relaxation of colloidal tactoids

Affiliations

Shape and structural relaxation of colloidal tactoids

Hamed Almohammadi et al. Nat Commun. .

Abstract

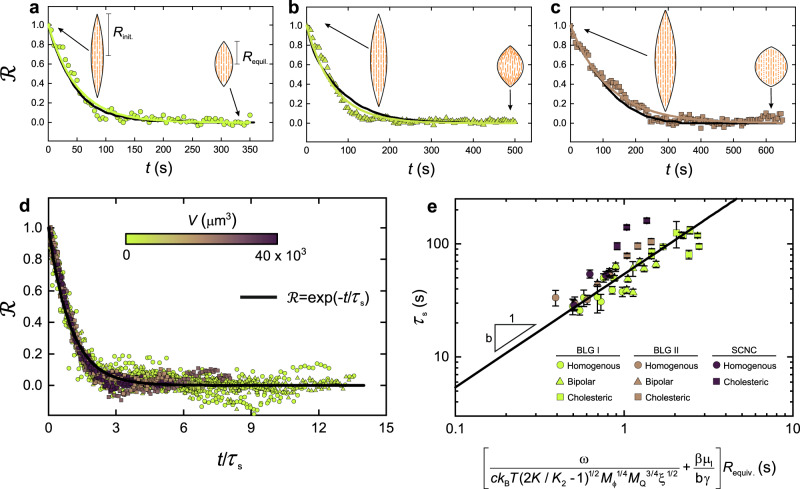
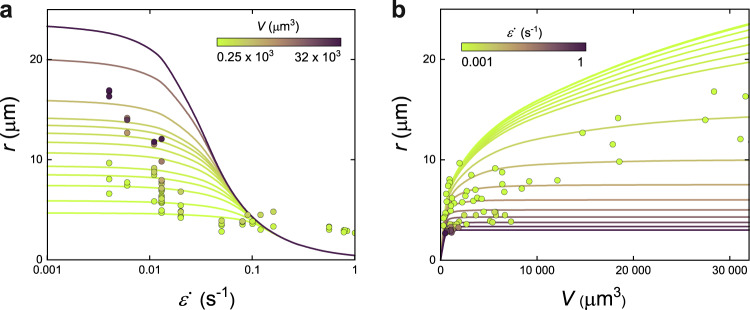
Facile geometric-structural response of liquid crystalline colloids to external fields enables many technological advances. However, the relaxation mechanisms for liquid crystalline colloids under mobile boundaries remain still unexplored. Here, by combining experiments, numerical simulations and theory, we describe the shape and structural relaxation of colloidal liquid crystalline micro-droplets, called tactoids, where amyloid fibrils and cellulose nanocrystals are used as model systems. We show that tactoids shape relaxation bears a universal single exponential decay signature and derive an analytic expression to predict this out of equilibrium process, which is governed by liquid crystalline anisotropic and isotropic contributions. The tactoids structural relaxation shows fundamentally different paths, with first- and second-order exponential decays, depending on the existence of splay/bend/twist orientation structures in the ground state. Our findings offer a comprehensive understanding on dynamic confinement effects in liquid crystalline colloidal systems and may set unexplored directions in the development of novel responsive materials.


Conflict of interest statement

The authors declare no competing interests.

Figures

Fig. 1
Fig. 1. Relaxation of different classes of the amyloid fibril liquid crystalline droplets.
The sequence of time-lapse images of relaxation of initially extended amyloid fibrils liquid crystalline droplets with different volumes. In each panel, the first row shows the experimental results taken with LC (liquid crystal)-PolScope device. The colormaps corresponding to experimental results denote the orientation of the director filed in the xz plane; the second row demonstrates the numerical simulation results with color bar capturing the director field orientation with respect to z-axis. The tactoids are at the homogenous configuration at the initial state and upon relaxation, they hold different configurations. a An initially extended tactoid with volume 644 µm3 undergoes shape relaxation while its configuration remains unchanged at homogenous configuration. b An elongated tactoid with volume 2751 µm3 relaxes both its shape and structure recovering a bipolar configuration upon relaxation. c A droplet with volume 16,414 µm3, having larger volume compared to (a, b), relaxes to a cholesteric structure with three bands. Since colors and director lines show the same information due to the axisymmetric nature of the homogenous (a) and bipolar (b) tactoids, the lines are not shown for better readability (see Supplementary Movies 4–6 for the version with lines). Note that the brightness of the experimental images is varied for better visualization.
Fig. 2
Fig. 2. Shape relaxation of amyloid fibril liquid crystalline tactoids.
ac Evaluation of R (defined as RtRequil.Rinit.Requil. where Requil., Rinit., and R(t) are the half-length of the long axis of tactoid at equilibrium, at the initial time, and at a given time t, respectively) with respect to time for tactoids that relax to homogenous, Requiv. (V1/3, with V the volume) = 9.4 µm (a), bipolar, Requiv. = 19.3 µm (b) and cholesteric, Requiv. = 27.8 µm (c) configurations at equilibrium. Symbols and black lines denote the experimental and numerical simulation results, respectively; colored lines show the fitting (R=exptτs) that is used to obtain the characteristic shape relaxation time, τs. d Evaluation of R with respect to scaled time tτs resulting in a universal curve, R=exptτs, for shape relaxation of the different classes of tactoids with various volumes and initial elongation values. e Circle, triangle, and square symbols denote homogenous, bipolar, and cholesteric tactoids, respectively. The error bars represent standard deviation. The developed theory, solid line, predicts the τs for different classes of BLG and SCNC liquid crystalline tactoids, confirming the generality of our approach to predict the bio-colloidal liquid crystalline tactoids relaxation behavior. Here, ω is the anchoring strength, ckB T is the thermal energy per unit volume of dispersion, K and K2 are the Frank elastic constants, ξ is the coherence length, M is the mass mobility, MQ is the rotational mobility, γ is the interfacial tension, βμI is the effective viscosity, and b is a single constant pre-factor.
Fig. 3
Fig. 3. Maximum deformation of tactoids under various extension rate.
a The theory (lines) and the experimental data (symbols) predict that short axis of the tactoids r decreases as the extension rate ε° increases where r lines, corresponding to tactoids with different volumes V, converge to a single curve at large values of extension rate. b At a given extension rate, the short axis of the tactoids increases logarithmically with an increase in the volume of the tactoids.
Fig. 4
Fig. 4. Structural relaxation of different classes of liquid crystalline tactoids.
ac Evaluation of S (defined as StSequil.Sinit.Sequil. for homogeneous and bipolar tactoids and S=StSminimumSinit.Sminimum for cholesteric tactoids, where Sequil., Sinit., and S(t) are order parameter values at equilibrium, at the initial time, and at a given time t, respectively) with respect to scaled time, tτc with τc the characteristic configurational relaxation time, for tactoids that relax to homogenous (a), bipolar (b) and cholesteric (c) configurations at equilibrium. The experimental insets showing the retardance images taken with LC-PolScope along with numerical simulation results present the critical state of the relaxation for each class of the tactoids. Color bar denotes the order parameter values in numerical simulation insets. Note that the brightness of the experimental images is increased for better visualization. The symbols denote the experimental data, black solid lines are numerical simulation results. Colored and dashed black lines show the fitting that is used to obtain τc from experimental and numerical simulation results, respectively. df The changes in dSdt, obtained from the fitted lines in ac, during relaxation for different classes of tactoids: homogenous (d), bipolar (e), and cholesteric (f) configurations. While homogenous and bipolar tactoids follow monotonic single exponential decay during relaxation S=exptτc, the cholesteric tactoids are characterized by a non-monotonic behavior of S during relaxation (see (c)), described by a second-order exponential decay, S=c1expt/τc,1+(1c1)exp(t/τc,2), where c1 is a constant.

References

    1. Smalyukh II. Liquid crystal colloids. Annu. Rev. Condens. Matter Phys. 2018;9:207–226. doi: 10.1146/annurev-conmatphys-033117-054102. - DOI
    1. Prinsen P, van der Schoot P. Shape and director-field transformation of tactoids. Phys. Rev. E. 2003;68:21701. doi: 10.1103/PhysRevE.68.021701. - DOI - PubMed
    1. Prinsen P, van der Schoot P. Parity breaking in nematic tactoids. J. Phys. Condens. Matter. 2004;16:8835. doi: 10.1088/0953-8984/16/49/003. - DOI - PubMed
    1. Nyström G, Arcari M, Mezzenga R. Confinement-induced liquid crystalline transitions in amyloid fibril cholesteric tactoids. Nat. Nanotech. 2018;13:330. doi: 10.1038/s41565-018-0071-9. - DOI - PubMed
    1. Wang PX, MacLachlan MJ. Liquid crystalline tactoids: ordered structure, defective coalescence and evolution in confined geometries. Philos. Trans. A Math. Phys. Eng. Sci. 2018;376:20170042. - PMC - PubMed

Publication types