. 2022 May 19;11(1):26.
doi: 10.1038/s41389-022-00401-x.

Tumor suppressor p53 restrains cancer cell dissemination by modulating mitochondrial dynamics

Affiliations

Tumor suppressor p53 restrains cancer cell dissemination by modulating mitochondrial dynamics

Trinh T T Phan et al. Oncogenesis. .

Abstract

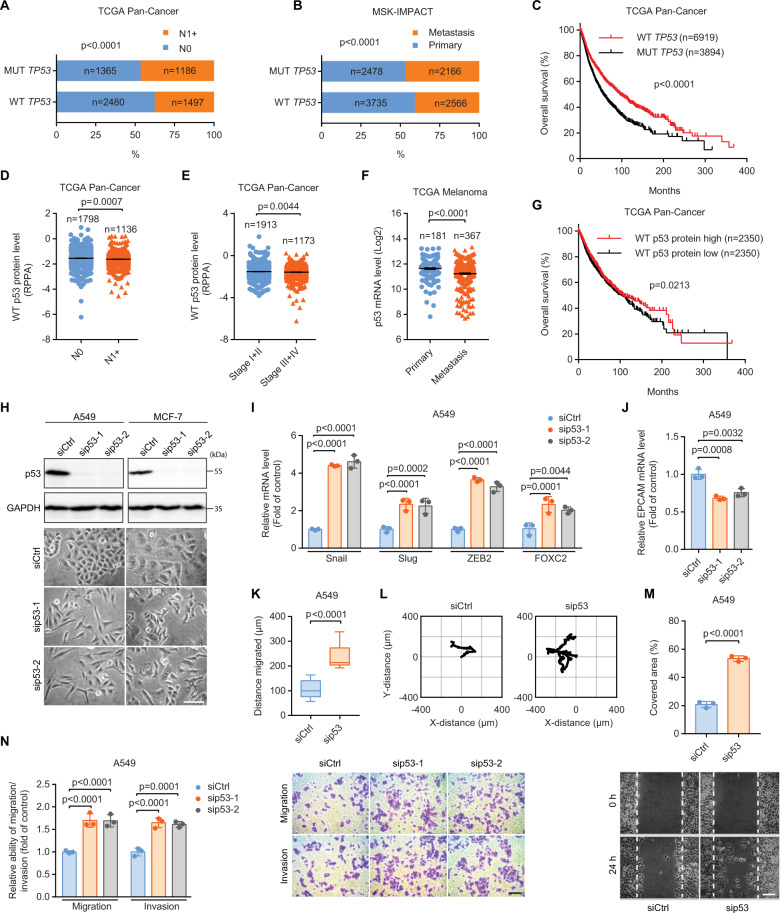
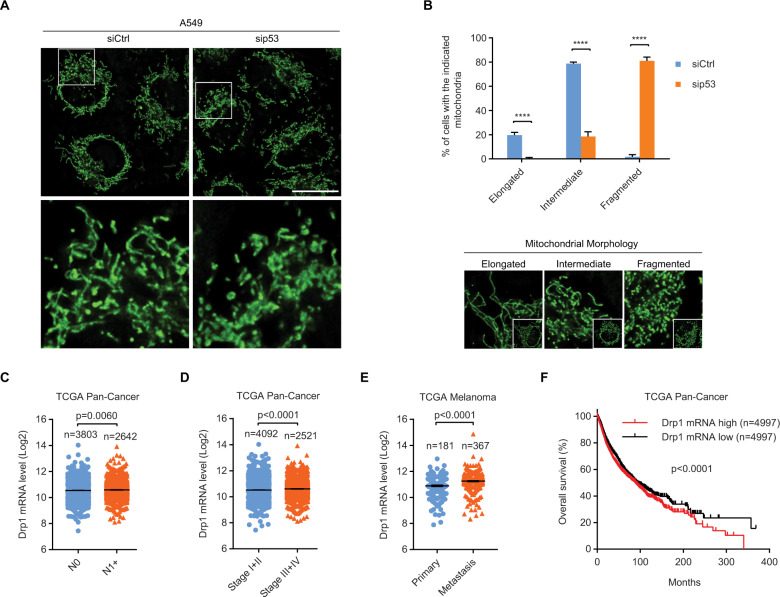
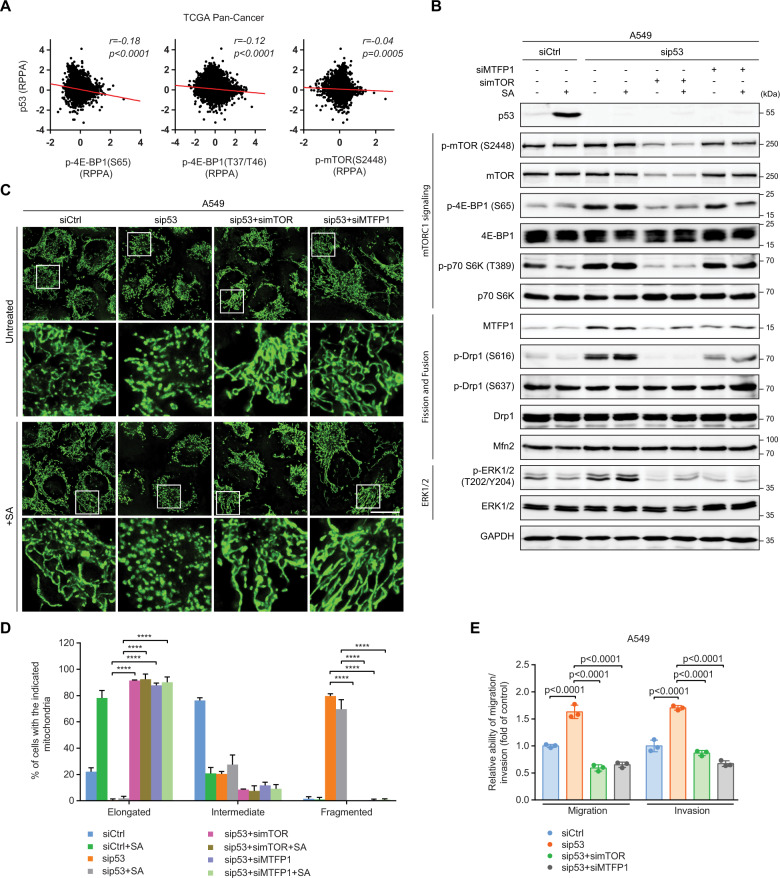
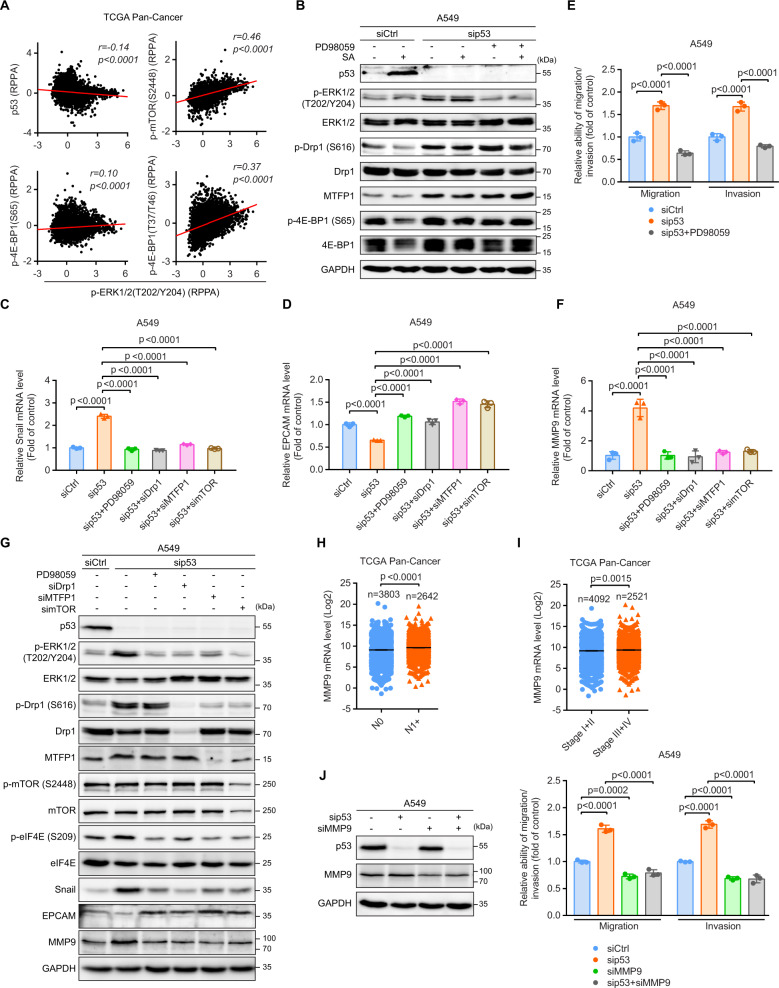
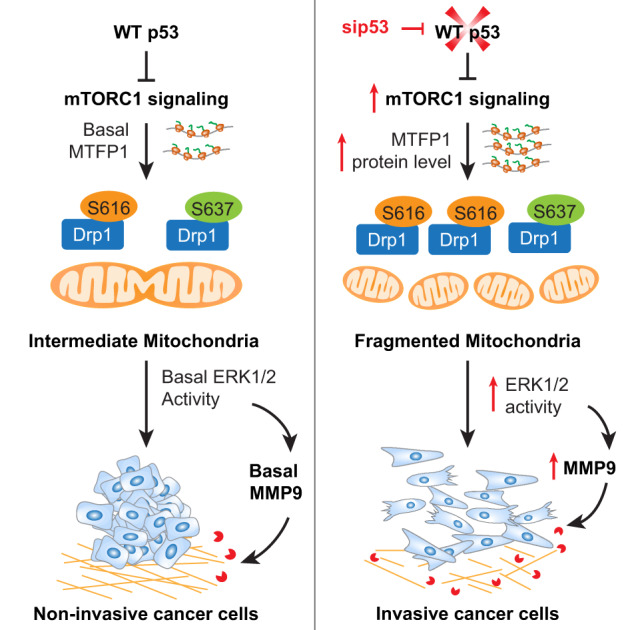
Tumor suppressor p53 plays a central role in preventing tumorigenesis. Here, we unravel how p53 modulates mitochondrial dynamics to restrain the metastatic properties of cancer cells. p53 inhibits the mammalian target of rapamycin complex 1 (mTORC1) signaling to attenuate the protein level of mitochondrial fission process 1 (MTFP1), which fosters the pro-fission dynamin-related protein 1 (Drp1) phosphorylation. This regulatory mechanism allows p53 to restrict cell migration and invasion governed by Drp1-mediated mitochondrial fission. Downregulating p53 expression or elevating the molecular signature of mitochondrial fission correlates with aggressive tumor phenotypes and poor prognosis in cancer patients. Upon p53 loss, exaggerated mitochondrial fragmentation stimulates the activation of the extracellular signal-regulated kinase 1/2 (ERK1/2) signaling resulting in epithelial-to-mesenchymal transition (EMT)-like changes in cell morphology, accompanied by accelerated matrix metalloproteinase 9 (MMP9) expression and invasive cell migration. Notably, blocking the activation of mTORC1/MTFP1/Drp1/ERK1/2 axis completely abolishes the p53 deficiency-driven cellular morphological switch, MMP9 expression, and cancer cell dissemination. Our findings unveil a hitherto unrecognized mitochondria-dependent molecular mechanism underlying the metastatic phenotypes of p53-compromised cancers.


Conflict of interest statement

The authors declare no competing interests.

Figures

Fig. 1
Fig. 1. Downregulation of WT p53 expression is associated with aggressive tumor phenotypes and poor prognosis.
Contingency analysis of the associations between the presence of TP53 mutations and the probabilities of metastases to (A) lymph nodes and (B) distant organs. N0, lymph node-negative; N1+, lymph-node-positive. Data were derived from (A) The Cancer Genome Atlas (TCGA) Pan-Cancer and (B) the Memorial Sloan-Kettering Integrated Mutation Profiling of Actionable Cancer Targets (MSK-IMPACT) cohorts. The p values represent the significance of the observed mutual exclusivity between the WT TP53 and MUT TP53 groups (A and B). C Kaplan–Meier analysis of overall survival in cancer patients having WT and MUT TP53. p53 protein expression of patients having WT TP53 (D) with N0 and N1+ and (E) with stage I + II and III + IV tumors. RPPA, reverse-phase protein array. F p53 mRNA levels in primary and distant metastatic melanoma. G Kaplan–Meier analysis of overall survival in TP53 WT cancer patients with low and high p53 protein levels. Data were extracted from TCGA (CG). H Phase-contrast imaging of control (siCtrl) and p53-silenced (sip53-1 and sip53-2) A549 and MCF-7 cells. Scale bar: 100 µm. qRT-PCR analysis of the mRNA levels of (I) EMT inducers Snail (Snai1), Slug (Snai2), ZEB2 (zinc finger E-box binding homeobox 2), and FOXC2 (forkhead box protein C2) and (J) the epithelial cell adhesion molecule EPCAM in siCtrl, sip53-1, and sip53-2 A549 cells. Migration distance (K) and representative trajectories (L) of siCtrl (n = 28) and sip53 (n = 14) A549 cells. M Quantification (top) and representative images (bottom) of the area in a wound-healing assay covered by A549 cells transfected with siCtrl or sip53. Scale bar: 100 µm. N Transwell assays for siCtrl, sip53-1, and sip53-2 A549 cells. Scale bar: 100 µm. Error bars represent mean ± SEM (DF) or SD (I, J, M, and N). Data were analyzed by Fisher’s exact test (A and B), log-rank test (C and G), two-tailed unpaired Student’s t test (DF, K, and M), or one-way ANOVA with Tukey’s multiple comparisons test (I, J, and N).
Fig. 2
Fig. 2. p53 silencing amplifies mitochondrial fission has diagnostic and clinical implications.
Representative images (A) and quantification (B) of mitochondrial morphology in siCtrl (n = 222) and sip53 (n = 230) A549 cells. Boxed regions in (A) are shown enlarged in the bottom panels. Scale bar: 20 µm. B Representative images for each mitochondrial morphology type are shown in the bottom panels. Drp1 mRNA expression in (C) N0 and N1 + or (D) stage I + II and III + IV tumors. E Drp1 mRNA levels in primary and distant metastatic melanoma. F Kaplan–Meier analysis of overall survival in cancer patients with low and high Drp1 mRNA levels. Data were extracted from TCGA (CF). Error bars represent mean ± SD (B) or SEM (CE). Data were analyzed by one-way ANOVA with Tukey’s multiple comparisons test (B), two-tailed unpaired Student’s t test (CE), or log-rank test (F). ****p < 0.0001.
Fig. 3
Fig. 3. p53 elevation promotes mitochondrial elongation accompanied by attenuated invasive cell migration.
A Immunoblot of p53 in siCtrl and sip53 A549 cells with and without 20 µM SA treatment for 24 h. GAPDH was used as a loading control. Representative images (B) and quantification (C) of mitochondrial morphology in siCtrl (n = 223), siCtrl+SA (n = 211), sip53 (n = 205), and sip53+SA (n = 218) A549 cells. Boxed regions in (B) are shown enlarged in the bottom panels. Scale bar: 20 µm. Migration distance (D) and representative trajectories (E) of siCtrl (n = 29), siCtrl+SA (n = 17), sip53 (n = 13), and sip53+SA (n = 15) A549 cells. Transwell assays for (F) siCtrl, siCtrl+SA, sip53, and sip53+SA A549 cells or (G) control (Ctrl) and p53-overexpressing (p53) H1299 cells. Scale bar: 100 µm. Error bars represent mean ± SD. Data were analyzed by one-way ANOVA with Tukey’s multiple comparisons test. ****p < 0.0001.
Fig. 4
Fig. 4. p53 alleviates Drp1-mediated mitochondrial fission and thereby restrains cell migration and invasion.
A Immunoblot of the indicated proteins in siCtrl, sip53, and p53/Drp1 double-knockdown (sip53 + siDrp1) A549 cells with and without 20 µM SA treatment for 24 h. GAPDH was used as a loading control. B Quantification of levels of Drp1, p-Drp1 (S637), and p-Drp1 (S616) in Fig. 4 A. C Immunoblot of the indicated proteins in siCtrl and sip53 MCF-7 cells with and without 20 µM SA treatment for 24 h. GAPDH was used as a loading control. Representative images (D) and quantification (E) of mitochondrial morphology in siCtrl (n = 226), siCtrl+SA (n = 232), sip53 (n = 205), sip53+SA (n = 214), sip53 + siDrp1 (n = 230), and sip53 + siDrp1+SA (n = 214) A549 cells. Boxed regions in (D) are shown enlarged in the bottom panels. Scale bar: 20 µm. F Transwell assays for siCtrl, sip53, and sip53 + siDrp1 A549 cells. Error bars represent mean ± SD. Data were analyzed by two-tailed unpaired Student’s t test (B) or one-way ANOVA with Tukey’s multiple comparisons test (E and F). ****p < 0.0001.
Fig. 5
Fig. 5. p53 diminishes mTORC1-controlled MTFP1 protein levels to attenuate Drp1-driven mitochondrial fission and invasive cell migration.
A Correlations between the RPPA levels of p53 and the indicated proteins (n = 7694 samples). Data were extracted from TCGA. B Immunoblot of the indicated proteins in siCtrl, sip53, p53/mTOR double-knockdown (sip53+simTOR), and p53/MTFP1 double-knockdown (sip53 + siMTFP1) A549 cells with and without 20 µM SA treatment for 24 h. GAPDH was used as a loading control. Representative images (C) and quantification (D) of mitochondrial morphology in siCtrl (n = 203), siCtrl+SA (n = 207), sip53 (n = 200), sip53+SA (n = 213), sip53+simTOR (n = 234), sip53+simTOR+SA (n = 209), sip53 + siMTFP1 (n = 214), and sip53 + siMTFP1+SA (n = 213) A549 cells. Boxed regions in (C) are shown enlarged in the bottom panels of each group. Scale bar: 20 µm. E Transwell assays for siCtrl, sip53, sip53+simTOR, and sip53 + siMTFP1 A549 cells. Error bars represent mean ± SD. Data were analyzed by one-way ANOVA with Tukey’s multiple comparisons test. ****p < 0.0001.
Fig. 6
Fig. 6. Activation of mTORC1/MTFP1/Drp1/ERK1/2 signaling axis is required for the EMT switch, MMP9 elevation, and cancer dissemination upon WT p53 loss.
A Correlations between the RPPA levels of p-ERK1/2 (T202/Y204) and the indicated proteins (n = 7694 samples). Data were extracted from TCGA. B Immunoblot of the indicated proteins in siCtrl, sip53, and PD98059-treated sip53 (sip53 + PD98059) A549 cells with and without 20 µM SA treatment for 24 h. GAPDH was used as a loading control. qRT-PCR analysis of the mRNA levels of (C) Snail and (D) EPCAM in siCtrl, sip53, sip53 + PD98059, sip53 + siDrp1, sip53 + siMTFP1, and sip53+simTOR A549 cells. E Transwell assays for siCtrl, sip53, and sip53 + PD98059 A549 cells. F qRT-PCR analysis of MMP9 mRNA expression in siCtrl, sip53, sip53 + PD98059, sip53 + siDrp1, sip53 + siMTFP1, and sip53+simTOR A549 cells. G Immunoblot of the indicated proteins in siCtrl, sip53, sip53 + PD98059, sip53 + siDrp1, sip53 + siMTFP1, and sip53+simTOR A549 cells. GAPDH was used as a loading control. MMP9 mRNA expression in (H) N0 and N1 + or (I) stage I + II and III + IV tumors. Data were extracted from TCGA. J Transwell assays for siCtrl, sip53, MMP9-silenced (siMMP9), and p53/MMP9 double-knockdown (sip53 + siMMP9) A549 cells. Error bars represent mean ± SD (CF and J) or SEM (H and I). Data were analyzed by one-way ANOVA with Tukey’s multiple comparisons test (CF and J) or two-tailed unpaired Student’s t test (H and I).
Fig. 7
Fig. 7. Schematic model of how p53 modulates mitochondrial dynamics to constrain EMT, MMP9 expression, and invasive cell migration.
WT p53 suppresses mTORC1-directed MTFP1 protein expression and the aberrant phosphorylation of Drp1 at the pro-fission site S616, maintaining the predominantly intermediate state of mitochondria, and thereby constraining ERK1/2-mediated cell migration and invasion. Loss of WT p53 elevates mTORC1 activity, MTFP1 protein levels, and the phosphorylation of S616 on Drp1, shifting mitochondrial dynamics toward fission to promote ERK1/2 activation and resulting in EMT-like changes in cell morphology, increased MMP9 expression, and cell dissemination.

References

    1. Caino MC, Seo JH, Aguinaldo A, Wait E, Bryant KG, Kossenkov AV, et al. A neuronal network of mitochondrial dynamics regulates metastasis. Nat Commun. 2016;7:13730. doi: 10.1038/ncomms13730. - DOI - PMC - PubMed
    1. Sun X, Cao H, Zhan L, Yin C, Wang G, Liang P, et al. Mitochondrial fission promotes cell migration by Ca(2+)/CaMKII/ERK/FAK pathway in hepatocellular carcinoma. Liver Int. 2018;38:1263–72. doi: 10.1111/liv.13660. - DOI - PubMed
    1. Zhao J, Zhang J, Yu M, Xie Y, Huang Y, Wolff DW, et al. Mitochondrial dynamics regulates migration and invasion of breast cancer cells. Oncogene. 2013;32:4814–24. doi: 10.1038/onc.2012.494. - DOI - PMC - PubMed
    1. Yin M, Lu Q, Liu X, Wang T, Liu Y, Chen L. Silencing Drp1 inhibits glioma cells proliferation and invasion by RHOA/ ROCK1 pathway. Biochem Biophys Res Commun. 2016;478:663–8. doi: 10.1016/j.bbrc.2016.08.003. - DOI - PubMed
    1. Liang J, Yang Y, Bai L, Li F, Li E. DRP1 upregulation promotes pancreatic cancer growth and metastasis through increased aerobic glycolysis. J Gastroenterol Hepatol. 2020;35:885–95. doi: 10.1111/jgh.14912. - DOI - PubMed