. 2022 May 19;13(1):2774.
doi: 10.1038/s41467-022-30088-y.

SARS-CoV-2 infection results in immune responses in the respiratory tract and peripheral blood that suggest mechanisms of disease severity

Affiliations

SARS-CoV-2 infection results in immune responses in the respiratory tract and peripheral blood that suggest mechanisms of disease severity

Wuji Zhang et al. Nat Commun. .

Abstract

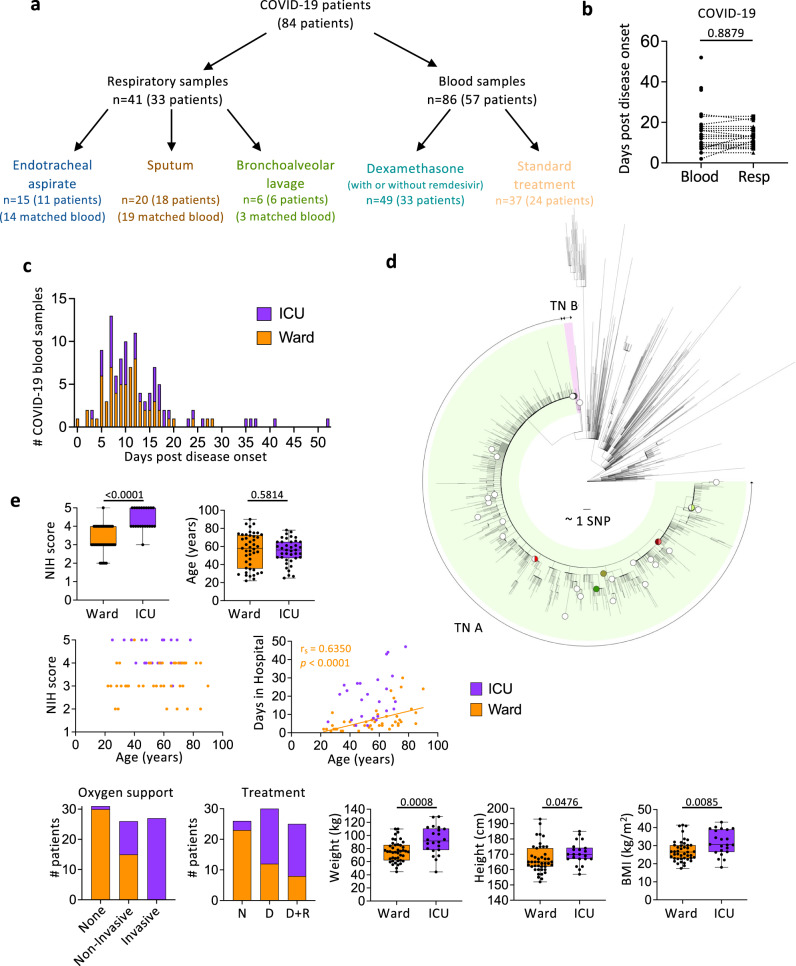
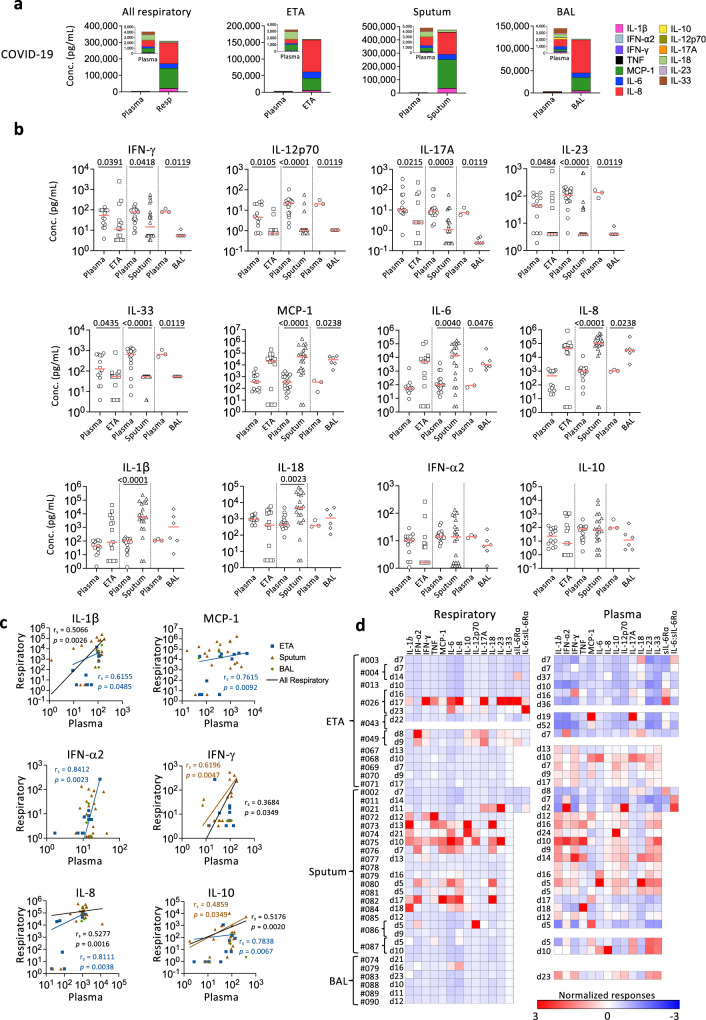
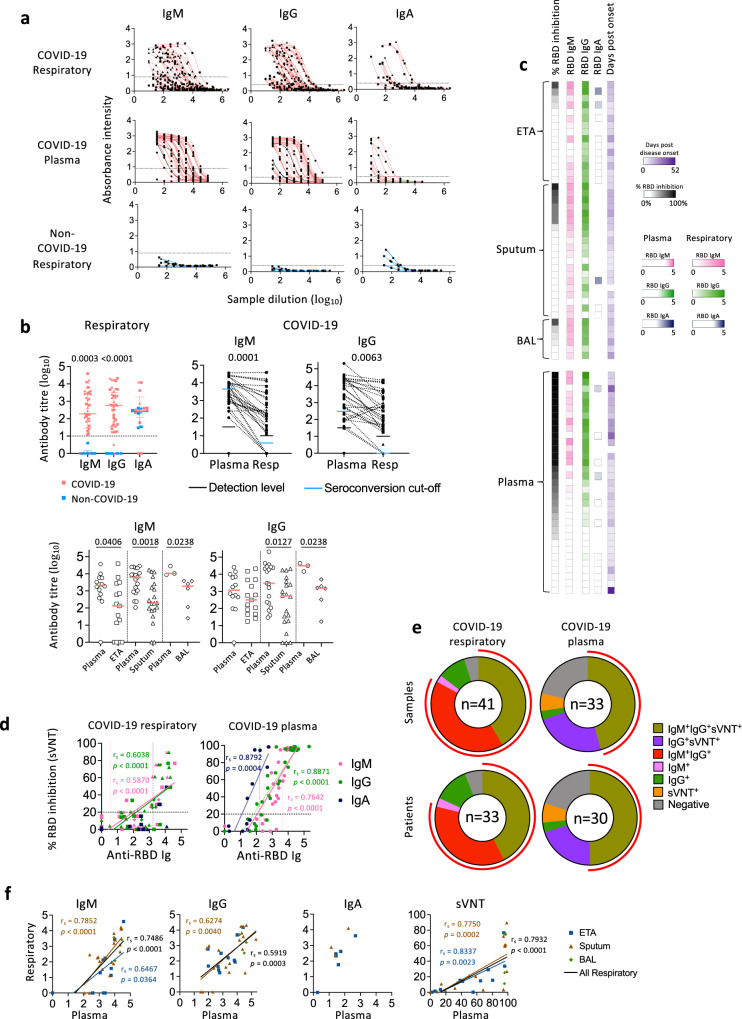
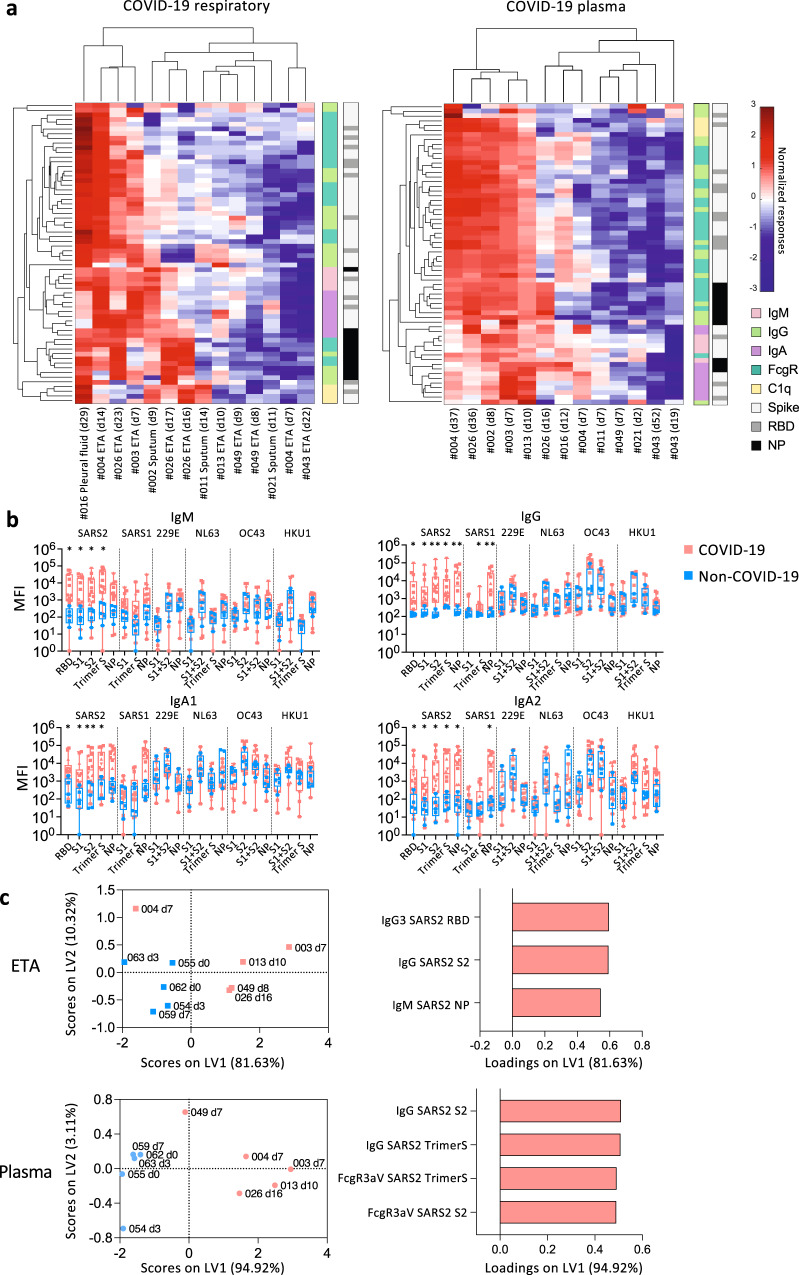
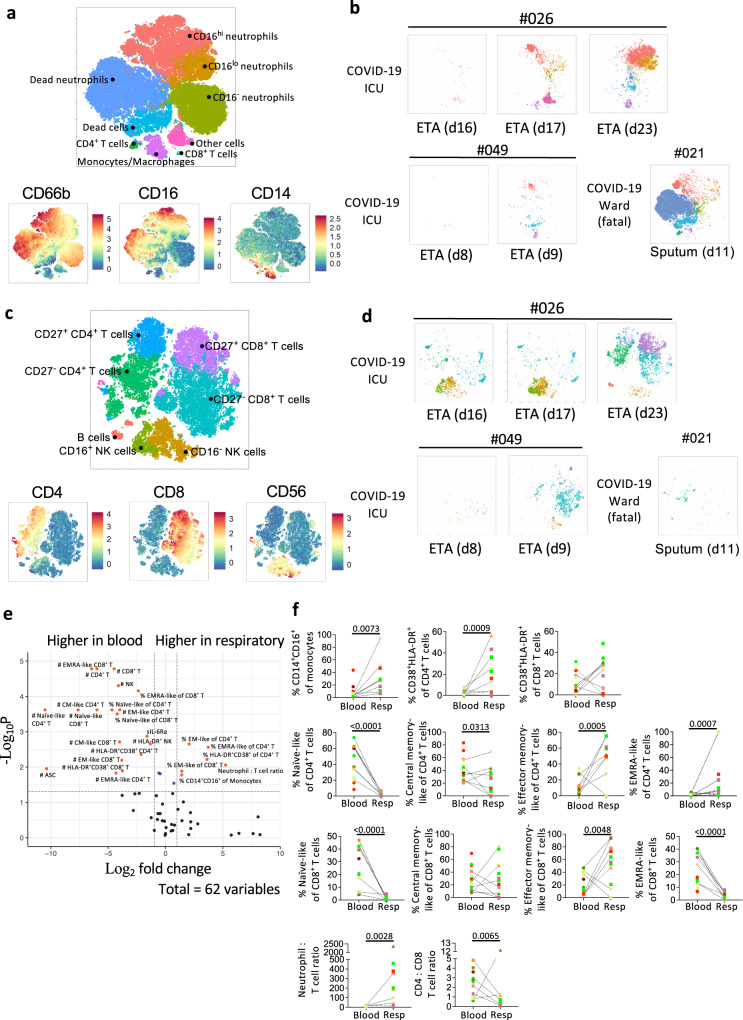
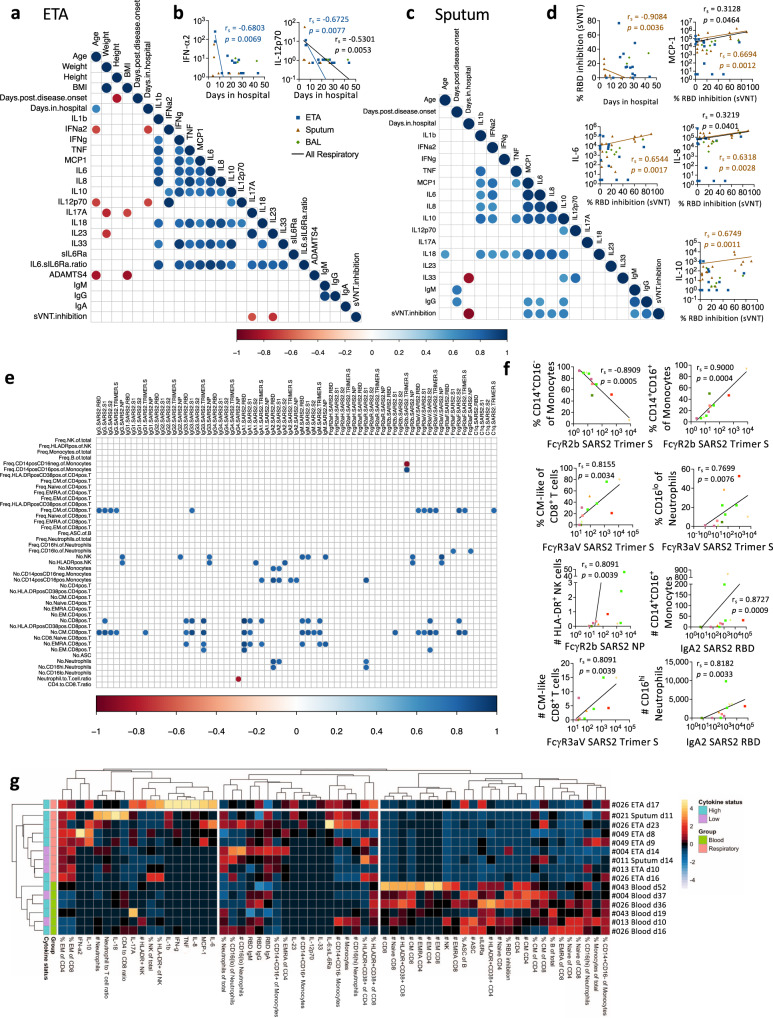
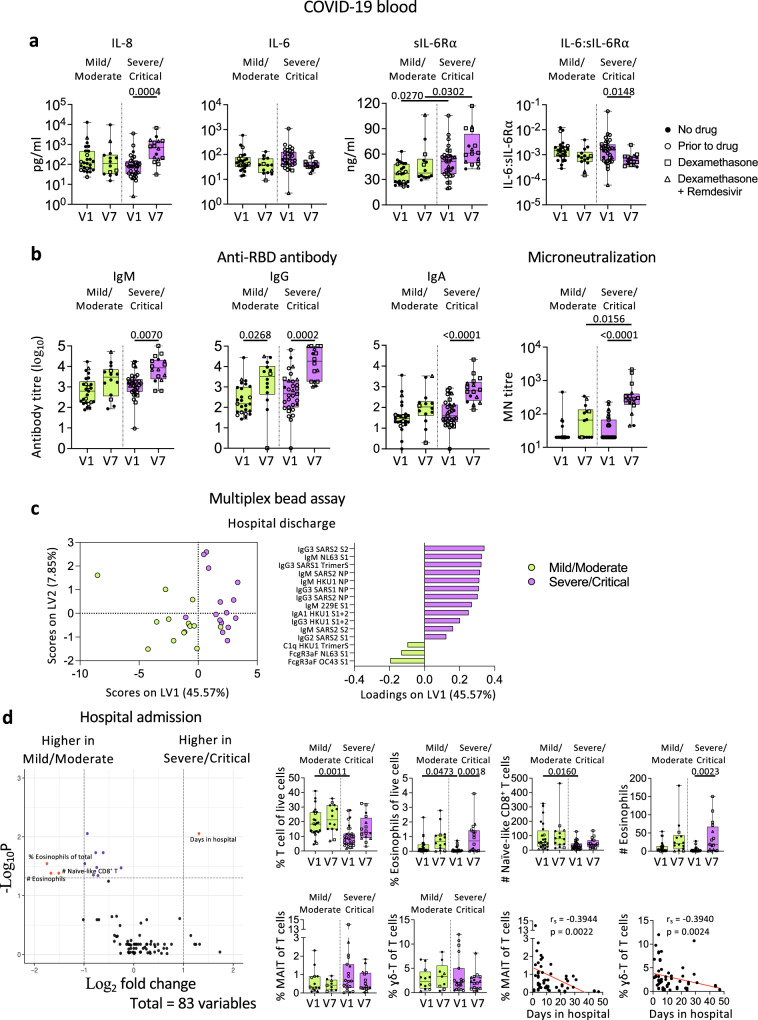
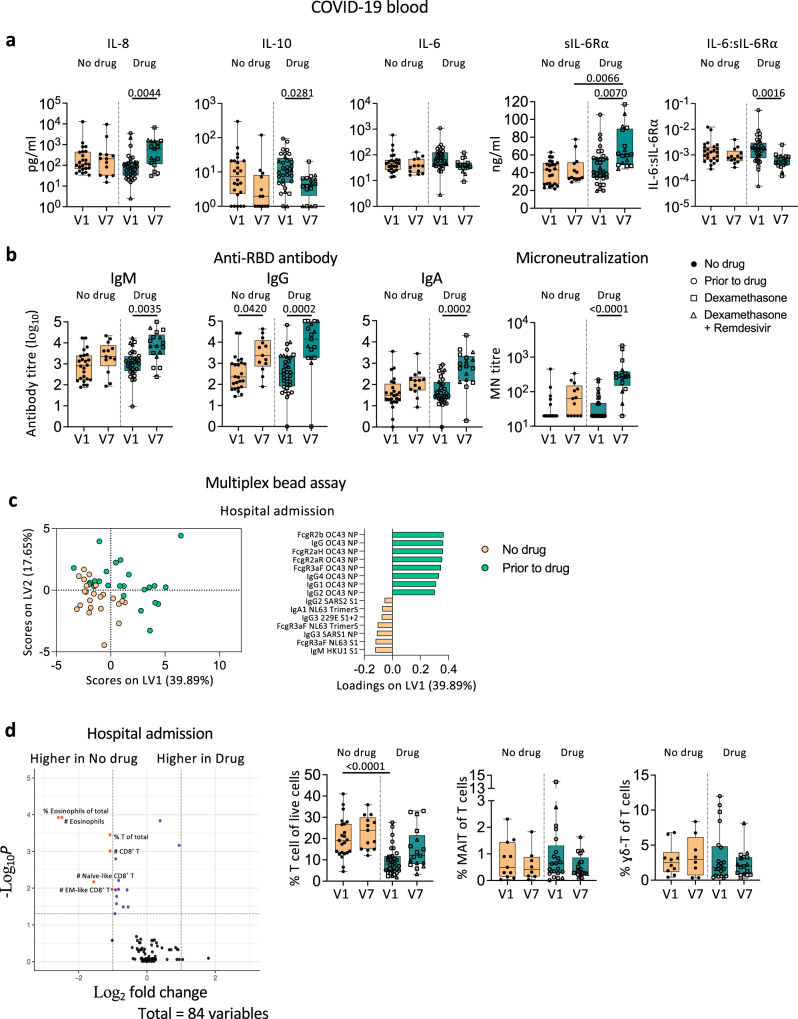
Respiratory tract infection with SARS-CoV-2 results in varying immunopathology underlying COVID-19. We examine cellular, humoral and cytokine responses covering 382 immune components in longitudinal blood and respiratory samples from hospitalized COVID-19 patients. SARS-CoV-2-specific IgM, IgG, IgA are detected in respiratory tract and blood, however, receptor-binding domain (RBD)-specific IgM and IgG seroconversion is enhanced in respiratory specimens. SARS-CoV-2 neutralization activity in respiratory samples correlates with RBD-specific IgM and IgG levels. Cytokines/chemokines vary between respiratory samples and plasma, indicating that inflammation should be assessed in respiratory specimens to understand immunopathology. IFN-α2 and IL-12p70 in endotracheal aspirate and neutralization in sputum negatively correlate with duration of hospital stay. Diverse immune subsets are detected in respiratory samples, dominated by neutrophils. Importantly, dexamethasone treatment does not affect humoral responses in blood of COVID-19 patients. Our study unveils differential immune responses between respiratory samples and blood, and shows how drug therapy affects immune responses during COVID-19.


Conflict of interest statement

The Icahn School of Medicine at Mount Sinai has filed patent applications relating to SARS-CoV-2 serological assays (U.S. Provisional Application Numbers: 62/994,252, 63/018,457, 63/020,503 and 63/024,436) and NDV-based SARS-CoV-2 vaccines (U.S. Provisional Application Number: 63/251,020) which list Florian Krammer as co-inventor. Fatima Amanat is also listed on the serological assay patent application as co-inventors. Patent applications were submitted by the Icahn School of Medicine at Mount Sinai. Mount Sinai has spun out a company, Kantaro, to market serological tests for SARS-CoV-2. Florian Krammer has consulted for Merck and Pfizer (before 2020), and is currently consulting for Pfizer, Third Rock Ventures, Seqirus and Avimex. The Krammer laboratory is also collaborating with Pfizer on animal models of SARS-CoV-2. Dale Godfrey is listed as co-inventor on patent applications relating to SARS-CoV-2 vaccines and lateral flow assay for neutralizing antibodies. Paul Thomas is on the SAB of Immunoscape and Cytoagents and has consulted for JNJ. Paul Thomas has received travel support and/or honoraria from Illumina and 10X Genomics and has patents related to TCR discovery and expression. All authors declare no other competing interests.

Figures

Fig. 1
Fig. 1. Demographics of the COVID-19 cohort.
a Number of patients recruited in the COVID-19 cohort and samples collected are shown. b Comparison between the time of respiratory sample (endotracheal tube aspirate (ETA), sputum, and bronchoalveolar lavage (BAL)) and paired blood sample collection are shown and were calculated using a two-sided Mann-Whitney test. nRespiratory = 40, nBlood = 33. c Collection time of COVID-19 blood samples. d Maximum likelihood phylogenetic tree of SARS-CoV-2 sequences from Victoria from 28 January 2020 to 28 October 2020 (including context sequences from the rest of Australia and New Zealand). Phylogenetic tree includes randomly subsampled sequences from transmission networks (TN) A and TN B in Victoria, with a total number of 10941 and 145 cases respectively. The outermost tip of each radial line represents a single sequence; the sum of each radial line between two tips represents the genetic distance between two sequences. Each radial stepwise progression represents approximately one single nucleotide polymorphism (SNP). Sequences from study patients (n = 40) are shown as open circles (patient with blood samples only) or solid-coloured circles (patients with blood and respiratory samples). Half-filled circles are used when samples are located close to each other. e Distribution of clinical data in ward and intensive care unit (ICU) COVID-19 patients. nWard = 45, nICU = 39. The patients received dexamethasone (D), dexamethasone with remdesivir (D + R) or neither (N). The bounds of the box plot indicate the 25th and 75th percentiles, the bar indicates medians, and the whiskers indicate minima and maxima. Statistical significance was determined with a two-sided Fisher’s exact test for the National Institutes of Health (NIH) score, and a two-sided Mann-Whitney test for age, weight, height, and body weight index (BMI). Correlation was determined with a two-tailed Spearman’s correlation. Source data are provided as a Source Data file.
Fig. 2
Fig. 2. Discordant levels of cytokines and chemokines in COVID-19 respiratory samples compared to paired plasma samples.
a Absolute concentrations of 13 cytokines and chemokines (IL-1β, IFN-α2, IFN-γ, TNF, MCP-1, IL-6, IL-8, IL-10, IL-12p70, IL-17A, IL-18, IL-23, and IL-33) in pooled respiratory and paired plasma samples. b Comparison of cytokine and chemokine levels between endotracheal tube aspirate (ETA), sputum or bronchoalveolar lavage (BAL) and paired plasma samples using a two-sided Mann-Whitney test. Bars indicate the median values. c Correlation of cytokine and chemokine levels between respiratory samples (ETA, sputum, and BAL) and paired plasma samples collected at the closest timepoint for each patient. Correlation was determined with a two-tailed Spearman’s correlation. nETA = 15, nETA matched plasma = 14, nSputum = 20, nSputum matched plasma = 19, nBAL = 6, nBAL matched plasma = 3. d Normalized levels of cytokines/chemokines for COVID-19 respiratory and plasma samples separately. Red color indicates higher cytokine/chemokine levels. Source data are provided as a Source Data file.
Fig. 3
Fig. 3. Higher anti-RBD IgM and IgG seroconversion rate in respiratory samples compared to paired plasma samples of COVID-19 patients.
a ELISA titration curves against the SARS-CoV-2 receptor-binding domain (RBD) for IgM, IgG, and IgA in COVID-19 respiratory and paired plasma samples and non-COVID-19 respiratory samples as negative controls. Dotted lines within each graph indicates the cut-off used to determine end-point titres. b End-point titres of SARS-CoV-2 RBD antibodies between top left panel: respiratory samples of COVID-19 and non-COVID-19 patients, top right panel: respiratory and paired plasma samples of COVID-19 patients, and bottom panel: endotracheal tube aspirate (ETA), sputum, or bronchoalveolar lavage (BAL) and paired plasma samples of COVID-19 patients. Top left panel: Bars indicate median with interquartile range. Dotted line indicates the detection level. nETA = 15, nSputum = 20, nBAL = 6, nNon-COVID-19 ETA = 5, nNon-COVID-19 sputum = 1. Top right panel: Dotted lines connect the most closely matched plasma and respiratory samples from each patient. Bottom panel: Bars indicate the median. Statistical significance was determined with a two-sided Mann-Whitney test. nETA = 15, nETA matched plasma = 14, nSputum = 20, nSputum matched plasma = 19, nBAL = 6, nBAL matched plasma = 3. c Heatmap of percentage (%) inhibition tested by surrogate virus neutralization test (sVNT), anti-RBD ELISA titres and days post disease onset. d Correlation between anti-RBD antibody titres and (%) sVNT inhibition. Correlation was determined with a two-tailed Spearman’s correlation. e Number of samples and patients with seroconverted anti-RBD IgM, IgG, IgA and positive % sVNT inhibition. Red curved lines surrounding the donut graphs indicate the samples/patients with seroconverted IgM and IgG. Earliest samples were used for each patient when determining seroconversion which was defined as average titre + 2×SD of non-COVID-19 respiratory samples. Positive % sVNT inhibition was defined as % sVNT inhibition ≥ 20%. f Correlation of anti-RBD ELISA titres and % sVNT inhibition between respiratory samples (ETA, sputum, and BAL) and paired plasma samples collected at the closest timepoint for each patient. Correlation was determined with a two-tailed Spearman’s correlation. nETA = 15, nETA matched plasma = 14, nSputum = 20, nSputum matched plasma = 19, nBAL = 6, nBAL matched plasma = 3. Source data are provided as a Source Data file.
Fig. 4
Fig. 4. Higher SARS-CoV-2-specific IgM and IgG in COVID-19 ETA than non-COVID-19 ETA.
a Heatmaps with unsupervised clustering of SARS-CoV-2-specific antibodies in COVID-19 respiratory (endotracheal tube aspirate (ETA), sputum, or pleural fluid) and plasma samples. b median fluorescence intensity of IgM, IgG, IgA1, and IgA2 antibodies against receptor binding domain (RBD), spike proteins (S), and nucleoprotein (NP) of SARS-CoV-2 (SARS2), SARS-CoV-1 (SARS1), and other human coronaviruses (229E, NL63, OC43, HKU1) between COVID-19 and non-COVID-19 respiratory samples. The bounds of the box plot indicate the 25th and 75th percentiles, the bar indicates medians, and the whiskers indicate minima and maxima. Statistical significance was determined with a two-sided Mann-Whitney test. The P values for IgM against SARS2 RBD, SARS2 S1, SARS2 S2 and SARS2 Trimer S are 0.0103, 0.0143, 0.0143, 0.0103, respectively. The P values for IgG against SARS2 RBD, SARS2 S1, SARS2 S2, SARS2 Trimer S, SARS2 NP, SARS1 Trimer S and SARS1 NP are 0.0150, 0.0258, 0.0033, 0.0194, 0.0050, 0.0194, 0.0050, respectively. The P values for IgA1 against SARS2 RBD, SARS2 S1, SARS2 S2, and SARS2 Trimer S are 0.0437, 0.0258, 0.0072, 0.0258, respectively. The P values for IgA2 against SARS2 RBD, SARS2 S1, SARS2 S2, SARS2 Trimer S, SARS2 NP, SARS1 NP are 0.0258, 0.0258, 0.0103, 0.0339, 0.0143, 0.0258, respectively. c Partial Least-Squares Discriminant Analysis (PLSDA) scores and loading plots of ETA and plasma from five COVID-19 and five non-COVID-19 patients with the smallest difference in days post disease onset between ETA and plasma samples. nCOVID-19 ETA = 10, nCOVID-19 Sputum = 3, nCOVID-19 pleural fluid = 1, nRespiratory matched COVID-19 plasma = 13, nNon-COVID-19 ETA = 5, nNon-COVID-19 sputum = 1. Source data are provided as a Source Data file.
Fig. 5
Fig. 5. Higher frequencies of activated immune cells and EM-like CD4+ and CD8+ T cells in COVID-19 respiratory compared to paired blood samples.
Flow Self-Organizing Map (FlowSOM) analyses of cellular content in the respiratory tract. ad Metacluster of cells and expression level of markers in the a myeloid antibody panel and c lymphocyte antibody panel. Multiple endotracheal tube aspirate (ETA) samples from intensive care unit (ICU) patients #026 and #049 as well as one sputum sample from a fatal patient #021 were shown as example (b, d). e Volcano plot showing fold difference of 62 immunological features between paired respiratory and blood samples. f Comparisons of cellular immune features between respiratory and paired blood samples. nRespiratory = 14, nRespiratory matched blood = 13. Statistical significance was determined with a two-sided Mann-Whitney test. Dotted lines connect the most closely matched blood and respiratory samples from each patient. Colours indicate each patient. Source data are provided as a Source Data file.
Fig. 6
Fig. 6. Levels of ETA IFN-a2 and IL-12p70 and sputum neutralizing activity negatively correlate with days of hospital stay.
ad Correlation matrix and correlation graphs between immune features in COVID-19 respiratory (endotracheal tube aspirate (ETA) or sputum) samples and clinical features. nETA = 15, nSputum = 20, nBAL = 6. ef Correlation matrix and graphs between multiplex and non-multiplex immune features in COVID-19 respiratory samples. nCOVID-19 ETA = 10, nCOVID-19 Sputum = 3, nCOVID-19 pleural fluid = 1. Correlation was determined with a two-tailed Spearman’s correlation and p values of the correlation matrix were adjusted with False Discovery Rate adjustment. g Heatmaps with unsupervised clustering of serological and cellular features in COVID-19 respiratory and blood samples. Source data are provided as a Source Data file.
Fig. 7
Fig. 7. COVID-19 patients with higher NIH scores display more robust humoral immune responses towards SARS-CoV-2 in blood.
a Levels of cytokines, soluble IL-6 receptor α (sIL-6Rα), and IL-6:sIL-6Rα ratio, b anti-RBD IgM, IgG, and IgA titres, microneutralization titres and c Partial Least-Squares Discriminant Analysis (PLSDA) scores and loadings plot of antibodies against human coronavirus between mild/moderate and severe/critical COVID-19 patients. d Volcano plot showing fold difference of 83 immunological features in blood samples between mild/moderate and severe/critical COVID-19 patients, and comparisons of cellular subset frequencies and correlation with days stayed in hospital. nMild-Moderate V1 = 25, nMild-Moderate V7 = 14, nSevere-Critical V1 = 31, nSevere-Critical V7 = 16. The bounds of the box plot indicate the 25th and 75th percentiles, the bar indicates medians, and the whiskers indicate minima and maxima. Statistical significance was determined with a two-sided Kruskal-Wallis test followed by Dunn’s multiple comparisons test. Partial Least-Squares Discriminant Analysis was performed for antibodies measured with multiplex bead array assay. Volcano plots were created using a two-sided Wilcoxon rank-sum test and statistics were corrected with FDR adjustment. Correlation was determined with Spearman’s correlation. V1, hospital admission; V7, hospital discharge. Source data are provided as a Source Data file.
Fig. 8
Fig. 8. Dexamethasone treatment does not alter humoral immune responses towards SARS-CoV-2 in COVID-19 patients in blood.
a Levels of cytokines, soluble IL-6 receptor α (sIL-6Rα), and IL-6:sIL-6Rα ratio; b anti-RBD IgM, IgG, and IgA titres, microneutralization titres; c Partial Least-Squares Discriminant Analysis (PLSDA) scores and loadings plot of antibodies against human coronaviruses; d cellular immune subset frequencies between COVID-19 patients with or without dexamethasone treatment (with/without remdesivir). nNo drug V1 = 24, nNo drug V7 = 13, nDrug V1 = 32, nDrug V7 = 17. The bounds of the box plot indicate the 25th and 75th percentiles, the bar indicates medians, and the whiskers indicate minima and maxima. Statistical significance was determined with a two-sided Kruskal-Wallis test followed by Dunn’s multiple comparisons test. Partial Least-Squares Discriminant Analysis was performed for antibodies measured with multiplex bead array assay. Volcano plots were created using a two-sided Wilcoxon rank-sum test and statistics were corrected with FDR adjustment. V1, hospital admission; V7, hospital discharge. Source data are provided as a Source Data file.

Update of

Similar articles

Cited by

References

    1. Gallo Marin B, et al. Predictors of COVID-19 severity: A literature review. Rev. Med. Virol. 2021;31:e2146. doi: 10.1002/rmv.2146. - DOI - PMC - PubMed
    1. Baden LR, et al. Efficacy and Safety of the mRNA-1273 SARS-CoV-2 Vaccine. N. Engl. J. Med. 2020;384:403–416. doi: 10.1056/NEJMoa2035389. - DOI - PMC - PubMed
    1. Xia S, et al. Safety and immunogenicity of an inactivated SARS-CoV-2 vaccine, BBIBP-CorV: a randomised, double-blind, placebo-controlled, phase 1/2 trial. Lancet Infect. Dis. 2021;21:39–51. doi: 10.1016/S1473-3099(20)30831-8. - DOI - PMC - PubMed
    1. Keech C, et al. Phase 1–2 Trial of a SARS-CoV-2 Recombinant Spike Protein Nanoparticle Vaccine. N. Engl. J. Med. 2020;383:2320–2332. doi: 10.1056/NEJMoa2026920. - DOI - PMC - PubMed
    1. Rana MA, et al. Comparison of Efficacy of Dexamethasone and Methylprednisolone in Improving PaO2/FiO2 Ratio Among COVID-19 Patients. Cureus. 2020;12:e10918–e10918. - PMC - PubMed

Publication types