. 2022 May 19;13(1):2781.
doi: 10.1038/s41467-022-30067-3.

RNA supply drives physiological granule assembly in neurons

Affiliations

RNA supply drives physiological granule assembly in neurons

Karl E Bauer et al. Nat Commun. .

Abstract

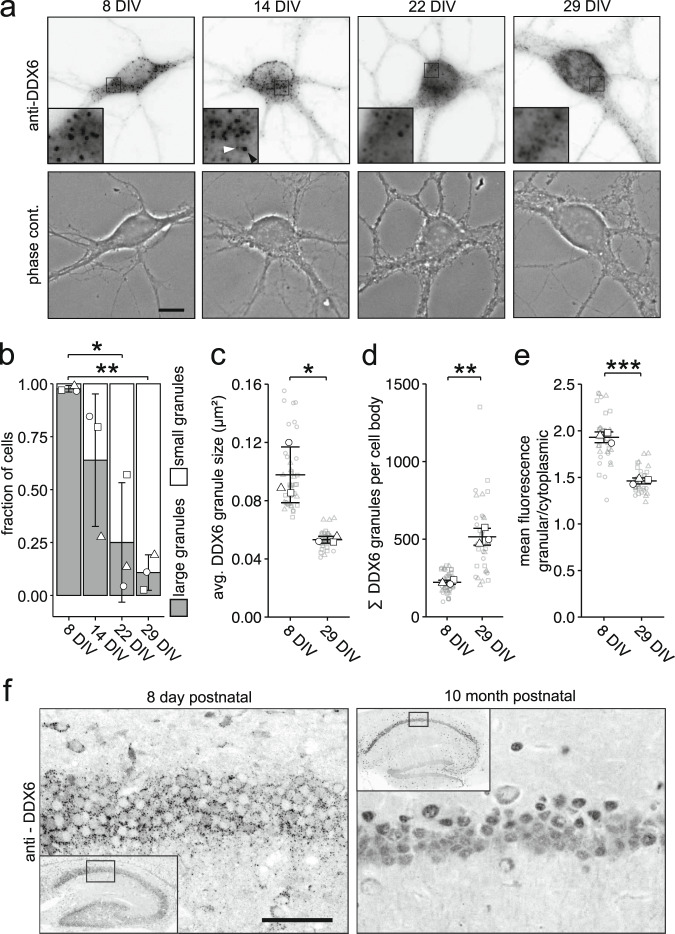
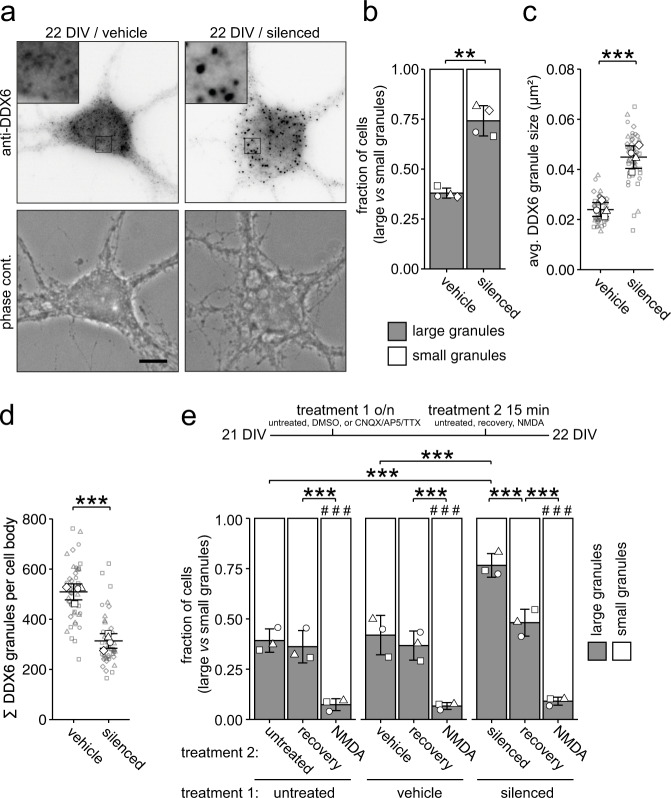
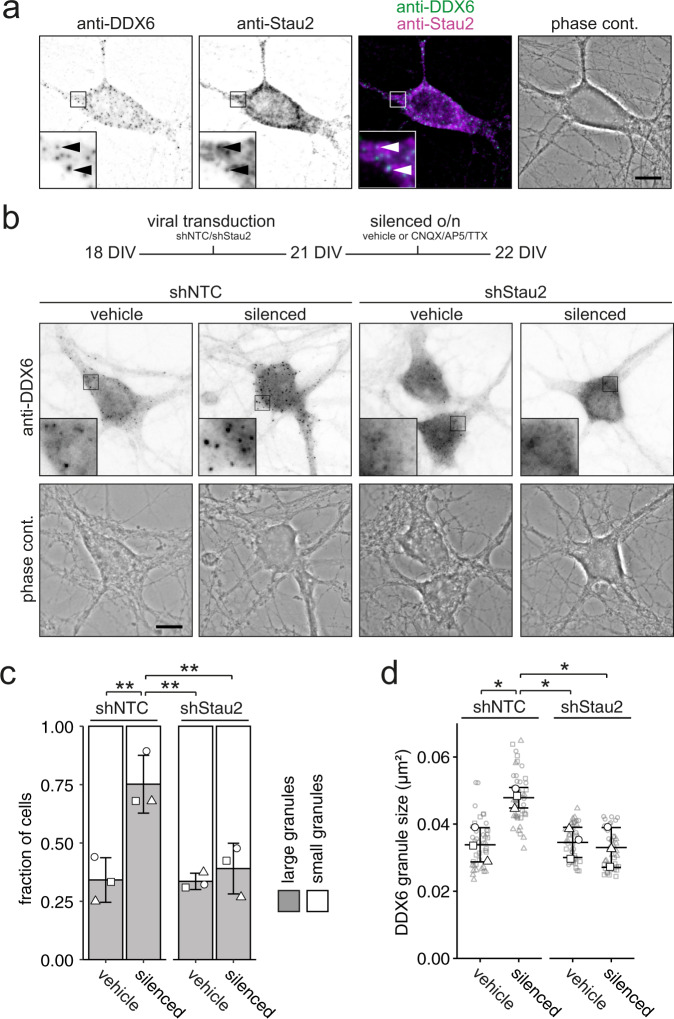
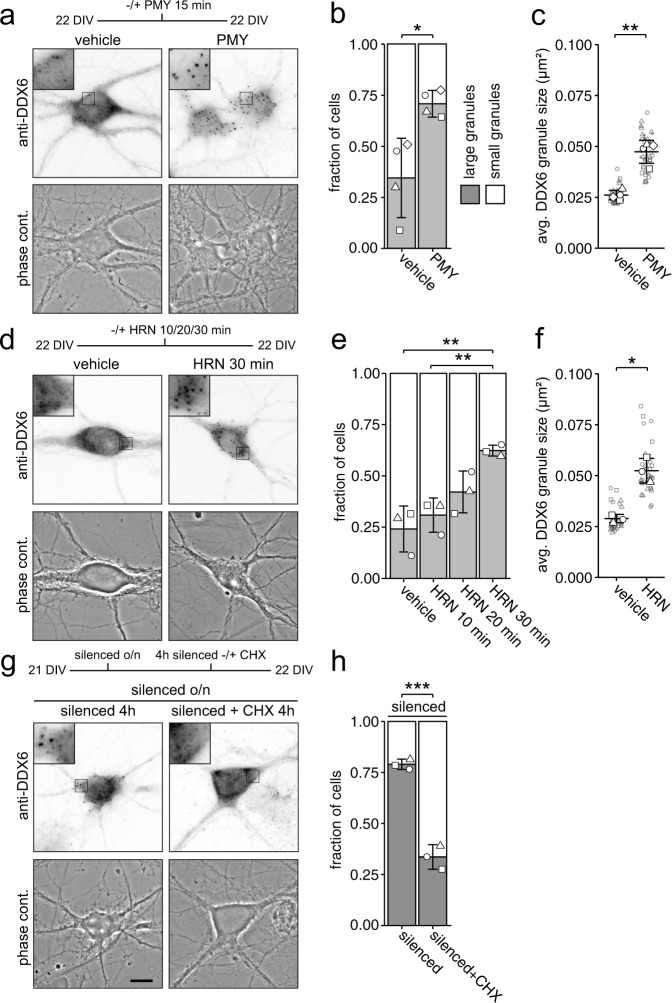
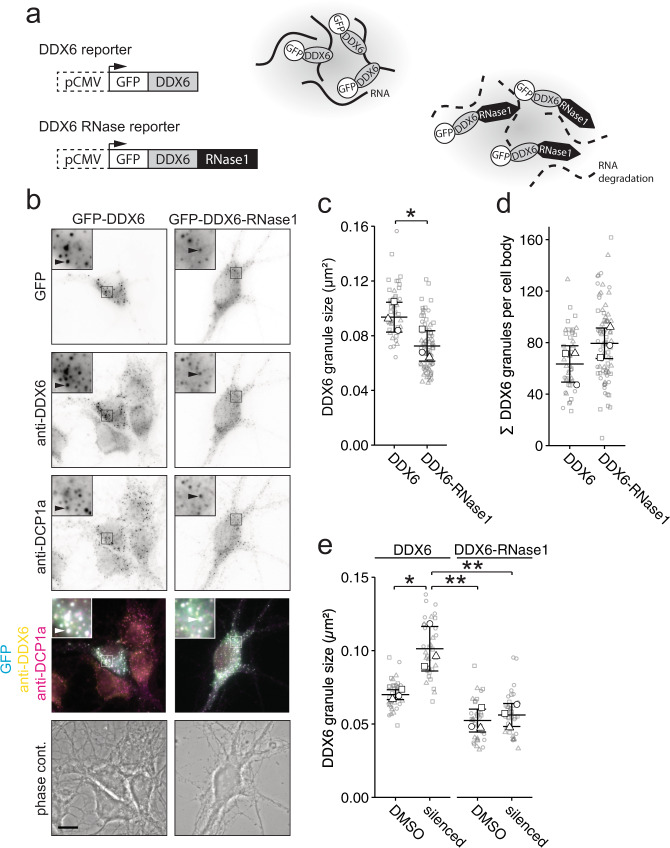
Membraneless cytoplasmic condensates of mRNAs and proteins, known as RNA granules, play pivotal roles in the regulation of mRNA fate. Their maintenance fine-tunes time and location of protein expression, affecting many cellular processes, which require complex protein distribution. Here, we report that RNA granules-monitored by DEAD-Box helicase 6 (DDX6)-disassemble during neuronal maturation both in cell culture and in vivo. This process requires neuronal function, as synaptic inhibition results in reversible granule assembly. Importantly, granule assembly is dependent on the RNA-binding protein Staufen2, known for its role in RNA localization. Altering the levels of free cytoplasmic mRNA reveals that RNA availability facilitates DDX6 granule formation. Specifically depleting RNA from DDX6 granules confirms RNA as an important driver of granule formation. Moreover, RNA is required for DDX6 granule assembly upon synaptic inhibition. Together, this data demonstrates how RNA supply favors RNA granule assembly, which not only impacts subcellular RNA localization but also translation-dependent synaptic plasticity, learning, and memory.


Conflict of interest statement

The authors declare no competing interests.

Figures

Fig. 1
Fig. 1. Cytoplasmic DDX6 granules disassemble during neuronal maturation in cell culture and in vivo.
a Representative examples of DDX6 immunostaining and phase contrast of 8, 14, 22, and 29 days in vitro (DIV) hippocampal neurons in culture. Boxed regions in images are displayed as magnified insets. White arrowhead indicates representative small granule, black arrowhead indicates representative large granule. Scale bar 10 µm. b Bar plot displaying quantification of cell population by fraction of cells containing either large or small DDX6 granules as exemplified in a, at 8, 14, 22 and 29 DIV, respectively. Data represents mean ± standard deviation of three independent neuronal cultures. Distinct dot symbols indicate biological replicates. At least 100 cells/condition/experiment were quantified. Asterisks represent p-values obtained by Tukey’s test post-hoc to one-way ANOVA analysis (*p < 0.05, **p < 0.01). F3,8 = 0.0044. c, d, e Dot plots displaying average DDX6 granule size (c), total DDX6 granule number (d) and granular to cytoplasmic DDX6 fluorescence ratio (e) of individual cell bodies in 8 and 29 DIV hippocampal neurons in culture. Small gray symbols represent single cells while larger white symbols indicate the average of each replicate. Horizontal line and error bars represent mean of replicates and standard deviation (n = 3 biologically independent experiments). Asterisks represent p-values obtained by two-sided Student’s t-test (*p < 0.05, **p < 0.01, ***p < 0.001). p = 0.0452 (c); p = 0.0081 (d). f DDX6 immunostaining on sagittal brain tissue slices displaying the hippocampus of 8 day and 10 month postnatal mice. Boxed regions in overviews show location of magnified region. Scale bar 50 μm. This experiment was repeated independently 3 times with similar results.
Fig. 2
Fig. 2. Chemical inhibition of neuronal activity selectively regulates the assembly of cytoplasmic DDX6 granules in mature hippocampal neurons.
a Representative examples of DDX6 immunostainings and phase contrast pictures of 22 DIV hippocampal neurons in culture under vehicle (DMSO) treated or silenced (100 µM CNQX, 50 µM AP5, 1 µM TTX) conditions. Boxed regions in images are displayed as magnified insets. Scale bar 10 µm. b, e Bar plots displaying quantification of cell population by fraction of cells containing either large or small DDX6 granules as exemplified in a under untreated, vehicle treated, or silenced conditions (b, e), followed by recovery or NMDA treatment (e). Experimental outline is presented in e. Data represents mean ± standard deviation of three independent neuronal cultures. Distinct dot symbols indicate biological replicates. At least 100 cells/condition/experiment were quantified. c, d Dot plots displaying average DDX6 granule size (c) and DDX6 granule number (d) of individual cell bodies under vehicle treated (DMSO) or silenced conditions. Small gray symbols represent single cells while larger white symbols indicate the average of each replicate. Horizontal line and error bars represent mean of replicates and standard deviation (n = 4 biologically independent experiments). Asterisks represent p-values obtained by two-sided Student’s t-test (bd) or Tukey’s test post-hoc to two-way ANOVA analysis (e) (**p < 0.01). Hashtags represent p-values obtained by Tukey’s test compared to untreated conditions (e) (###p < 0.001). p = 0.0012 (b), p = 0.00053 (c), p = 0.00010 (d), F2,18 = 1.59e-05, treatment 1, F2,18 = 2.38e-11, treatment 2 (e).
Fig. 3
Fig. 3. Stau2 depletion inhibits DDX6 granule assembly upon neuronal inhibition.
a Representative example of DDX6 and Stau2 immunostaining, merge and phase contrast pictures of a 22 DIV hippocampal neuron. Arrowheads indicate instances of co-localization. b Experimental outline and representative examples of DDX6 immunostainings and phase contrast pictures of shNTC and shStau2 transduced 22 DIV hippocampal neurons in culture either under vehicle (DMSO) treated or silenced (100 µM CNQX, 50 µM AP5, 1 µM TTX) conditions. Boxed regions in images are displayed as magnified insets. Scale bars 10 µm. c Bar plot displaying quantification of cell population by fraction of cells containing either large or small DDX6 granules as exemplified in b. Distinct dot symbols indicate biological replicates. At least 100 cells/condition/experiment were quantified. d Dot plot displaying average DDX6 granule size of individual cell bodies. Small gray symbols represent single cells while larger white symbols indicate the average of each replicate. Data represents mean ± standard deviation of three independent neuronal cultures. Asterisks represent p-values obtained by Tukey’s test post-hoc to two-way ANOVA analysis (*p < 0.05, **p < 0.01). F1,8 = 0.00316, Stau2 depletion (c); F1,8 = 0.0110, neuronal inhibition (c), F1,8 = 0.0336, Stau2 depletion (d); F1,8 = 0.0530, neuronal inhibition (d).
Fig. 4
Fig. 4. DDX6 granule assembly is facilitated by the availability of cytoplasmic non-translating mRNAs.
a, d, g Experimental outline and representative examples of DDX6 immunostainings and phase contrast pictures of 22 DIV hippocampal neurons in culture under 15 min vehicle or puromycin (25 µM) treated conditions (a), under 30 min vehicle (DMSO) or harringtonine (2 µg/mL) treated conditions (d), and under silenced (100 µM CNQX, 50 µM AP5, 1 µM TTX) conditions, followed by 4 h additional silencing or silencing + CHX (g). Abbreviations: PMY = puromycin, HRN = harringtonine, CHX = cycloheximide. Boxed regions in images are displayed as magnified insets. Scale bars 10 µm. b, e, h Bar plots displaying quantification of cell population by fraction of cells containing either large or small DDX6 granules as exemplified in (a), (d) and (g). Distinct dot symbols indicate biological replicates. At least 100 cells/condition/experiment were quantified. n = 4 (b) and n = 3 (e, h) biologically independent experiments). c, f Dot plots displaying average DDX6 granule size of individual cell bodies. Small gray symbols represent single cells while larger white symbols indicate the average of each replicate. Data represents mean of three or four independent neuronal cultures. n = 4 (c) and n = 3 (f) biologically independent experiments). Asterisks represent p-values obtained by two-sided Student’s t-test (b, c, f, h) or Tukey’s test post-hoc to one-way ANOVA analysis (e) (*p < 0.05, **p < 0.01, ***p < 0.001). p = 0.0276 (b), p = 0.0022 (c), F3,8 = 0.00333 (e), p = 0.0096 (f), p = 0.00084 (h).
Fig. 5
Fig. 5. RNA degradation in DDX6 granules results in disassembly.
a Scheme of GFP-DDX6 and GFP-DDX6-RNase1 expression cassettes (right) and their use in an RNA-dependent assembly assay (left). b Representative examples of GFP fluorescence, anti-DDX6 and anti-DCP1a immunofluorescence, merge, and phase contrast pictures of 14 DIV hippocampal neurons in culture, transfected with either GFP-DDX6 or GFP-DDX6-RNase1 reporters. Boxed regions in images are displayed as magnified insets. Scale bars 10 µm. Arrowheads indicate overlap. c, d, e Dot plots displaying average DDX6 granule size (c, e) or DDX6 granule number (d) of individual cell bodies as exemplified in b, transfected with either GFP-DDX6 or GFP-DDX6-RNase1 reporters (c, d) and under vehicle treated or silenced conditions (e). Distinct dot symbols indicate biological replicates. Small gray symbols represent single cells while larger white symbols indicate the average of each replicate. Horizontal line and error bars represent mean of replicates and standard deviation (n = 3 biologically independent experiments). Asterisks represent p-values obtained by two-sided Student’s t-test (c, d) or Tukey’s test post-hoc to one-way ANOVA analysis (e) (*p < 0.05, **p < 0.01). p = 0.0306 (c), F1,8 = 0.00045, GFP reporter; F1,8 = 0.0128, neuronal inhibition (e).

Similar articles

Cited by

References

    1. Abildgaard MH, Brynjolfsdottir SH, Frankel LB. The autophagy-RNA interplay: degradation and beyond. Trends Biochem Sci. 2020;45:845–857. doi: 10.1016/j.tibs.2020.07.007. - DOI - PubMed
    1. Glisovic T, Bachorik JL, Yong J, Dreyfuss G. RNA-binding proteins and post-transcriptional gene regulation. FEBS Lett. 2008;582:1977–1986. doi: 10.1016/j.febslet.2008.03.004. - DOI - PMC - PubMed
    1. Halbeisen RE, Galgano A, Scherrer T, Gerber AP. Post-transcriptional gene regulation: from genome-wide studies to principles. Cell Mol. Life Sci. 2008;65:798–813. doi: 10.1007/s00018-007-7447-6. - DOI - PMC - PubMed
    1. Weyn-Vanhentenryck SM, et al. Precise temporal regulation of alternative splicing during neural development. Nat. Commun. 2018;9:2189. doi: 10.1038/s41467-018-04559-0. - DOI - PMC - PubMed
    1. Raj B, Blencowe BJ. Alternative splicing in the mammalian nervous system: recent insights into mechanisms and functional roles. Neuron. 2015;87:14–27. doi: 10.1016/j.neuron.2015.05.004. - DOI - PubMed

Publication types

MeSH terms