

Exciton transport in molecular organic semiconductors boosted by transient quantum delocalization
- PMID: 35589694
- PMCID: PMC9120088
- DOI: 10.1038/s41467-022-30308-5
Exciton transport in molecular organic semiconductors boosted by transient quantum delocalization
Erratum in
-
Publisher Correction: Exciton transport in molecular organic semiconductors boosted by transient quantum delocalization.Nat Commun. 2024 Apr 11;15(1):3135. doi: 10.1038/s41467-024-47500-4. Nat Commun. 2024. PMID: 38605147 Free PMC article. No abstract available.
Abstract
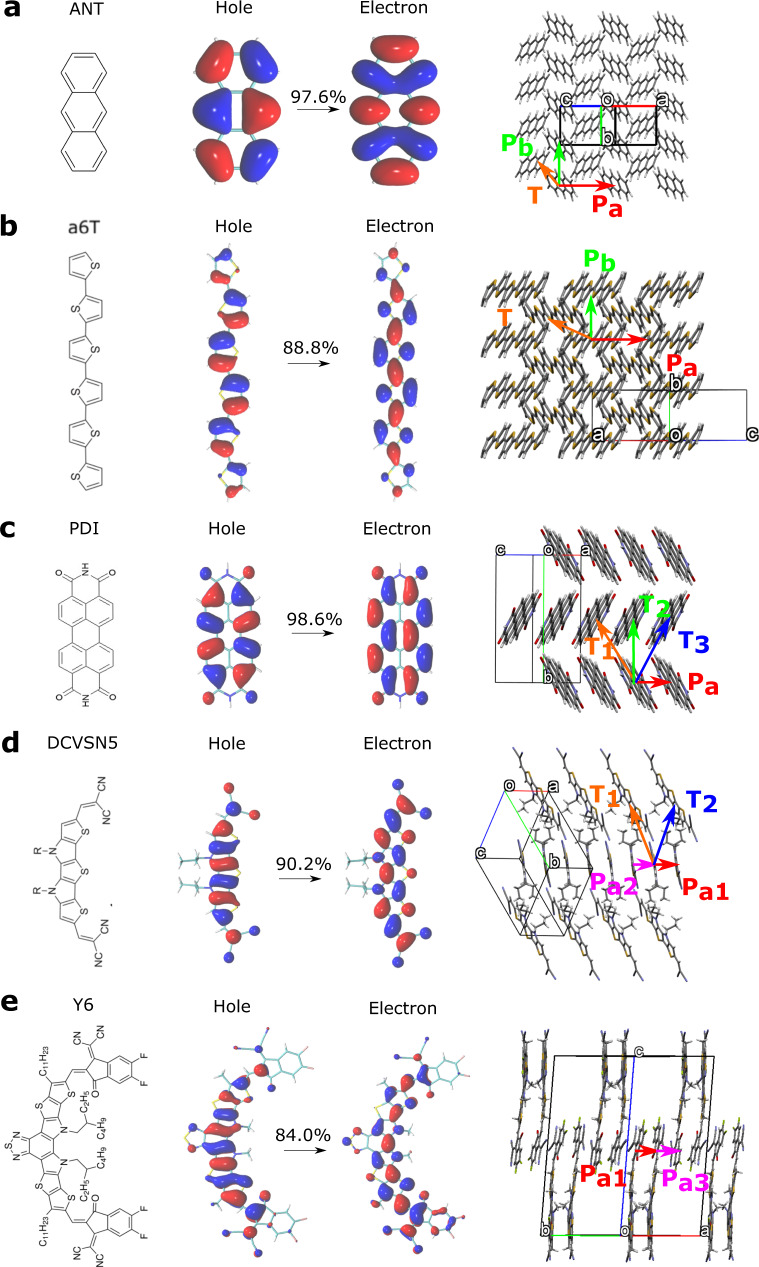
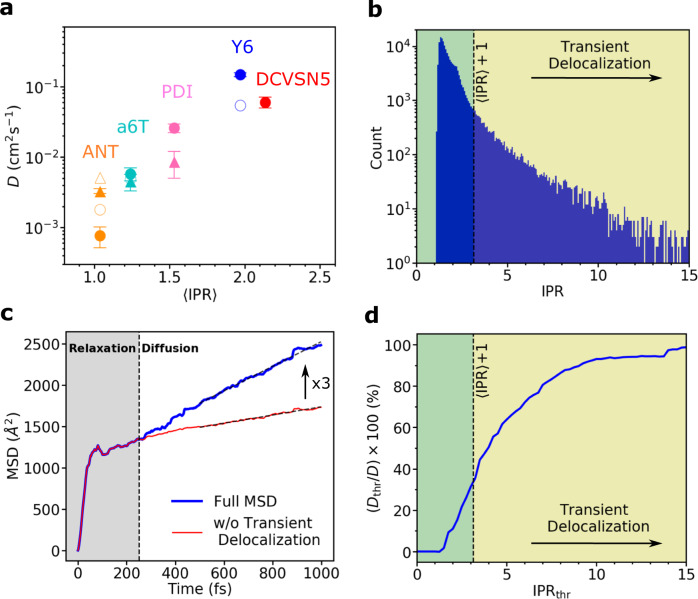
Designing molecular materials with very large exciton diffusion lengths would remove some of the intrinsic limitations of present-day organic optoelectronic devices. Yet, the nature of excitons in these materials is still not sufficiently well understood. Here we present Frenkel exciton surface hopping, an efficient method to propagate excitons through truly nano-scale materials by solving the time-dependent Schrödinger equation coupled to nuclear motion. We find a clear correlation between diffusion constant and quantum delocalization of the exciton. In materials featuring some of the highest diffusion lengths to date, e.g. the non-fullerene acceptor Y6, the exciton propagates via a transient delocalization mechanism, reminiscent to what was recently proposed for charge transport. Yet, the extent of delocalization is rather modest, even in Y6, and found to be limited by the relatively large exciton reorganization energy. On this basis we chart out a path for rationally improving exciton transport in organic optoelectronic materials.
© 2022. The Author(s).
Conflict of interest statement
The authors declare no competing interests.
Figures
Similar articles
-
Exciton Transport in the Nonfullerene Acceptor O-IDTBR from Nonadiabatic Molecular Dynamics.J Chem Theory Comput. 2024 Jul 23;20(14):6241-6252. doi: 10.1021/acs.jctc.4c00605. Epub 2024 Jul 5. J Chem Theory Comput. 2024. PMID: 38967252 Free PMC article.
-
Mechanism of Delocalization-Enhanced Exciton Transport in Disordered Organic Semiconductors.J Phys Chem Lett. 2023 Mar 2;14(8):2155-2162. doi: 10.1021/acs.jpclett.2c03886. Epub 2023 Feb 20. J Phys Chem Lett. 2023. PMID: 36802583
-
Efficient Near-Infrared Luminescence of Self-Assembled Platinum(II) Complexes: From Fundamentals to Applications.Acc Chem Res. 2023 Mar 21;56(6):689-699. doi: 10.1021/acs.accounts.2c00827. Epub 2023 Mar 7. Acc Chem Res. 2023. PMID: 36882976
-
Charge Transport in Organic Semiconductors: The Perspective from Nonadiabatic Molecular Dynamics.Acc Chem Res. 2022 Mar 15;55(6):819-830. doi: 10.1021/acs.accounts.1c00675. Epub 2022 Feb 23. Acc Chem Res. 2022. PMID: 35196456 Free PMC article. Review.
-
A New Frontier in Exciton Transport: Transient Delocalization.J Phys Chem Lett. 2022 Jul 28;13(29):6820-6830. doi: 10.1021/acs.jpclett.2c01133. Epub 2022 Jul 20. J Phys Chem Lett. 2022. PMID: 35857739 Free PMC article. Review.
Cited by
-
Spin relaxation of electron and hole polarons in ambipolar conjugated polymers.Nat Commun. 2024 Jan 4;15(1):288. doi: 10.1038/s41467-023-43505-7. Nat Commun. 2024. PMID: 38177094 Free PMC article.
-
Exciton Transport in the Nonfullerene Acceptor O-IDTBR from Nonadiabatic Molecular Dynamics.J Chem Theory Comput. 2024 Jul 23;20(14):6241-6252. doi: 10.1021/acs.jctc.4c00605. Epub 2024 Jul 5. J Chem Theory Comput. 2024. PMID: 38967252 Free PMC article.
-
Identification via Virtual Screening of Emissive Molecules with a Small Exciton-Vibration Coupling for High Color Purity and Potential Large Exciton Delocalization.J Phys Chem Lett. 2023 May 4;14(17):4119-4126. doi: 10.1021/acs.jpclett.3c00749. Epub 2023 Apr 27. J Phys Chem Lett. 2023. PMID: 37129191 Free PMC article.
-
Size-Transferable Prediction of Excited State Properties for Molecular Assemblies with a Machine Learning Exciton Model.J Phys Chem Lett. 2025 Mar 13;16(10):2541-2552. doi: 10.1021/acs.jpclett.4c03548. Epub 2025 Mar 3. J Phys Chem Lett. 2025. PMID: 40029179 Free PMC article.
-
Exciton Dissociation in a Model Organic Interface: Excitonic State-Based Surface Hopping versus Multiconfigurational Time-Dependent Hartree.J Phys Chem Lett. 2022 Aug 11;13(31):7105-7112. doi: 10.1021/acs.jpclett.2c01928. Epub 2022 Jul 28. J Phys Chem Lett. 2022. PMID: 35900333 Free PMC article.
References
-
- Frenkel J. On the transformation of light into heat in solids. ii. Phys. Rev. 1931;37:1276. doi: 10.1103/PhysRev.37.1276. - DOI
-
- Pope, M. & Swenberg, C. E. Electronic Processes in Organic Crystals and Polymers (Oxford Univ. Press, 1999).
-
- Azzouzi M, Kirchartz T, Nelson J. Factors controlling open-circuit voltage losses in organic solar cells. Trends Chem. 2019;1:49–62. doi: 10.1016/j.trechm.2019.01.010. - DOI
-
- Mikhnenko OV, Blom PWM, Nguyen T-Q. Exciton diffusion in organic semiconductors. Energy Environ. Sci. 2015;8:1867–1888. doi: 10.1039/C5EE00925A. - DOI
Grants and funding
LinkOut - more resources
Full Text Sources
