. 2022 May 19;13(1):2769.
doi: 10.1038/s41467-022-30236-4.

Mitochondrial calcium uniporter stabilization preserves energetic homeostasis during Complex I impairment

Affiliations

Mitochondrial calcium uniporter stabilization preserves energetic homeostasis during Complex I impairment

Enrique Balderas et al. Nat Commun. .

Erratum in

Abstract

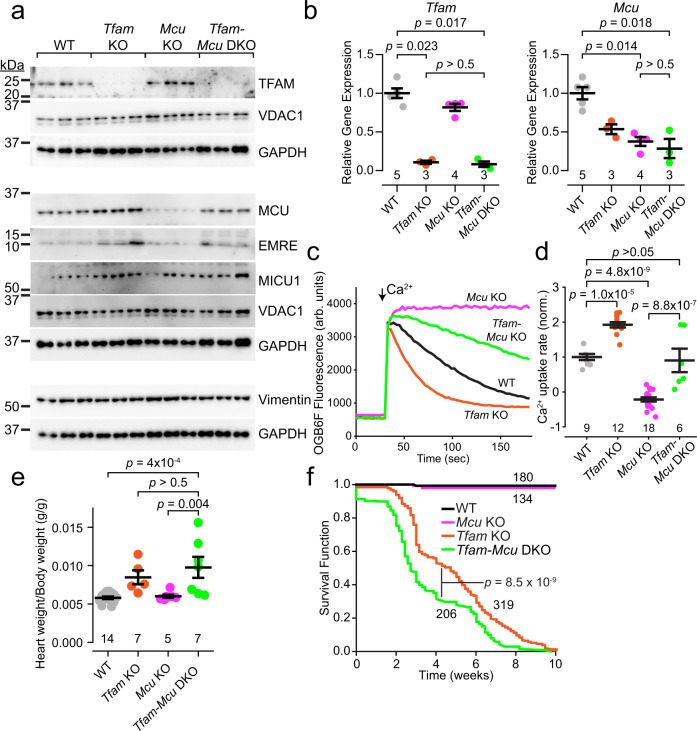
Calcium entering mitochondria potently stimulates ATP synthesis. Increases in calcium preserve energy synthesis in cardiomyopathies caused by mitochondrial dysfunction, and occur due to enhanced activity of the mitochondrial calcium uniporter channel. The signaling mechanism that mediates this compensatory increase remains unknown. Here, we find that increases in the uniporter are due to impairment in Complex I of the electron transport chain. In normal physiology, Complex I promotes uniporter degradation via an interaction with the uniporter pore-forming subunit, a process we term Complex I-induced protein turnover. When Complex I dysfunction ensues, contact with the uniporter is inhibited, preventing degradation, and leading to a build-up in functional channels. Preventing uniporter activity leads to early demise in Complex I-deficient animals. Conversely, enhancing uniporter stability rescues survival and function in Complex I deficiency. Taken together, our data identify a fundamental pathway producing compensatory increases in calcium influx during Complex I impairment.


Conflict of interest statement

The authors declare no competing interests.

Figures

Fig. 1
Fig. 1. Complex I dysfunction increases IMiCa.
a Top, voltage ramp protocol. Bottom, Exemplar IMiCa traces are larger after chronic 1 µM rotenone treatment in HEK293T cells. b Summary rotenone dose-response curve. c Immunoblotting reveals increased uniporter subunit proteins after Complex I impairment in HEK293T, NDUFB10KO, FOXRED1KO, and patient-derived IPSCs (NDUFB10−/C107S) compared to controls. VDAC1 and GAPDH are loading controls. Here and throughout, representative blots from at least 3 replicates are shown. kDa, kilodaltons. dg Each panel contains the summary (left) and exemplar (right) for peak inward IMiCa in FOXRED1KO (d), NDUFB10KO (e), patient-derived IPSCs (f), and Drosophila NDUFB10RNAi (g), compared to controls (black). Each point in the summary graphs in panels 1b, 1d-h represents the current density measured at −140 mV for an individual mitoplast (see arrowheads in (a)). h IMiCa is increased in cells expressing MCU-Flag after Complex I impairment. In summary graphs, data are presented as mean values ± SEM. N values are listed in the summary graph here and throughout. Statistics: (a) 1-way ANOVA followed by Bonferroni corrected means comparisons; (f) Kruskal–Wallis followed by Dunn’s test with Bonferroni correction; all others, two-sided Mann–Whitney U tests. Source data are provided as a Source Data file.
Fig. 2
Fig. 2. Reactive oxygen species signal IMiCa enhancement.
a Complex I cartoon depicting minimal (left) and excessive (right) electron (e) transfer from NADH to superoxide compared to ubiquinone (CoQ). Excessive O2 can escape from or self-inactivate Complex I. Black dots, Fe-S clusters. IMS, intermembrane space; IM, inner membrane. b, c Violin plots of MitoSoNar fluorescence ratio (B, increased F405/F488 value corresponds to increased NADH:NAD+ ratio) and mitochondrial ROS sensor MitoSOX fluorescence (c) measured via flow cytometry. Average MitoSoNar ratio: 1.1 (WT), 1.3 (FOXRED1KO), 1.8 (NDUFB10KO). Average MitoSOX: 849 (WT), 1950 (FOXRED1KO), 5704 (NDUFB10KO). Insets show mitochondrial targeting of the corresponding sensor. dg Summary (left) and exemplar (right) IMiCa in HEK293T cells expressing mito-LbNOX (d), SOD2 (e), mito-miniSOG (f), and ∆NTD-MCU (g). Arb. units, arbitrary units. Summary data are presented as mean values ± SEM. Violin plot insets display Tukey boxplots. Statistics: (bc) 1-way ANOVA followed by Bonferroni-corrected means comparisons; (dg) two-sided Mann–Whitney U tests. Source data are provided as a Source Data file.
Fig. 3
Fig. 3. A direct interaction between MCU and Complex I alters uniporter stability.
a NDUFA13 co-immunoprecipitates with MCU-Flag. Images are representative of 3 separate trials. b Left, mVenus-tagged Complex I subunits surveyed for FRET with MCU-mCerulean via flow cytometry. Images above each graph show mVenus-tagged constructs and MitoTracker Orange (MTO). Within graphs, each point in the density plot is an individual cell expressing MCU-mCerulean and the corresponding mVenus-tagged construct. For each cell, the FRET efficiency between its mCerulean and mVenus is displayed in the y axis, while the degree of expression of the mVenus-tagged construct is revealed by the mVenus fluorescence in the x axis. Right, summary of FRET efficiency between MCU-mCerulean and the corresponding mVenus-tagged constructs at moderate mVenus expression. c Left, MCU-NDUFS2 Duolink colocalization occurs in mitochondria (CoxIV) and is more prevalent at baseline (WT) than after Complex I inhibition (Rotenone). Right, Duolink summary. Note that 74% of MCU-ATP5A and 85% of Rotenone-treated (MCU-S2) cells had zero Duolink spots, compared to 27% of MCU-NDUFS2 and 37% of MCU-MTCO1 cells. d Left, MCU-NDUFS2 Duolink greater in control than NDUFB10−/C107S IPSCs. Right, Summary. 45% of NDUFB10−/C107S IPSCs had zero Duolink spots, compared to 19% for control. Summary data are presented as mean values ± SEM. Statistics: (b, c) 1-way ANOVA followed by Bonferroni-corrected means comparisons; (d), two-sided Student’s t test. Source data are provided as a Source Data file.
Fig. 4
Fig. 4. CLIPT controls MCU degradation.
a Doxycycline (doxy) treatment represses transcription of MCU-Flag. MCU-Flag persists after Complex I inhibition (rotenone) but not Complex III (antimycin A) or IV (sodium azide). b MCU-Flag stabilization induced by NTD peptide. c Design of rapamycin (Rapa)-induced dimerization experiment to test if MCU-Complex I interactions dictate MCU degradation. d Immunocytochemistry reveals co-localization of FRB-MCU, NDUFA10-FKBP, and mito-FKBP with mitochondrial markers CoxIV or ATP5F1. e With replacement of NTD with FRB, MCU only binds FKBP-tagged NDUFA10 in the presence of 100 nM rapamycin. Mito-FKBP-HA is a control. f FRB-MCU is stable in the absence or presence of rapamycin when cells co-express mito-FKBP-HA control, but rapidly degraded when rapamycin induces Complex I-binding in NDUFA10-FKBP-HA expressing cells. Images are representative of 3 (a, b, f) or 2 (d, e) separate trials. Source data are provided as a Source Data file.
Fig. 5
Fig. 5. Diminished MCU degradation is responsible for enhanced uniporter activity in Tfam KO hearts, and prolongs survival.
a Immunoblotting for the specified proteins in P10-P14 mouse heart lysates. Samples from 3 mice shown per genotype. b Analysis of Tfam and Mcu transcripts in mouse hearts. c Ca2+ uptake in isolated cardiac mitochondria incubated in Oregon Green BAPTA 6F (OGB6F). Arrow indicates 10 µM Ca2+ pulse. d Summary of the normalized rate of Ca2+ uptake after a 10 µM Ca2+ pulse. e Heart weight to body weight ratios of P10-P14 mice of the indicated genotypes. f Kaplan–Meier survival analysis of the Tfam KO mice compared to Tfam-Mcu DKO mice. Comparison via a log rank test. Summary data are presented as mean values ± SEM. Statistics: (b) Kruskal–Wallis followed by Dunn’s test with Bonferroni correction; (d, e) 1-way ANOVA followed by Bonferroni-corrected means comparisons; (f) Log-rank test. Source data are provided as a Source Data file.
Fig. 6
Fig. 6. Genetic interaction between MCU and Complex I in Drosophila.
a, c, e Drosophila survival for the indicated genotypes and sex. b, d, f Quantification of dwell time in the island assay for indicated genotypes for female flies. a, b The muscle specific MHC-GAL4 was used to drive expression of NDUFB10RNAi, MCUWT, or MCU∆NTD in wild-type or MCU1/MCU1 mutant flies, as indicated. c, d As in (a, b), except the dominant-negative pore mutant MCUDQEQ was expressed with MHC-GAL4. e, f As in (a, b), except the isolated NTD fragment was expressed with MHC-GAL4. *p < 0.05, **p < 0.01, ***p < 0.001. Statistics: (a, c, e) Fischer’s Exact Test with Bonferroni correction; (b, d, f) Log-rank (Mantel-Cox) test with Bonferroni correction. Source data are provided as a Source Data file.
Fig. 7
Fig. 7. Current hypothetical model for Complex I-induced protein turnover of MCU.
Top, under physiological conditions, MCU interacts with Complex I and is oxidized by the mild ROS leak produced by Complex I. Such oxidized MCU becomes damaged and degraded by LONP1 or other quality-control proteases, leaving Complex I available to interact with additional channels. We term this process Complex I-induced protein turnover (CLIPT). Bottom, when Complex I becomes impaired or misassembled, it produces excessive ROS and self-inactivates. Such dysfunctional Complex I can no longer interact with MCU, nor damage it with basal ROS leak, and is cleared by housekeeping proteases CLPP and LONP1. Thus, functional MCU levels build up, and additional Ca2+ influx through these channels maintains energetic homeostasis.

Similar articles

Cited by

References

    1. Glancy B, Balaban RS. Role of mitochondrial Ca2+ in the regulation of cellular energetics. Biochemistry. 2012;51:2959–2973. - PMC - PubMed
    1. Territo PR, Mootha VK, French SA, Balaban RS. Ca(2+) activation of heart mitochondrial oxidative phosphorylation: role of the F(0)/F(1)-ATPase. Am. J. Physiol. Cell Physiol. 2000;278:C423–C435. - PubMed
    1. El-Hattab AW, Scaglia F. Mitochondrial Cardiomyopathies. Front. Cardiovasc. Med. 2016;3:25. - PMC - PubMed
    1. Meyers DE, Basha HI, Koenig MK. Mitochondrial cardiomyopathy: pathophysiology, diagnosis, and management. Tex. Heart Inst. J. 2013;40:385–394. - PMC - PubMed
    1. Aydin J, et al. Increased mitochondrial Ca2+ and decreased sarcoplasmic reticulum Ca2+ in mitochondrial myopathy. Hum. Mol. Genet. 2009;18:278–288. - PubMed

Publication types