. 2022 May 19;13(1):2801.
doi: 10.1038/s41467-022-30396-3.

Inhibition of mitochondrial complex I reverses NOTCH1-driven metabolic reprogramming in T-cell acute lymphoblastic leukemia

Affiliations

Inhibition of mitochondrial complex I reverses NOTCH1-driven metabolic reprogramming in T-cell acute lymphoblastic leukemia

Natalia Baran et al. Nat Commun. .

Abstract

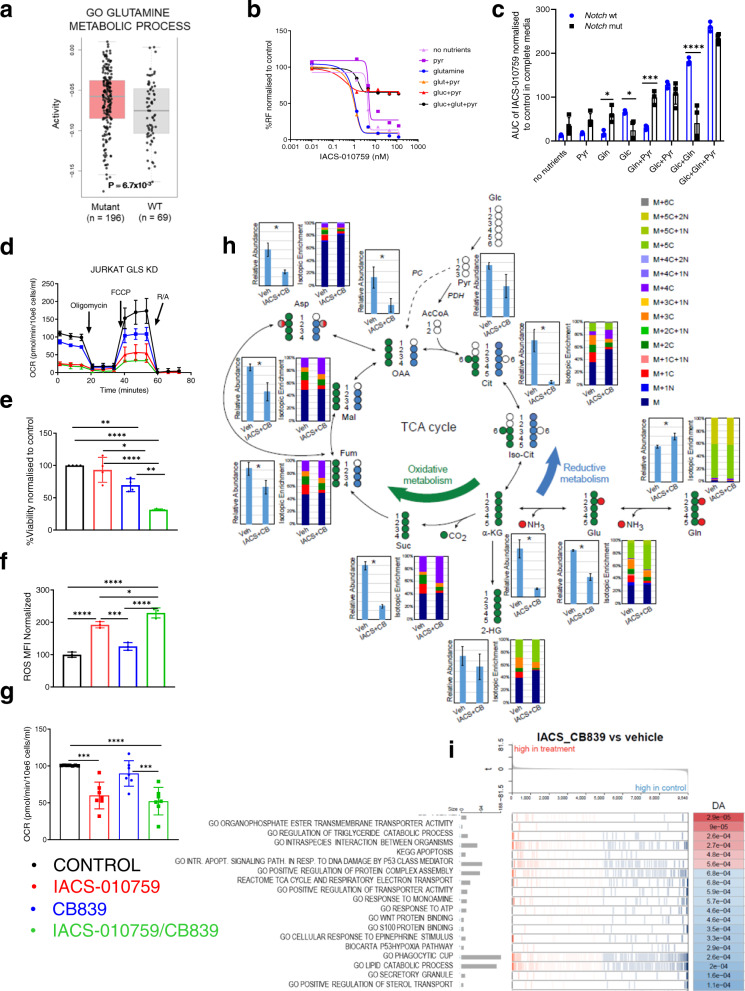
T-cell acute lymphoblastic leukemia (T-ALL) is commonly driven by activating mutations in NOTCH1 that facilitate glutamine oxidation. Here we identify oxidative phosphorylation (OxPhos) as a critical pathway for leukemia cell survival and demonstrate a direct relationship between NOTCH1, elevated OxPhos gene expression, and acquired chemoresistance in pre-leukemic and leukemic models. Disrupting OxPhos with IACS-010759, an inhibitor of mitochondrial complex I, causes potent growth inhibition through induction of metabolic shut-down and redox imbalance in NOTCH1-mutated and less so in NOTCH1-wt T-ALL cells. Mechanistically, inhibition of OxPhos induces a metabolic reprogramming into glutaminolysis. We show that pharmacological blockade of OxPhos combined with inducible knock-down of glutaminase, the key glutamine enzyme, confers synthetic lethality in mice harboring NOTCH1-mutated T-ALL. We leverage on this synthetic lethal interaction to demonstrate that IACS-010759 in combination with chemotherapy containing L-asparaginase, an enzyme that uncovers the glutamine dependency of leukemic cells, causes reduced glutaminolysis and profound tumor reduction in pre-clinical models of human T-ALL. In summary, this metabolic dependency of T-ALL on OxPhos provides a rational therapeutic target.


Conflict of interest statement

The authors declare no competing interests.

Figures

Fig. 1
Fig. 1. Oxidative phosphorylation downstream of NOTCH1 is essential for preleukemic stem cells function.
a Gene set enrichment analysis of NOTCH1-bound genes in Molecular Signatures Database. The list of genes in which NOTCH1 binding was observed within 2 kb of transcription start sites in murine T-ALL cell lines was extracted as described in Materials and Methods. False discovery rates (FDRs) are shown for overlaps computed with Hallmark gene sets or canonical pathways (Reactome and Kyoto Encyclopedia of Genes and Genomes). TCA: tricarboxylic acid; ETC, electron transport chain. b Dynamics of NOTCH1 target gene expression during thymocyte differentiation. The numbers of NOTCH1 target genes that increased >1.3-fold at each transition (gray bars, left axis). Gene expression data are from the Immunological Genome Project. GSEA was conducted on the gene sets whose expression increased at each transitional stage. FDR values overlap with the OxPhos gene set (Hallmark) were computed as above (green bars, right axis). ETP, early T-lineage precursor; DN3a, (CD4CD8CD25+CD44CD28), DN3b, (CD4CD8CD25+CD44CD28+). c Heatmap of expression of NOTCH1-bound genes within the OxPhos pathway. Ultralow input (ULI) RNA-seq data were obtained from IMMGEN. ETP, early thymocyte progenitor (LinlowCD25CD44+Kit+), DN2, double negative 2 (LinlowCD25+CD44+Kit+), DN3 (CD4CD8CD25+CD44), DN4 (CD4CD8CD25CD44CD28+), ISP, immature single positive (CD4CD8+CD24hiTCRlo), DP (CD4+CD8+TCRloCD24hi), T4 (CD4+CD8 − TCRhi), T8 (CD4CD8+TCRhi). d GSEA of the TARGET gene set (Therapeutically Applicable Research to Generate Effective Treatments) (N = 265), indicated enrichment of genes related to glutamine metabolism, mitochondrial metabolism as well as translation and downregulation of apoptosis-related genes in patients with NOTCH1-mutations (each vertical bar in x-axis is gene rank in the pathway list and y-axis represents running enrichment score). e The OxPhos gene signature in T-ALL patients from TARGET cohort. f Enrichment of mitochondrial translation genes in T-ALL patients from TARGET cohort. g Enrichment of apoptosis-related genes in T-ALL patients from the TARGET cohort; for (e), (f) and (g): two-sided t-test; The center line represents the median and whiskers represents maximum (Q3 + 1.5*IQR) and minimum value (Q1+1.5*IQR).
Fig. 2
Fig. 2. NOTCH1 activation affects the response to OxPhos-inhibition of primary pre-LSCs.
a Notch1 gene mutation in SCLtgLMO1tg preleukemic and leukemic thymocytes. b Overexpression of NOTCH1 protein by flow cytometry. Thymocytes from wt- and NOTCH1tg mice were stained with anti-NOTCH1 antibody or an isotype control. c dose–response of primary pre-LSCs to IACS-010759, co-cultured on MS5-DL4 stromal cells followed by 48 h drug treatment (mean ± SD, n = 3 independent experiments in triplicates). d Dose–response of pre-LSCs to IACS-010759 treatment, co-cultured on MS5 stromal cells followed by 48 h drug treatment (mean ± SD, n = 3.independent experiments in triplicates). e Effects of IACS-010759 treatment (133 nM or DMSO) on viability of pre-LSCs cultured on MS5-DL4 (mean ± SD, n = 3 independent experiments). f Effects of IACS-010759 treatment (133 nM or DMSO) on viability of pre-LSCs cultured on MS5 (mean ± SD, n = 3 independent experiments). g Pre-LSC sensitivity to IACS-010759 for the indicated genotypes. The Area under the curves (AUC) were computed from dose–response data illustrated in (c). Shown is the AUC difference obtained between DMSO (black ring) and drug-treated cells (p < 0.00001, multiple unpaired t tests, n = 3 mice per genotype, in triplicates); with (green) and without DL4 (blue), in pre-LSCs with or without NOTCH1 oncogene in the absence of DL4. h Basal oxygen consumption rate (OCR) in T-lymphocytes (n = 7), NOTCH1-wt (n = 3) and -mutant cell lines (n = 7) by Mito Stress Test assay (mean ± SD, n = 3 independent measurements for each line, 4 replicates); one-way ANOVA; *p < 0.05; ***p < 0.001. i IC50 for basal OCR inhibition (Supplementary Figs. 3c and 4) for T-lymphocytes (n = 4) and NOTCH1-wt (n = 3) and -mutated T-ALL cell lines (n = 7) (mean ± SD, n = 3 independent experiments for each line, 4 replicates); one-way ANOVA; *p < 0.05; ***p < 0.001. j IC50 for viability inhibition for T-lymphocytes (n = 5), NOTCH1-wt (n = 3) and -mutant cell lines (n = 7) treated with IACS-010759 (0–123 nM, 96 h); (mean ± SD, n = 3 independent experiments); one-way ANOVA; ns-no significance, **p < 0.005. k Viable cell number in T-lymphocytes (n = 7), NOTCH1-wt (n = 3) and -mutant (n = 7) T-ALL cell lines, treated with IACS-010759 (1, 10, 100 nM, 96 h), (mean ± SD, n = 3 independent experiments per line, 3 replicates); two-way ANOVA: ns-no significance, *p < 0.05; **p < 0.005; ***p < 0.001; and ****p < 0.0001. l ROS (MFI) treated with IACS-010759 (1, 10, 100 nM; 96 h) in T-lymphocytes (n = 6), T-ALL cell lines with wt- (n = 3) and mutant NOTCH1 (n = 7); (mean ± SD, n = 3 independent experiments per line, 3 replicates); two-way ANOVA: ns-no significance, *p < 0.05; **p < 0.005; ***p < 0.001; and ****p < 0.0001.
Fig. 3
Fig. 3. Mitochondrial complex I inhibition induces distinct metabolic reprogramming followed by reductive metabolism of glutamine in NOTCH1-mutated cell lines, uncovering a potential metabolic mechanism of acquired resistance under OxPhos blockade.
a ATP levels for NOTCH1-mutated T-ALL (n = 4) treated 96 h in media with: no nutrients, pyruvate (Pyr), glutamine (Gln), glucose (Glc), Gln+Pyr, Glc+Pyr, Glc+Gln, Glc+Pyr+Gln, (mean ± SD, n = 4 independent experiments, 3 replicates); one-way ANOVA: *p < 0.05; **p < 0.005; ***p < 0.001; ****p < 0.0001. b Basal OCR of 4 NOTCH1-mutated T-ALL cell lines treated 24 h as in (a), (mean ± SD, n = 3 independent experiments, 4 replicates); one-way ANOVA: *p < 0.05; **p < 0.005; ***p < 0.001; ****p < 0.0001. c Metabolic phenotype (basal OCR/basal ECAR ratio) as in (a); (mean ± SD, n = 3 independent experiments, 4 replicates). d Extracellular acidification rate (ECAR) in NOTCH1-mutated T-ALL cell line PF-382 after IACS-010759 treatment (0–123 nM, 4 h); Glycolysis Stress Test (mean ± SD, n = 3 independent experiments, 4 replicates). e Basal ECAR of NOTCH1-wt (n = 3) and -mutated (n = 6) cell lines treated 24 h in media with Gln only (blue) and after acute injection of Glc (black); (Glycolysis Stress Test), (mean ± SD, n = 3 independent experiments, 4 replicates); two-way ANOVA: ***p = 0.0002. f Basal OCR in NOTCH1-wt (n = 3) and -mutated (n = 6) cell lines treated as in (e); (mean ± SD, n = 3 independent experiments, 4 replicates); two-way ANOVA: *p = 0.0250. g Basal ECAR of NOTCH1-mutated (n = 5) and -wt (n = 3) cell lines treated with IACS-010759 (0–123 nM, 4 h); (mean ± SD, n = 3 independent experiments, 4 replicates); two-tailed t test: ****p < 0.0001. h Glycolytic capacity in NOTCH1-mutated (n = 5) and -wt (n = 3) cell lines treated with IACS-010759 (0–123 nM, 4 h), Glycolysis Stress Test; (mean ± SD, n = 3 independent experiments, 4 replicates); one-way ANOVA: ****p < 0.0001. i ATP production (%) for NOTCH1-mutant (n = 8) and -wt (n = 3) cell lines treated with IACS-010759 (0–123 nM, 4 h), ATP Rate Assay; (mean ± SD, n = 3 independent experiments, 4 replicates); one-way ANOVA: ****p < 0.0001. j Levels of citrate and α-ketoglutarate and citrate/α-ketoglutarate ratio over time in NOTCH1-mutated cell line PF382; (mean ± SD, n = 1, 4 replicates); two-way ANOVA: ****p < 0.0001. k Stable isotope-resolved metabolomics ultra-high-pressure liquid chromatography MS analysis (SIRM) of NOTCH1-mutant PF-382 cell line cultured with 13C5,15N2-glutamine, treated with DMSO or IACS-010759 (10 nM, 12 h); (mean ± SD, n = 1, 4 replicates). two-tailed t-test; *p < 0.05; **p < 0.005; ***p < 0.001; and ****p < 0.0001.
Fig. 4
Fig. 4. Blockade of glutamine pathway through glutaminase knockdown and glutaminase inhibition in combination with complex I inhibition induces metabolic shutdown in T-ALL cells in vitro.
a Enrichment of glutamine metabolism components in T-ALL TARGET cohort; (Gene Ontology analysis); two-sided t test; The center line represents the median and whiskers represents maximum (Q3+1.5*IQR) and minimum value (Q1+1.5*IQR). b Viability of NOTCH1-mutated T-ALL cell lines (96 h, 0–100 nM of IACS01759) upon following conditions: no nutrients, pyruvate (Pyr), glutamine (Gln), glutamine+pyruvate (Glut+Pyr), glucose+pyruvate (Glc+Pyr), glucose+glutamine+pyruvate (Glc+Glut+Pyr), normalized to DMSO. c AUC upon IACS-010759 treatment (by CTG) calculated from (b), normalized to DMSO from Gln+Glc+Pyr, for NOTCH1-wt (blue) (n = 3) and NOTCH1-mutated (black) T-ALL cell lines (n = 4) (mean ± SD, n = 3 independent experiments, n = 3 replicates/condition). Two-way ANOVA; *p = 0.02; ***p = 0.0002; ****p < 0.0001; d Representative OCR response in NOTCH1-mutated T-ALL cell lines JURKAT subjected to doxycycline-induced knockdown of GLS (blue) and treatment with IACS-010759 (10 nM) for 4 h (red), or the combination (green) (mean ± SD, n = 3 biological replicates, n = 4 replicates/condition). e Cell viability in NOTCH1-mutated T-ALL patient samples (n = 4) treated with CB-839 (1 μM) and IACS-01759 (10 nM) after 96 h, by FL (mean ± SD, n = 4 independent patient samples, n = 3 replicates/condition); one-way ANOVA; *p = 0.039; **p = 0.0017; ****p < 0.0001. f Reactive oxygen species (ROS) -MFI of in NOTCH1-mutant T-ALL cell lines (n = 3) treated 96 h with CB-839 (1 μM) and IACS-010759 (10 nM). (mean ± SD, n = 3) by FL; one-way ANOVA; *p = 0.0202; ***p = 0.0005; ****p < 0.0001. g Basal OCR in NOTCH1-mutated T-ALL cell lines after treatment with vehicle, IACS-010759 (10 nM, 4 h), CB-839 (1 μM, 12 h), or IACS-010759/CB-839 combination (mean ± SD, n = 7 cell lines, n = 3 independent experiments, n = 4 replicates per condition); one-way ANOVA: ***p = 0.0003; ****p < 0.0001. h SIRM ultra-HPLC MS of NOTCH1-mutated T-ALL cell line PF-382 after enrichment with 13C515N2-glutamine and treatment with the combination of 10 nM IACS-010759 and 1 μM CB-839 or vehicle for 12 h. i Gene expression analysis in NOTCH1-mutant T-ALL after treatment with the combination of 10 nM IACS-010759 and 1 μM CB-839 compared to vehicle; (x-gene rank in the pathway list; y-running enrichment score).
Fig. 5
Fig. 5. Complex I inhibition in combination with glutaminase deletion impedes Notch1-mutant T-ALL leukemia development, improves tumor burden reduction, and extends overall survival in a murine model.
a Schematic of study design utilizing murine Notch1-mutated GLS fl/fl. b GFP+mCD45+ leukemia cells (%) in PB from mice bearing murine Notch1-mutated GLS fl/fl T-ALL cells after 5 days of treatment as shown in (a) (mean ± SD, n = 3 individual mice per treatment arm); one-way ANOVA; **p = 0.0025. c GFP+mCD45+ leukemia cells (%) in BM from mice as in (b) (mean ± SD, n = 3 individual mice per treatment arm); one-way ANOVA, **p = 0.001; and ***p = 0.0005. d GFP+mCD45+ leukemia cells (%) in spleens from mice as in (b) (mean ± SD, n = 3 individual mice per treatment arm); one-way ANOVA, *p = 0.013. e Spleens harvested from mice bearing murine Notch1-mutated GLS fl/fl T-ALL cells following 5 days of treatment with vehicle; IACS-010759; tamoxifen; or combination of IACS-010759 and tamoxifen (n = 3). f H&E staining of BM, spleen and liver from one representative mouse from each group, selected based on complementary FL results from (c) and (d). Scale bars represent 100 μm; from the same experiment as FL data. g Heatmap of MS analysis of metabolites in PB of mice bearing murine Notch1-mutated GLS fl/fl T-ALL cells after 5 days of treatment with vehicle; IACS-010759; tamoxifen; or IACS-010759 and tamoxifen; (mean log of fold-change ratio over the level of metabolites measured in mice treated with vehicle); (mean ± SD, n = 4 individual mice/group). h Kaplan–Meier survival curves of mice transplanted with murine Notch1-mutated GLS fl/fl T-ALL. Mice (n = 5 per treatment arm) were treated with vehicle; tamoxifen (1 mg/mouse over 5 days); IACS-010759 (5 days per week 5 mg/kg Mo–Fr) or concomitantly with IACS-010759 and tamoxifen; treatment was initiated after detection of GFP+ cells in PB by FL at day 7; log-rank test, ***p < 0.005, ****p < 0.0001. i Weekly tumor burden monitoring by detection of GFP+mCD45+ leukemia cells in PB in mice as indicated in (h); the timeframe of treatment is labeled by the yellow windows on the graph; (mean ± SD, n = 5 individual mice per treatment arm).
Fig. 6
Fig. 6. VXL and IACS-010759 induce profound metabolic damage in vivo and leads to improvement of tumor burden reduction and overall survival in PDX models in vivo.
a MS Heatmap of metabolites in BM of mice transplanted with NOTCH1-mutated PDX80 after 12 h of treatment with vehicle, IACS-010759, VXL, or the combination of IACS-010759 and VXL (n = 2). b CyTOF heatmap of spleen samples from PDX80 model treated with vehicle, IACS-010759, VXL, or the combination of IACS-010759 and VXL (n = 2). c CyTOF UMAP for CD45, CD3, CD5, CD7 and Ki67 markers in spleen samples from PDX80 model treated with vehicle, IACS-010759, VXL, or the combination of IACS-010759 and VXL (n = 2). d Gene expression analysis of spleen samples from PDX80 model after treatment with the combination of IACS-010759 and VXL compared to vehicle treatment. e Leukemic engraftment (% of human CD45+ leukemia cells) in spleen at day 5 of treatment with vehicle, VXL, IACS-010759, or the combination of IACS-010759 and VXL, as measured by FL in 3 PDX models (from left to right: PDX D115, PDX CU76, PDX 80) (mean ± SD, n = 4 individual mice per treatment arm); one-way ANOVA; *p = 0.01; **p = 0.0016; ***p = 0.0002, ****p < 0.0001. f Tumor burden development in 3 PDX models (from left to right: PDX D115, PDX CU76, PDX 80) measured as weekly detection of circulating human CD45+ cells in peripheral blood (PB) and expressed as percent of normalized human to sum of human and murine CD45+ cells in mice undergoing treatment with vehicle, IACS-010759 (5 mg/kg once daily, 5 days on/2 days off), VXL (once weekly), or the combination of IACS-010759 and VXL (mean ± SD, n = 10 mice per treatment arm for PDX D115 and PDX CU76 and n = 8 mice per treatment arm for PDX 80). g Kaplan–Meier survival curves of mice transplanted with PDX models (from left to right: PDX D115, PDX CU76, PDX 80) and treated with vehicle, IACS-010759, VXL, or the combination of IACS-010759 and VXL (n = 8). Treatment was initiated once the level of circulating leukemia cells in PB reached 0.5–1%; the timeframe of treatment is labeled by the yellow windows on the graphs. log-rank test: ***p < 0.0006 ****p < 0.0001.

References

    1. Giambra V, et al. Leukemia stem cells in T-ALL require active Hif1alpha and Wnt signaling. Blood. 2015;125:3917–3927. doi: 10.1182/blood-2014-10-609370. - DOI - PMC - PubMed
    1. Vadillo E, Dorantes-Acosta E, Pelayo R, Schnoor M. T cell acute lymphoblastic leukemia (T-ALL): New insights into the cellular origins and infiltration mechanisms common and unique among hematologic malignancies. Blood Rev. 2018;32:36–51. doi: 10.1016/j.blre.2017.08.006. - DOI - PubMed
    1. Kang MH, et al. Activity of vincristine, L-ASP, and dexamethasone against acute lymphoblastic leukemia is enhanced by the BH3-mimetic ABT-737 in vitro and in vivo. Blood. 2007;110:2057–2066. doi: 10.1182/blood-2007-03-080325. - DOI - PubMed
    1. Szymanska B, et al. Pharmacokinetic modeling of an induction regimen for in vivo combined testing of novel drugs against pediatric acute lymphoblastic leukemia xenografts. PLoS ONE. 2012;7:e33894. doi: 10.1371/journal.pone.0033894. - DOI - PMC - PubMed
    1. Ferrando AA, et al. Biallelic transcriptional activation of oncogenic transcription factors in T-cell acute lymphoblastic leukemia. Blood. 2004;103:1909–1911. doi: 10.1182/blood-2003-07-2577. - DOI - PubMed

Publication types

MeSH terms