. 2022 May 19;13(1):2756.
doi: 10.1038/s41467-022-30325-4.

BMP4 drives primed to naïve transition through PGC-like state

Affiliations

BMP4 drives primed to naïve transition through PGC-like state

Shengyong Yu et al. Nat Commun. .

Abstract

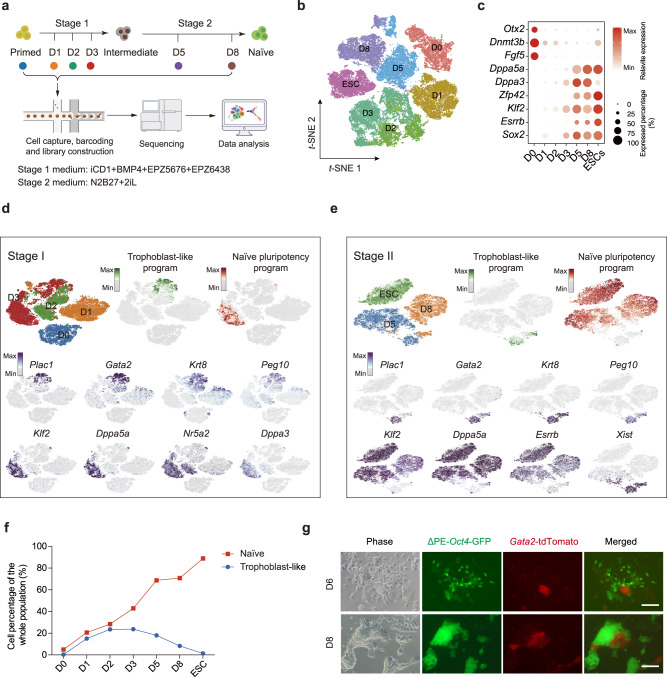
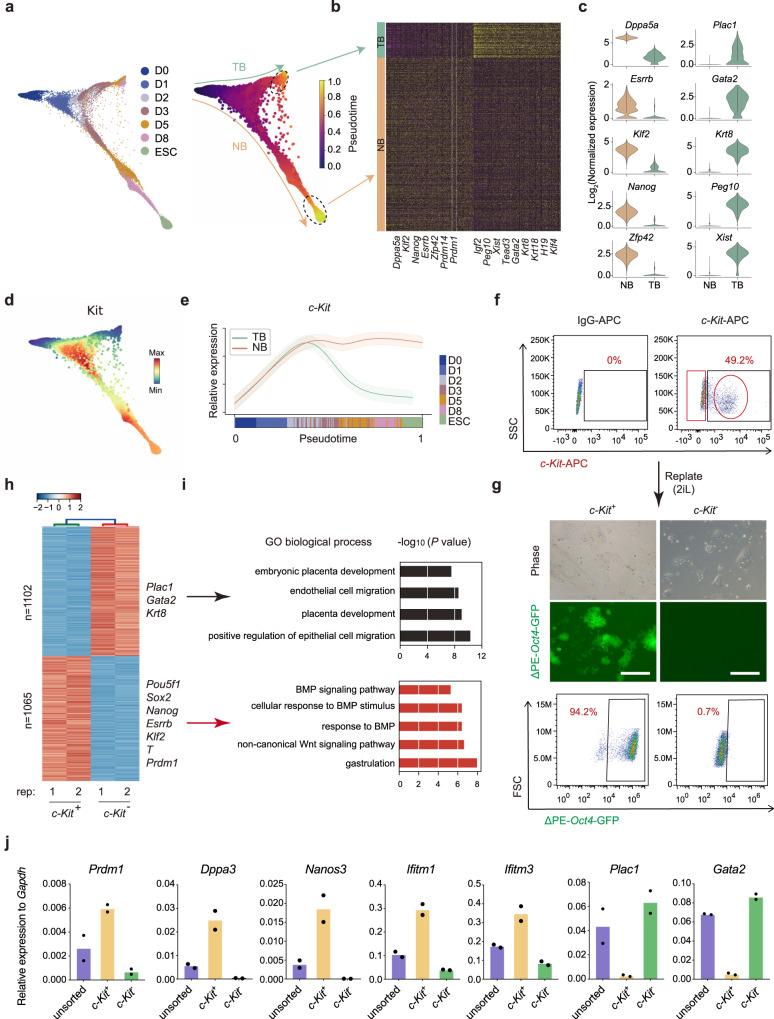
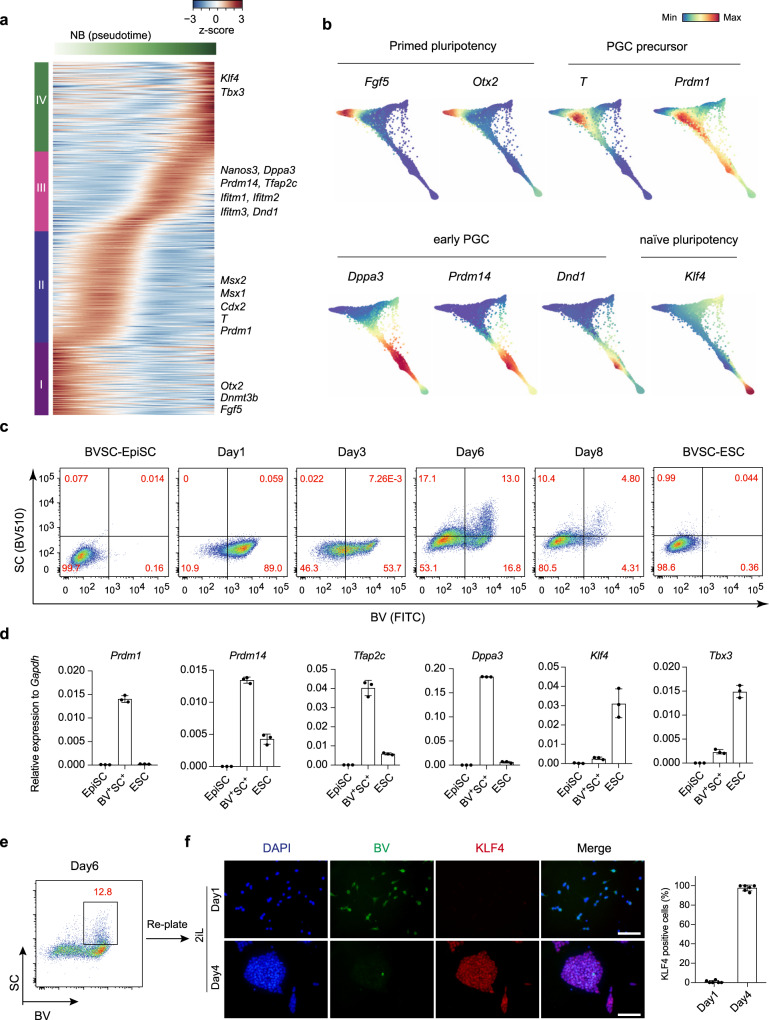
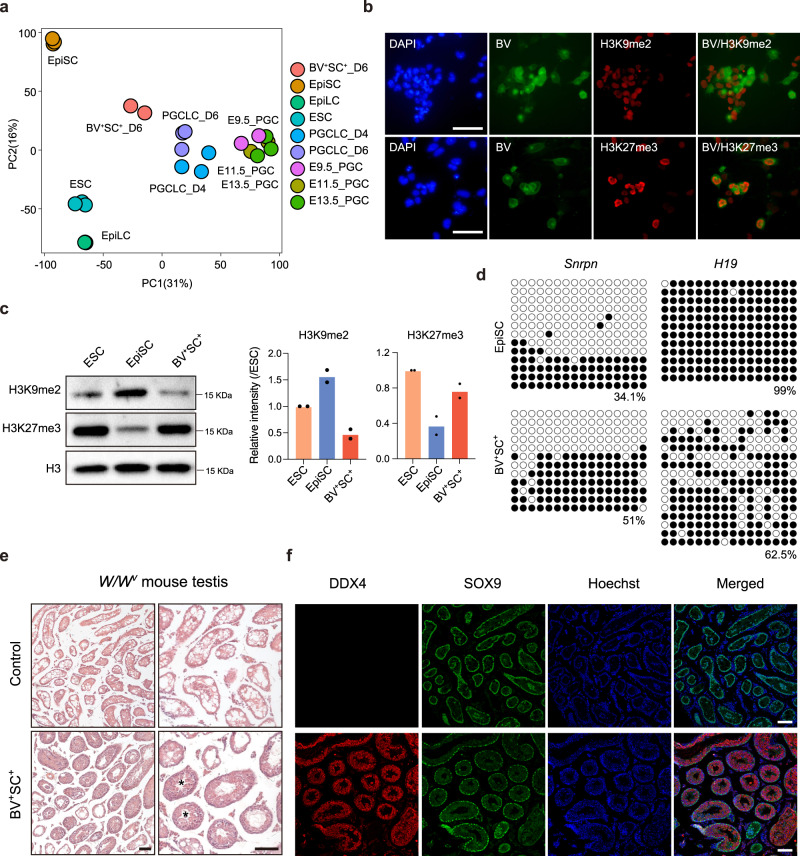
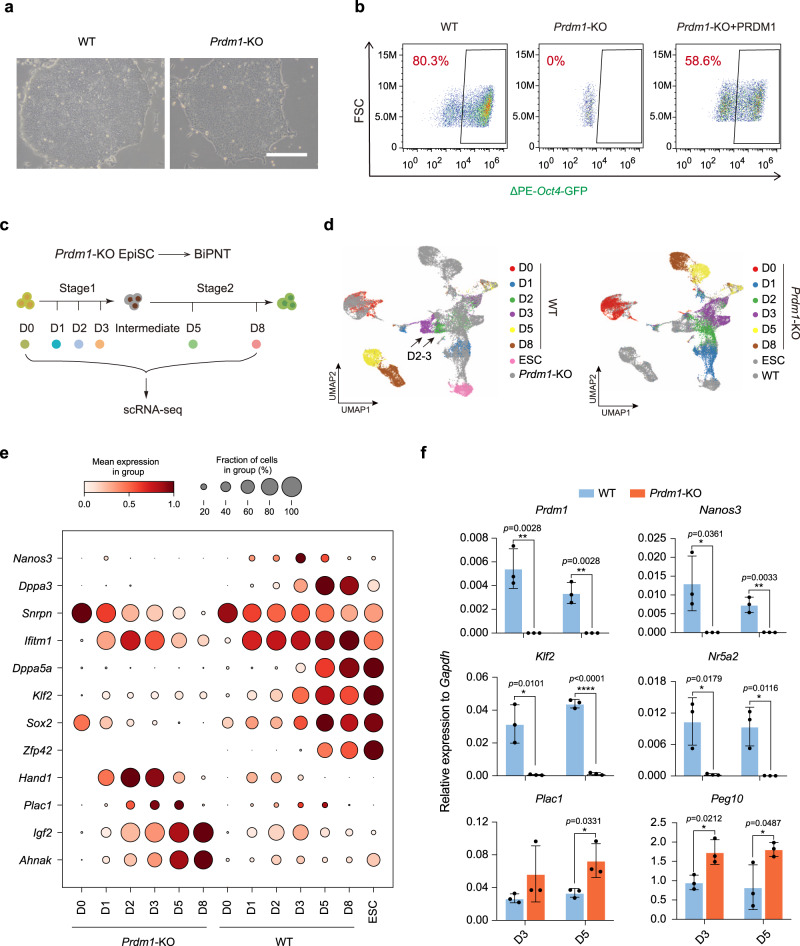
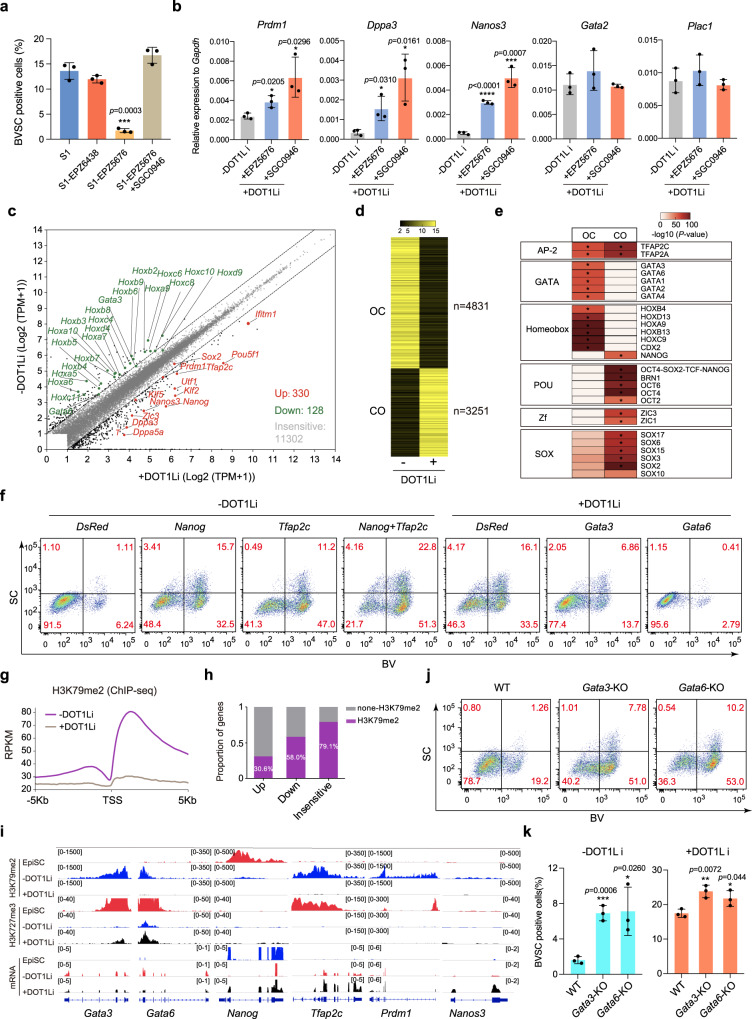
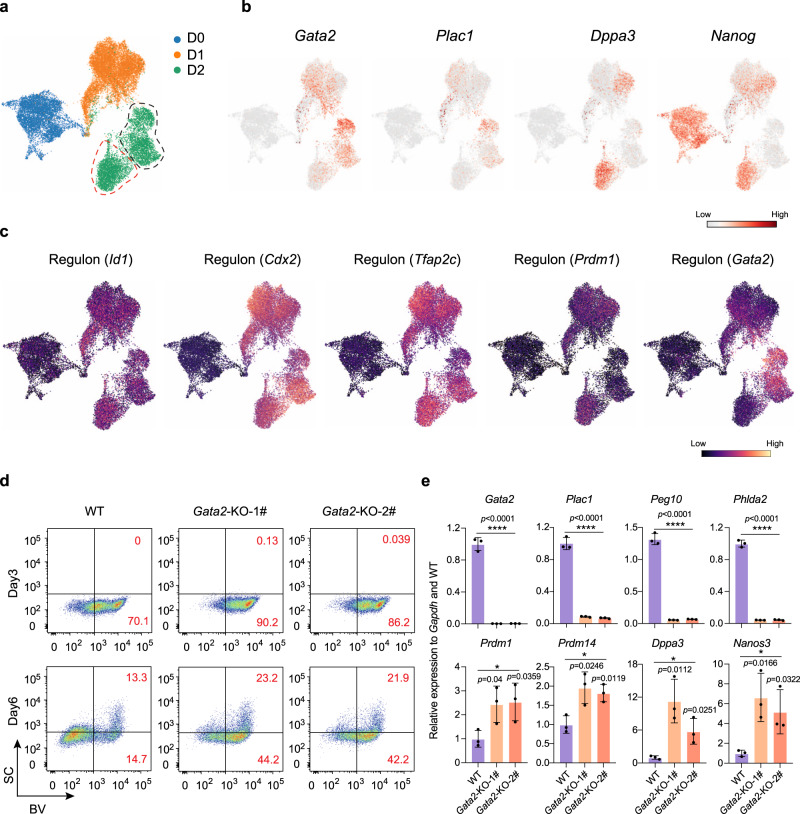
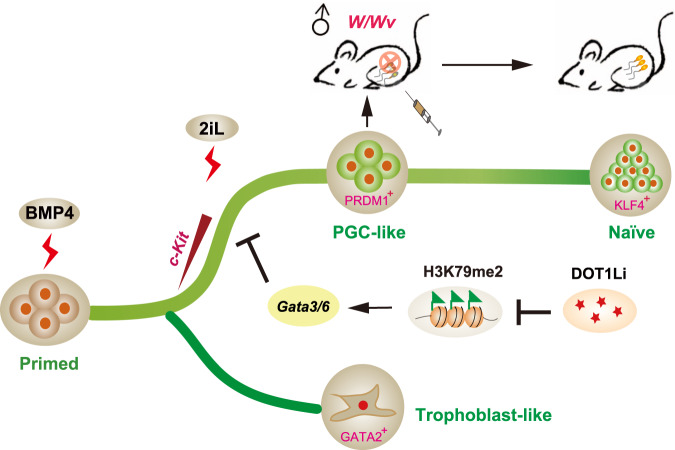
Multiple pluripotent states have been described in mouse and human stem cells. Here, we apply single-cell RNA-seq to a newly established BMP4 induced mouse primed to naïve transition (BiPNT) system and show that the reset is not a direct reversal of cell fate but goes through a primordial germ cell-like cells (PGCLCs) state. We first show that epiblast stem cells bifurcate into c-Kit+ naïve and c-Kit- trophoblast-like cells, among which, the naïve branch undergoes further transition through a PGCLCs intermediate capable of spermatogenesis in vivo. Mechanistically, we show that DOT1L inhibition permits the transition from primed pluripotency to PGCLCs in part by facilitating the loss of H3K79me2 from Gata3/6. In addition, Prdm1/Blimp1 is required for PGCLCs and naïve cells, while Gata2 inhibits PGC-like state by promoting trophoblast-like fate. Our work not only reveals an alternative route for primed to naïve transition, but also gains insight into germ cell development.


Conflict of interest statement

The authors declare no competing interests.

Figures

Fig. 1
Fig. 1. Single-cell analysis for BiPNT.
a Flow chart for the scRNA-seq analysis of BMP4 induced Primed-Naïve Transition (BiPNT). scRNA-seq experiment was performed with 10x Genomics. b t-SNE projection of all 50406 individual cells during the whole BiPNT process. c Expression of genes in 2 different categories at the indicated time points. d t-SNE projection of cells and typical gene expressions at stage 1. e t-SNE projection of cells and typical gene expressions at stage 2. f Percentages of naïve cells and trophoblast-like cells at different time points. g Representative images of ΔPE-Oct4-GFP/Gata2-tdTomato EpiSC induced BiPNT at D6 and D8. Scale bars, 100 μm. The experiments were repeated independently three times with similar results.
Fig. 2
Fig. 2. c-Kit is a key marker for successful BiPNT.
a Trajectory reconstruction of all single cells throughout BiPNT, colored by indicated time points. b The bifurcating branches were defined as NB (naïve branch) and TB (trophoblast branch) separately. Circles indicate cells at the terminus of the NB and TB, respectively (left). Identification of the differentially expressed genes between NB and TB (right). c Violin plot displaying the expression of representative naïve pluripotency genes and trophoblast genes in indicated cell types. d Plots showing the expression patterns of cell surface marker c-Kit in NB and TB. e Expression trends of c-Kit along pseudotime during NB and TB specification. f c-Kit positive and negative cells were separated at Day 3 of BiPNT. g Images of ΔPE-Oct4-GFP colonies (upper panel) and FCAS result (lower panel) for c-Kit positive and negative cells sorted in f and replated in stage 2 medium (2iL) for another 5 days. Scale bars, 250 μm. The experiments were performed twice with similar results. h Heatmap showing gene expression differences between c-Kit positive and negative cell samples by RNA-seq. Representative genes are shown on the right. i Gene ontology (GO) analysis for differentially expressed genes in h. j Expression of PGC and trophoblast markers measured by RT-qPCR in Day 3 cells of BiPNT (unsorted, sorted c-Kit positive and negative cells). Data are mean ± s.d., n = 2 independent experiments. Source data are provided as a Source Data file.
Fig. 3
Fig. 3. Activation of PGC-like program during successful BiPNT.
a Gene expression heatmap of 3219 dynamic expressed genes along NB (naïve branch) in a pseudotemporal order. Representative genes are shown on the right. b Plots showing the expression patterns of the indicated genes during BiPNT. c FACS analysis of BVSC induction at distinct time points during BiPNT. d RT-qPCR analysis for expression of indicated genes in EpiSC, BV+SC+ cells from Day 6 of BiPNT and ESC. Data are mean ± s.d., n = 3 independent experiments. e BV+SC+ cells were sorted from Day 6 of BiPNT as c. f Left: BV+SC+ cells from e were re-plated with 2iL medium for further transition into naïve state. Immunostaining for KLF4 to monitor the transition process. Scale bars, 100 μm. Right: Percentage of KLF4 positive cells. Data are mean ± s.d., n = 6 microscope fields. Source data are provided as a Source Data file.
Fig. 4
Fig. 4. Characterization of PGC-like cells.
a PCA analysis of BV+SC+ cells at Day 6 of BiPNT, EpiSC, ESC, PGCLC-D4/6, E9.5 PGC, E11.5 PGC, E13.5 PGC, and EpiLC. b Immunofluorescence analysis of H3K9me2 and H3K27me3 in BV+ cells at Day 6 of BiPNT. Scale bars, 50 μm. c Western blot analysis (left) of H3K9me2 and H3K27me3 in ESC, EpiSC and BV+SC+ cells at Day 6 of BiPNT. Quantification of H3K9me2 and H3K27me3 normalized to H3 levels (right). Data are mean ± s.d., n = 2 independent experiments. d Bisulfite sequence analysis of 5mC of differentially methylated regions (DMRs) of the imprinted genes Snrpn and H19 in EpiSC and BV+SC+ cells. White and black circles indicate unmethylated and methylated CpGs, respectively. e Testis sections from W/Wv mice and another one that was transplanted with Day 6 BV+SC+ cells stained by hematoxylin and eosin. Scale bars, 100 μm. f Immunofluorescence analysis of DDX4 and SOX9 expression in testis sections from W/Wv mice and another one that was transplanted with Day 6 BV+SC+ cells. Scale bars, 100 μm. The experiments in b, ef were repeated twice with similar results. Source data are provided as a Source Data file.
Fig. 5
Fig. 5. PGCLCs mediate the successful BiPNT.
a Representative images of wild-type (WT) and Prdm1 knockout (Prdm1-KO) EpiSCs. Scale bars, 250 μm. Data shown are from 1 of 3 independent experiments. b FACS analysis of ΔPE-Oct4-GFP+ cells induced with WT, Prdm1-KO and rescued (overexpression of Prdm1) EpiSCs at Day 8. c Schematic diagram of scRNA-seq for Prdm1-KO EpiSC. d UMAP plots of WT and Prdm1-KO cells. WT cells are colored by the Day (D) during BiPNT while Prdm1-KO cells are marked with gray (left) or vice versa (right). The black arrow indicates the obviously depletion of D2–3 cells in Prdm1-KO EpiSC induced BiPNT. e Expression of indicated genes at the different time points. f RT-qPCR analysis for expression of indicated genes at Day 3 and Day 5 of WT or Prdm1-KO induced BiPNT. Data are mean ± s.d., two-tailed, unpaired student’s t-test; n = 3 independent experiments. *p < 0.05, **p < 0.01, ****p < 0.0001. Source data are provided as a Source Data file.
Fig. 6
Fig. 6. DOT1L inhibitor is responsible for the induction of PGCLCs from EpiSCs.
a FACS analysis of BVSC induction at Day 6 under different conditions. S1, stage1. b RT-qPCR analysis for expression of PGC and trophoblast markers at Day 3 of BiPNT without (−) or with (+) DOT1L inhibitor (DOT1Li: EPZ5676 and SGC0946) treatment. Data are mean ± s.d., two-tailed, unpaired student’s t-test; n = 3 independent experiments. *p < 0.05, ***p < 0.001, ****p < 0.0001. c The difference between the transcriptomic profiles without (–) or with (+) DOT1Li (SGC0946) treatment at Day 3. Representative significantly upregulated genes (compared with −DOT1Li, log2 fold change (log2 FC > | 1 |)) are in red, and downregulated ones are in green. d Heatmap of open or closed chromatin loci in Day 3 cells without (–) or with (+) DOT1Li (SGC0946) treatment. CO: Closed to Open, OC: Open to Closed. e Motif discovery for DOT1Li (SGC0946) mediated CO and OC loci. f FACS analysis of BV+SC+ PGCLCs induction at Day 6 after overexpression of DsRed (control), Nanog, Tfap2c or combined without (–) DOT1Li (SGC0946) treatment, or overexpression of Gata3 and Gata6 with (+) DOT1Li (SGC0946) treatment. g Metaplot of H3K79me2 reference-normalized ChIP-seq signal at all transcriptional start site (TSS) in Day 3 BiPNT cells without (–) or with (+) DOT1Li (SGC0946) treatment. h Proportion of differentially expressed genes and insensitive genes from c, which are directly marked with H3K79me2 in Day 3 cells (-DOT1Li). i ChIP-seq (H3K79me2, H3K27me3) and RNA-seq tracks of indicated genes in untreated EpiSC and Day 3 BiPNT cells without (−) or with (+) DOT1Li (SGC0946) treatment. j FACS analysis of BVSC induction at Day 6 with Gata3- or Gata6-KO EpiSCs. k Percentage of BVSC positive cells induced with Gata3- or Gata6-KO EpiSCs under different conditions. Data are mean ± s.d., two-tailed, unpaired student’s t-test; n = 3 independent experiments. *p < 0.05, **p < 0.01, ***p < 0.001. Source data are provided as a Source Data file.
Fig. 7
Fig. 7. Deficiency of Gata2 hinders trophoblast fate but promotes PGCLCs.
a t-SNE representation of 24233 cells during the first three days of whole process, colored by time point of samples. The cells enclosed by red and black dotted lines indicate two distinct populations. b Cells colored by expression pattern of Gata2, Plac1, Dppa3, and Nanog in t-SNE representation. c t-SNE plot displaying Id1, Cdx2, Tfap2c, Prdm1 and Gata2 regulons (red dots, active; black dots, inactive) in the first 3 days, respectively. d FACS analysis of BVSC induction at Day 3 and Day 6 during BiPNT in WT or two independent Gata2-KO EpiSCs. e RT-qPCR analysis for expression of trophoblast and PGC associated genes in WT and two Gata2-KO cells from Day 6 of BiPNT. Data are mean ± s.d., two-tailed, unpaired student’s t-test; n = 3 independent experiments. *p < 0.05, ****p < 0.0001. n = 3 independent experiments. Source data are provided as a Source Data file.
Fig. 8
Fig. 8. Schematic diagram of cell fate trajectories during BiPNT.
During BiPNT, EpiSCs bifurcate into c-Kit+ naïve and c-Kit- trophoblast-like cells. A PGC-like intermediate which capable of spermatogenesis in vivo is emerged before reaching to the naïve pluripotent state. The inhibition of DOT1L activity permits the transition from primed pluripotency to PGCLCs in part by facilitating the loss of H3K79me2 from Gata3/6 and repressing their transcription.

Similar articles

Cited by

References

    1. Nichols J, Smith A. Naive and primed pluripotent states. Cell Stem Cell. 2009;4:487–492. doi: 10.1016/j.stem.2009.05.015. - DOI - PubMed
    1. Tesar PJ, et al. New cell lines from mouse epiblast share defining features with human embryonic stem cells. Nature. 2007;448:196–199. doi: 10.1038/nature05972. - DOI - PubMed
    1. Brons IG, et al. Derivation of pluripotent epiblast stem cells from mammalian embryos. Nature. 2007;448:191–195. doi: 10.1038/nature05950. - DOI - PubMed
    1. Bao S, et al. Epigenetic reversion of post-implantation epiblast to pluripotent embryonic stem cells. Nature. 2009;461:1292–1295. doi: 10.1038/nature08534. - DOI - PMC - PubMed
    1. Guo G, et al. Klf4 reverts developmentally programmed restriction of ground state pluripotency. Development. 2009;136:1063–1069. doi: 10.1242/dev.030957. - DOI - PMC - PubMed

Publication types

Substances