. 2022 May 19;13(1):2786.
doi: 10.1038/s41467-022-30437-x.

The ubiquitin ligase Cul5 regulates CD4+ T cell fate choice and allergic inflammation

Affiliations

The ubiquitin ligase Cul5 regulates CD4+ T cell fate choice and allergic inflammation

Binod Kumar et al. Nat Commun. .

Abstract

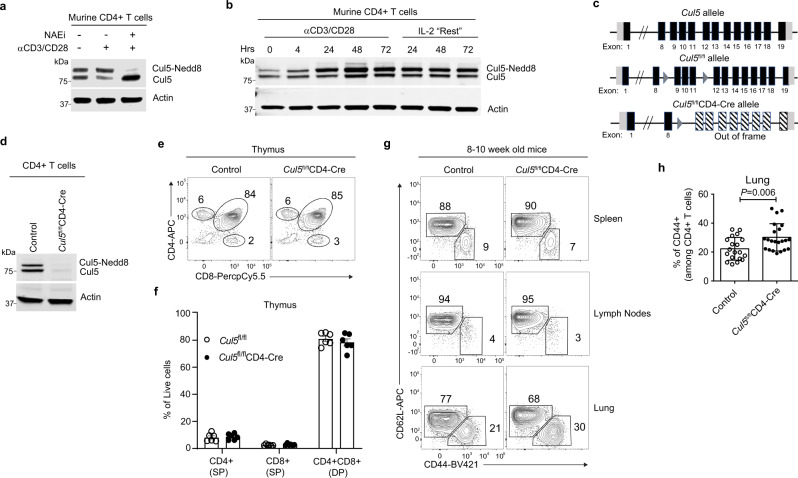
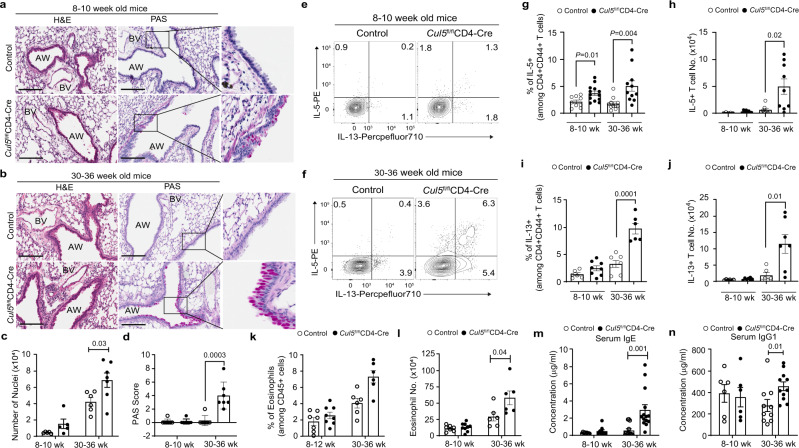
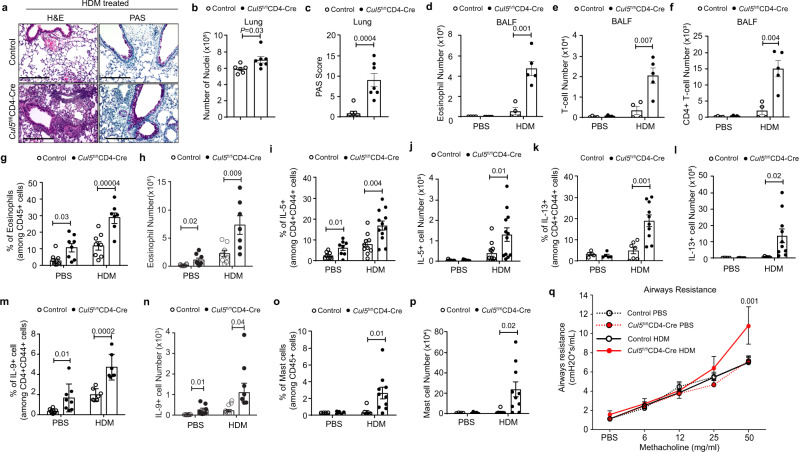
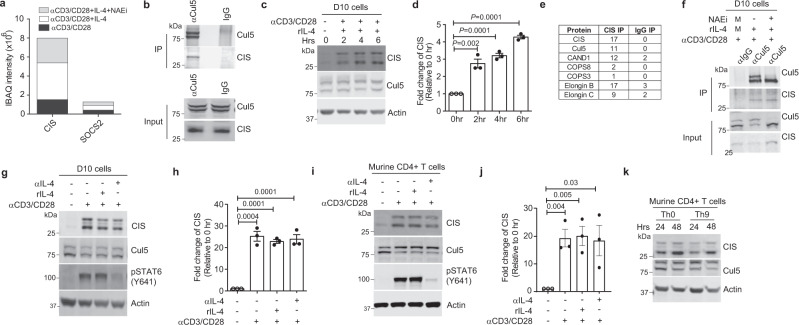
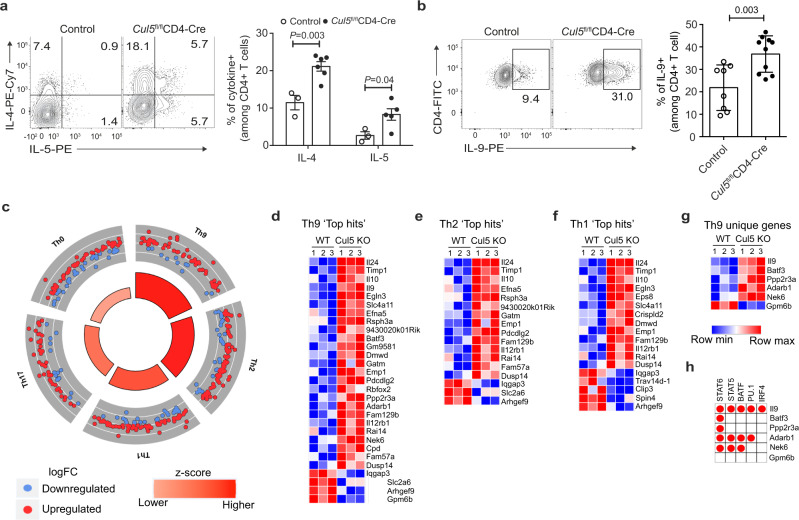
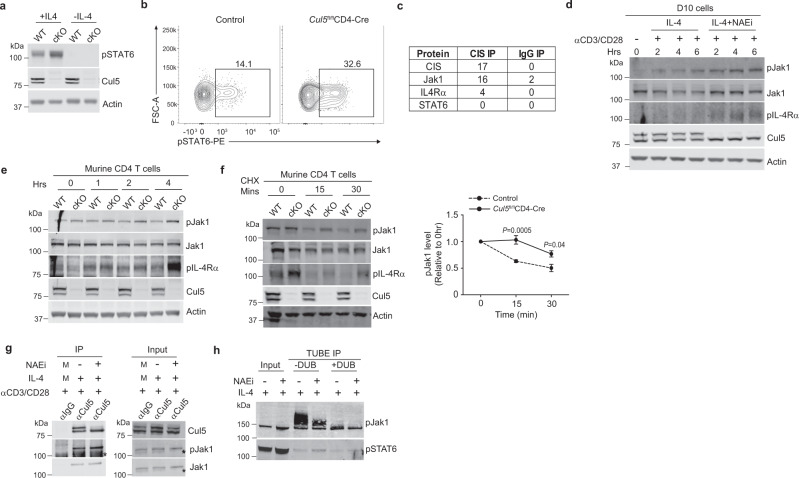
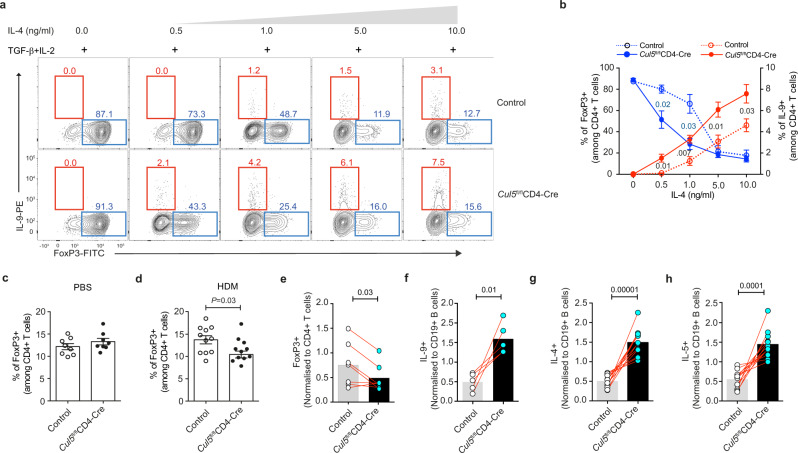
Antigen encounter directs CD4+ T cells to differentiate into T helper or regulatory cells. This process focuses the immune response on the invading pathogen and limits tissue damage. Mechanisms that govern T helper cell versus T regulatory cell fate remain poorly understood. Here, we show that the E3 ubiquitin ligase Cul5 determines fate selection in CD4+ T cells by regulating IL-4 receptor signaling. Mice lacking Cul5 in T cells develop Th2 and Th9 inflammation and show pathophysiological features of atopic asthma. Following T cell activation, Cul5 forms a complex with CIS and pJak1. Cul5 deletion reduces ubiquitination and subsequent degradation of pJak1, leading to an increase in pJak1 and pSTAT6 levels and reducing the threshold of IL-4 receptor signaling. As a consequence, Cul5 deficient CD4+ T cells deviate from Treg to Th9 differentiation in low IL-4 conditions. These data support the notion that Cul5 promotes a tolerogenic T cell fate choice and reduces susceptibility to allergic asthma.


Conflict of interest statement

The authors declare no competing interests.

Figures

Fig. 1
Fig. 1. Cul5 expression and activation increased following CD4+ T cell stimulation.
Immunoblot analysis showing neddylated and unneddylated forms of Cul5 in CD4+ T cells. a CD4+ T cells were stimulated with anti-CD3 and anti-CD28 for 48 h after which cells were washed and kept in IL-2 containing media referred as “Resting media”. Resting murine CD4+ T cells were either “stimulated” with anti-CD3 and anti-CD28 for 4hrs or kept in IL-2 containing “resting” media. Nedd8 inhibitor (MLN4924) (NAEi, 1 μM) was added during the final 1 h of restimulation. n = 3 biologic replicates were examined in three independent experiments. b Naive CD4+ T cells were stimulated with anti-CD3 and anti-CD28 for the indicated time, after 72 h cells were transferred to fresh IL-2 containing media n = 3 biologic replicates were examined in three independent experiments. c Schematic of Cul5 gene with loxP insertions. d Immunoblot showing expression of Cul5 in CD4+ T cells isolated from spleens of control and Cul5fl/flCD4-Cre mice. n = 3 biologic replicates were examined in three independent experiments. e Representative flow plots showing the frequencies of CD4+ and CD8+ T cells in each thymus. f Bar graphs show the compiled data for the frequencies of CD4+ and CD8+ T cells in thymi. n = 6 biologic replicates for each genotype were examined in two independent experiments. g Representative flow plots showing the frequencies of CD62L+ (Naïve) and CD44+CD4+ T cells from spleens, lymph nodes, and lungs of Cul5fl/flCD4-Cre and control mice. h Compiled data showing the frequencies of CD44+CD4+ cells from lungs of Cul5fl/flCD4-Cre and control mice. n = 20 WT and n = 22 Cul5fl/flCD4-Cre animals were examined in seven independent experiments. Data in panels f, h are presented as Mean ±  SEM. p-values were calculated using an unpaired two-tailed t-test. Source data are provided in the Source Data file.
Fig. 2
Fig. 2. Cul5fl/flCD4-Cre mice develop an unprovoked Th2-mediated lung inflammation.
8–10 or 30–36 week old control and Cul5fl/flCD4-Cre mice were analyzed. Hematoxylin and Eosin (H&E) and Periodic Acid Schiff (PAS) stain of lung sections. Representative image of stains of lung sections from 8–10-week-old (a) and 30–36 week old (b) mice. Bar graph showing the number of nuclei (c) enumerated by Aperio ImageScope software in 100 mm2 area of lungs. PAS score (d) of the lung sections. For a and c, n = 5 for 8–10 week old control and Cul5fl/flCD4-Cre mice; for 30–36 week old n = 6 control; 7 Cul5fl/flCD4-Cre mice. For b and d n = 7 control and Cul5fl/flCD4-Cre mice examined over two independent experiments; Scale bars, 200 μM, zoomed image of PAS is shown in right. e, f Representative flow plots showing the percentages of IL-5+ and IL-13+ cells among CD44+CD4+ T cells from lung. g Compiled data showing the frequencies of IL5+ cells in 8–10 week old mice n = 9 control; n = 13 Cul5fl/flCD4- Cre examined over four independent experiments, and 30–36 week old mice n = 10 control; n = 11 Cul5fl/flCD4-Cre examined in 3 independent experiments. h Numbers of IL-5+ cells in 8–10-week old mice n = 5 control; n = 8 Cul5fl/flCD4- Cre, examined in three independent experiments, and 30–36-week-old mice, n = 8 control; n = 9 Cul5fl/flCD4-Cre, examined in two independent experiments. i Frequencies and j number of IL-13+ cells in lungs. For 8–10 week old mice n = 6 control, n = 8 Cul5fl/flCD4-Cre, examined in 3 independent experiments; for 30–36 week old mice n = 7 control, n = 6 Cul5fl/flCD4-Cre, examined in two independent experiments. k Frequencies of eosinophils in the lungs. For 8–10- week old mice, n = 7 control, 8 Cul5fl/flCD4-Cre examined in three independent experiments, and for 30–36-week-old, n = 6 mice examined in two independent experiments. k Number of eosinophils in the lungs of 8–10- week old mice, n = 7 control, n = 9 Cul5fl/flCD4-Cre, examined in three independent experiments, and for 30–36-week-old, n = 6 control and Cul5fl/flCD4-Cre mice examined in two independent experiments. m Serum IgE levels. For 8–10 week old mice, n = 9 control and Cul5fl/flCD4-Cre mice examined in three independent experiments, and for 30–36-week-old mice, n = 13 control, n = 14 Cul5fl/flCD4-Cre, examined over 4 independent experiments. Serum IgG1 levels. For 8–10 week old, n = 12 control and Cul5fl/flCD4-Cre mice examined in three independent experiments, and for 30–36-week-old mice, n = 10 control, n = 11 Cul5fl/flCD4-Cre, examined over three independent experiments. Data is presented as Mean ± SEM in panels c, d, gn. p-value is calculated by unpaired two-tailed t-test. AW Airways; BV-blood vessel. Source data are provided as a Source Data file.
Fig. 3
Fig. 3. Cul5fl/flCD4-Cre mice develop Th9-associated lung remodeling and airways hyperresponsiveness after allergen challenge.
8–10 week old control and Cul5fl/flCD4-Cre mice were treated with HDM or PBS. Hematoxylin and Eosin (H&E) and Periodic Acid-Schiff (PAS) stain of lungs. Representative image (a) of H&E and PAS stain (combined data shown in panels b and c). Bar graph (b) showing the number of nuclei enumerated by Aperio ImageScope software in 100 mm2 area. n = 6 control, n = 7 Cul5fl/flCD4-Cre, examined in two independent experiments. Bar graph showing PAS score (c) in lungs. n = 7 control and Cul5fl/flCD4-Cre mice, examined in two independent experiments. Total number of eosinophils (d), T cells (e), and CD4+ T cells (f) in BALF. n = 4 control, n = 5 Cul5fl/flCD4-Cre examined in 1 experiment. Frequencies (g) and numbers (h) of eosinophils in the lungs. n = 7 for Cul5fl/flCD4-Cre HDM animals; n = 8 for all other groups examined in two independent experiments. i Percentages of IL-5+ cells in lungs. For PBS group, n = 8 control and Cul5fl/flCD4-Cre mice, examined over two independent experiments. For HDM group n = 10 control, n = 12 Cul5fl/flCD4-Cre mice, examined in three independent experiments. j IL-5+ cell numbers in lungs. n = 12 control and Cul5fl/flCD4-Cre mice examined in three independent experiments. Frequencies (k) and numbers (l) of IL-13+ cells. For PBS group, n = 4 control, n = 5 Cul5fl/flCD4-Cre, examined in one experiment. For HDM group, n = 7 control, n = 11 Cul5fl/flCD4-Cre, examined in two independent experiments. Frequencies (m) and numbers (n) of IL-9+ cells. For PBS group n = 8 control and Cul5fl/flCD4-Cre mice. For HDM group n = 7 control and Cul5fl/flCD4-Cre mice, examined in two independent experiments. Frequencies (o) and numbers (p) of mast cells (FcεRIαhic-Kithi). For PBS group n = 4 control, n = 5 Cul5fl/flCD4-Cre examined in one experiment. For HDM group n = 7 control, n = 11 Cul5fl/flCD4-Cre, examined in two independent experiments. q Airways resistance measured by forced inspiration using Buxco® FinePointe system in mice administered with increasing doses of methacholine. For PBS group n = 8 control and Cul5fl/flCD4-Cre mice; for HDM group n = 7 control and Cul5fl/flCD4-Cre mice, examined in two independent experiments. Data is presented as Mean ± SEM in panels bq. p-value is calculated by unpaired two-tailed t-test. Source data are provided as a Source Data file.
Fig. 4
Fig. 4. CIS (Cytokine inducible SH2 protein) acts as a substrate receptor for CRL5.
a IBAQ intensities for CIS and SOCS2 proteins. CD4+ T cells from 8–10-week-old mice were restimulated for 4 h with either anti-CD3 and anti-CD28, or anti-CD3 and anti-CD28 in the presence of IL-4, or anti-CD3 and anti-CD28 in the presence of IL-4 and treated with Neddylation inhibitor (NAEi) for the final one hour. After the respective treatment, the lysates were immunoprecipitated by anti-Cul5 or IgG antibodies, and samples were analyzed by mass spectrometry. n = 2 biologic replicates of cells examined in two independent experiments. b Immunoblot showing interaction of Cul5 and CIS in primary CD4+ T-cells. n = 2 biologic replicates of cells examined in two independent experiments. Representative Immunoblot (c) and fold change in CIS expression (d) in D10 cells. n = 3 biologic replicates of cells examined in three independent experiments. To calculate fold change, the normalized CIS level at 0 h was adjusted to 1 and the relative change in the expression of CIS protein was calculated accordingly. e Table showing components of the CRL5 E3 ubiquitin complex that were identified by CIS IP and IgG IP in D10 cells. Cells were stimulated in the presence of IL-4 and NAEi for 4 h. Total number of peptides identified in IP is listed in the table. n = 2 biologic replicates of cells examined in two independent experiments. f Immunoblot of Cul5 IP showing its interaction with CIS in D10 cells. n = 3 biologic replicates of cells examined in three independent experiments. Immunoblot (g) and fold change (h) of CIS in D10 cells stimulated in the presence of exogenous IL-4 or anti-IL-4 for 4 h. n = 3 biologic replicates of cells examined in three independent experiments. Immunoblot (i) and fold change of CIS protein (j) in murine CD4+ T-cells isolated from 8–10-week-old mice. n = 3 biologic replicates of cells examined in three independent experiments. k Immunoblot showing expression of CIS protein in murine CD4+ T cells. n = 3 biologic replicates of cells examined in three independent experiments. Data is presented as Mean ± SEM in panels d, h and j. p-value was calculated using unpaired two tailed t-test. Source data are provided as Source Data file.
Fig. 5
Fig. 5. Cul5-deficient CD4+ T cells show an increased Th9 gene signature.
Naïve CD4+ T cells from 8–10-week-old control and Cul5fl/flCD4-Cre mice were isolated and cultured in Th2 and Th9 polarising conditions. a Left panel shows the representative flow plot for IL-4+ and IL-5+ cells under Th2 polarizing condition. The bar graph on right shows the consolidated data. For IL-4+ cells, n = 3 control, n = 6 Cul5fl/flCD4-Cre, for IL-5+ cells, n = 3 control, n = 5 Cul5fl/flCD4-Cre, examined in two independent experiments. b Left panel shows the representative flow plot for IL-9+ cells in control and Cul5fl/flCD4-Cre CD4+ T cells cultured under Th9 polarizing conditions. The bar graph on the right shows the consolidated data for n = 8 control, n = 10 Cul5fl/flCD-Cre, examined in four independent experiments. ch RNASeq analysis was used to measure the transcript levels in control and Cul5 deleted CD4+ T cells cultured for 2 days in Th9 polarizing condition. n = 3 control and Cul5fl/flCD4-Cre CD4+ T cells examined in one experiment. c Ontological analysis of the differentially regulated genes, calculated by GOplot algorithm is shown. Circle plots depict the enrichment of genes associated with particular Th subtype. Greater the size of the inner trapezoids represents greater -log10 value (adj. p-value). Heatmap of Th subtypes. To generate heat maps, we first selected genes that were enriched in different Th subtype compared to naïve CD4 T cells from publicly available dataset. We selected 200 most differentially regulated genes for each subtype and classified these as top hit genes. We then compared these top hits genes to the differentially regulated genes from our RNAseq dataset and to generate heatmaps. Heatmap of top hit genes identified in Th9 (d), Th2 (e), and Th1 (f) subtypes that were also differentially regulated in WT and Cul5 deficient CD4+ T cells. g Heatmap of top hit genes which were identified exclusively in Th9 subtype. h The red circle in the table indicates the binding sites for the respective transcription factors present in the particular gene. Data is presented as Mean ±SEM in panels a, b. p-value was calculated using unpaired two tailed t-test. Source data are provided as a Source Data file.
Fig. 6
Fig. 6. CRL5 ubiquitinates and degrades pJak1.
CD4+ T cells isolated from 8–10 week old mice were stimulated for 24hrs washed and treated with 0.25 ng/ml IL-4 for 5 min in plain RPMI media. a Immunoblot showing pSTAT6 levels in control and Cul5fl/flCD4-Cre CD4+ T cells. n = 3 biologic replicates of cells examined in two independent experiments. b Flow plots showing pSTAT6 level in control and Cul5fl/flCD4-Cre CD4+ T cells by flow cytometry. n = 4 biologic replicates of cells examined in two independent experiments. c Table showing components of the IL-4 signaling pathway co-precipitated with CIS IP or IgG IP in D10 cells. n = 2 biologic replicates of cells examined in two independent experiments. d Immunoblot in D10 cells treated with IL-4 or IL-4+NAEi for the indicated time. n = 3 biologic replicates of cells examined in three independent experiments. e Immunoblot of control and Cul5 deficient CD4+ T cells isolated from 8–10-week-old mice. Cells were treated with IL-4 for the indicated time. n = 3 biologic replicates of cells examined in three independent experiments. f Immunoblot of WT and Cul5 deficient CD4+ T cells stimulated with anti-CD3 and anti-CD28 for 48 h in the presence of anti-IL-4. Cells were then washed, stimulated with IL-4 for 2 h and washed again, and treated with anti-IL-4 along with CHX for the indicated time. Graph on the right shows pJak1 levels upon CHX treatment relative to 0 h. n = 3 biologic replicates of cells examined in three independent experiments. g Immunoblot of Cul5 IP in D10 cells. n = 3 biologic replicates of cells examined in three independent experiments M: Similar amounts of lysate from all conditions was pooled for that sample. h Representative immunoblot of TUBE immunoprecipitation. D10 cells were stimulated with anti-CD3 and anti-CD28 for 4 h in the presence of IL-4 or IL-4 and NAEi. Cells were lysed and subjected to TUBE IP. The enriched fraction was divided into two parts, one part was treated with DUB and other was left untreated. 3% lysate was used for input (n = 2 biologic replicates of cells examined in two independent experiments). Data is presented as mean ± SEM in panel f. p-value was calculated by unpaired two tailed t test. Source data are provided as a Source Data file.
Fig. 7
Fig. 7. Cul5 regulates fate choice in CD4+ T cells.
a Representative flow plots showing the frequencies of FoxP3+ and IL-9+ cells. Naive CD4+ T cells from control and Cul5fl/flCD4-Cre mice were cultured in iTreg polarizing (TGF-β + IL2 + anti-IFNγ) condition with increasing concentrations of IL-4. Cells were stained for FoxP3 and IL-9 on day 5. b Compiled data of (a) showing the frequencies of FoxP3+ (blue) and IL-9+ (red) cells. For FoxP3+ cells, n = 3 control, n = 4 Cul5fl/flCD4-Cre, for IL9+ cells n = 4 control, n = 5 Cul5fl/flCD4-Cre biologic replicates of cells examined in three independent experiments. c Compiled data showing the frequencies of FoxP3+ cells in 8–10-week-old control and Cul5fl/flCD4-Cre mice treated with PBS. n = 8 control and Cul5fl/flCD4-Cre mice examined in two independent experiments. (d) HDM treated mice n = 11 control and Cul5fl/flCD4-Cre mice examined in three independent experiments. Mixed bone marrow chimeras. 6–8-weeks-old Rag1-/- deficient recipients were sublethally irradiated and then injected with a 1:1 mixture of control (CD45.1+) and Cul5fl/flCD4-Cre (CD45.2+) donor bone marrow cells and allowed to reconstitute for 8 weeks. These mice were then treated with a 2-week regimen of house dust mite (HDM), and their lung cells were analyzed by flow cytometry. e Proportion of FoxP3+ cells that came from each donor. The percent of control (CD45.1+) and Cul5fl/flCD4-Cre (CD45.2+) FoxP3+ cells was normalized to the percent of CD4+ T cells from the same donor. n = 7 recipient mice were examined in two independent experiments. Two donors of each genotype were used to reconstitute these recipients. Each recipient received cells from one mouse of each genotype. Proportion of cytokine producing cells. To calculate the contribution from each donor CD45.1 “cytokine+” cells or CD45.2 “cytokine+” cells were normalized to CD19+ cells. f Proportion of IL-9+ cells from CD45.1 (WT) and CD45.2 (Cul5 deficient), n = 5 recipients were examined in one experiment. g-h Proportion of IL-4+ and IL-5+ cells, n = 12 recipients were examined in two independent experiments. Data is presented as mean±SEM in panels bd. In panels e-h data is represented as mean. p-value was calculated by unpaired two tailed t-test used in panels b-d and paired two-tailed t-test in panels e-h. Source data are provided as a Source Data file.

Similar articles

Cited by

References

    1. Zhu J, Yamane H, Paul WE. Differentiation of effector CD4 T cell populations (*) Annu. Rev. Immunol. 2010;28:445–489. doi: 10.1146/annurev-immunol-030409-101212. - DOI - PMC - PubMed
    1. Luckheeram RV, Zhou R, Verma AD, Xia B. CD4(+)T cells: differentiation and functions. Clin. Dev. Immunol. 2012;2012:925135. doi: 10.1155/2012/925135. - DOI - PMC - PubMed
    1. Chatzileontiadou, D. S. M., Sloane, H., Nguyen, A. T., Gras, S. & Grant, E. J. The many faces of CD4(+) T cells: Immunological and structural characteristics. Int. J. Mol. Sci. 22 (2020). - PMC - PubMed
    1. Valencia X, Lipsky PE. CD4+CD25+FoxP3+ regulatory T cells in autoimmune diseases. Nat. Clin. Pr. Rheumatol. 2007;3:619–626. doi: 10.1038/ncprheum0624. - DOI - PubMed
    1. Zhu J, Paul WE. CD4 T cells: fates, functions, and faults. Blood. 2008;112:1557–1569. doi: 10.1182/blood-2008-05-078154. - DOI - PMC - PubMed

Publication types