. 2022 May 19;9(1):220.
doi: 10.1038/s41597-022-01339-w.

Monitoring microseismicity of the Hengill Geothermal Field in Iceland

Affiliations

Monitoring microseismicity of the Hengill Geothermal Field in Iceland

Francesco Grigoli et al. Sci Data. .

Abstract

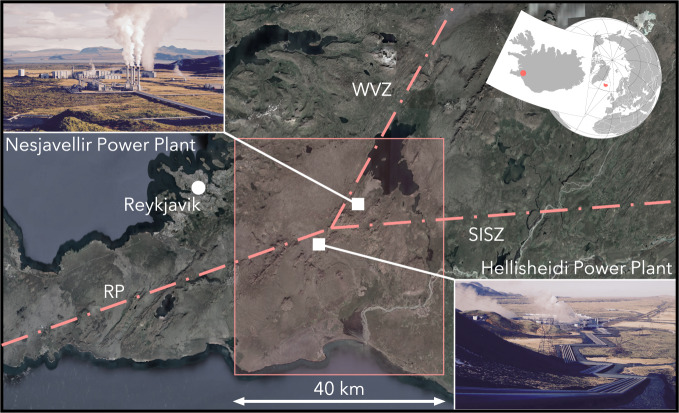
Induced seismicity is one of the main factors that reduces societal acceptance of deep geothermal energy exploitation activities, and felt earthquakes are the main reason for closure of geothermal projects. Implementing innovative tools for real-time monitoring and forecasting of induced seismicity was one of the aims of the recently completed COSEISMIQ project. Within this project, a temporary seismic network was deployed in the Hengill geothermal region in Iceland, the location of the nation's two largest geothermal power plants. In this paper, we release raw continuous seismic waveforms and seismicity catalogues collected and prepared during this project. This dataset is particularly valuable since a very dense network was deployed in a seismically active region where thousand of earthquakes occur every year. For this reason, the collected dataset can be used across a broad range of research topics in seismology ranging from the development and testing of new data analysis methods to induced seismicity and seismotectonics studies.


Conflict of interest statement

The authors declare no competing interests.

Figures

Fig. 1
Fig. 1
Map of the Hengill area (south-west Iceland) showing the demonstration site of COSEISMIQ (red shaded area), which is a triple junction between the Reykjanes Peninsula oblique rift (RP), the Western Volcanic Zone (WVZ), and the transform-type South Iceland Seismic Zone (SISZ). The white squares are the location of the geothermal power plants.
Fig. 2
Fig. 2
Map of the seismic stations in the Hengill area during the COSEISMIQ experiment. The azimuthal gap for the region using the extended network (COSEISMIQ + ISOR + IMO) is represented by the colour (Left panel). Seismic waveforms (Z component, bandpass filtered between 2 and 50 Hz) from a magnitude ML 1.6 seismic event that occurred on 1.1.2019 at the south edge of the network, Latitude 63.945°N, Longitude −21.327°E at a depth of 7.0 km (Right panel).
Fig. 3
Fig. 3
Seismic waveforms and amplitude spectra of the event occurred on 01 January 2019 with magnitude 1.1 recorded by the broadband STS-2 at the station BIT06. The raw, unfiltered waveforms and the amplitude spectrum are shown in blue; the red lines refer to the waveform and amplitude spectrum after filtering between 2–50 Hz.
Fig. 4
Fig. 4
Seismicity location for the low (left panel), medium (central panel) and high (right panel) quality catalogues. Event score associated to each event is color coded, in grey events with an event score S≤−5, in light blue the events with events score −5 < S < −1, and in dark blue the events with events score S ≥ −1. Location of seismic stations in yellow.
Fig. 5
Fig. 5
Temporal evolution of seismicity for the high, medium and low quality catalogues. Each event is indicated by a dot. The score associated to each event is color coded, in grey events with an event score S ≤ −5, in light blue the events with events score −5 < S < −1, and in dark blue the events with events score S ≥ −1. The cumulative number of events is indicated by the red line.
Fig. 6
Fig. 6
Comparison of locations from the absolute (high quality) and double difference catalogues.The location of the seismic stations are indicated by yellow triangles.
Fig. 7
Fig. 7
Comparison between the automatic (blue) and ISOR manual (red) seismic events. The comparison is performed for low (left panel), medium (central panel) and high (right panel) quality catalogues.
Fig. 8
Fig. 8
Cumulative distribution of the distances between the automated and manual locations (hypocentral distances) for each matched event in the 3 catalogues. Results for low (grey color), medium (light blue) and high (dark blue) quality catalogues. Note that we plot the cumulative only up to 10 km distance in order to aid visualization, a small fraction of events have location distances in excess of 10 km.

References

    1. Ellsworth WL. Injection-induced earthquakes. Science. 2013;341(6142):1225942. doi: 10.1126/science.1225942. - DOI - PubMed
    1. Grigoli F, et al. The November 2017 Mw 5.5 Pohang earthquake: A possible case of induced seismicity in South Korea. Science. 2018;360(6392):1003–1006. doi: 10.1126/science.aat2010. - DOI - PubMed
    1. Woo JU, et al. An in‐depth seismological analysis revealing a causal link between the 2017 MW 5.5 Pohang earthquake and EGS project. Journal of Geophysical Research: Solid Earth. 2019;124(12):13060–13078. doi: 10.1029/2019JB018368. - DOI
    1. Lee KK, et al. Managing injection-induced seismic risks. Science. 2019;364(6442):730–732. doi: 10.1126/science.aax1878. - DOI - PubMed
    1. Broccardo M, et al. Induced seismicity risk analysis of the hydraulic stimulation of a geothermal well on Geldinganes, Iceland. Natural Hazards and Earth System Sciences. 2020;20(6):1573–1593. doi: 10.5194/nhess-20-1573-2020. - DOI

Publication types