. 2022 May 19;13(1):2757.
doi: 10.1038/s41467-022-30391-8.

Noninvasive urinary protein signatures associated with colorectal cancer diagnosis and metastasis

Affiliations

Noninvasive urinary protein signatures associated with colorectal cancer diagnosis and metastasis

Yulin Sun et al. Nat Commun. .

Abstract

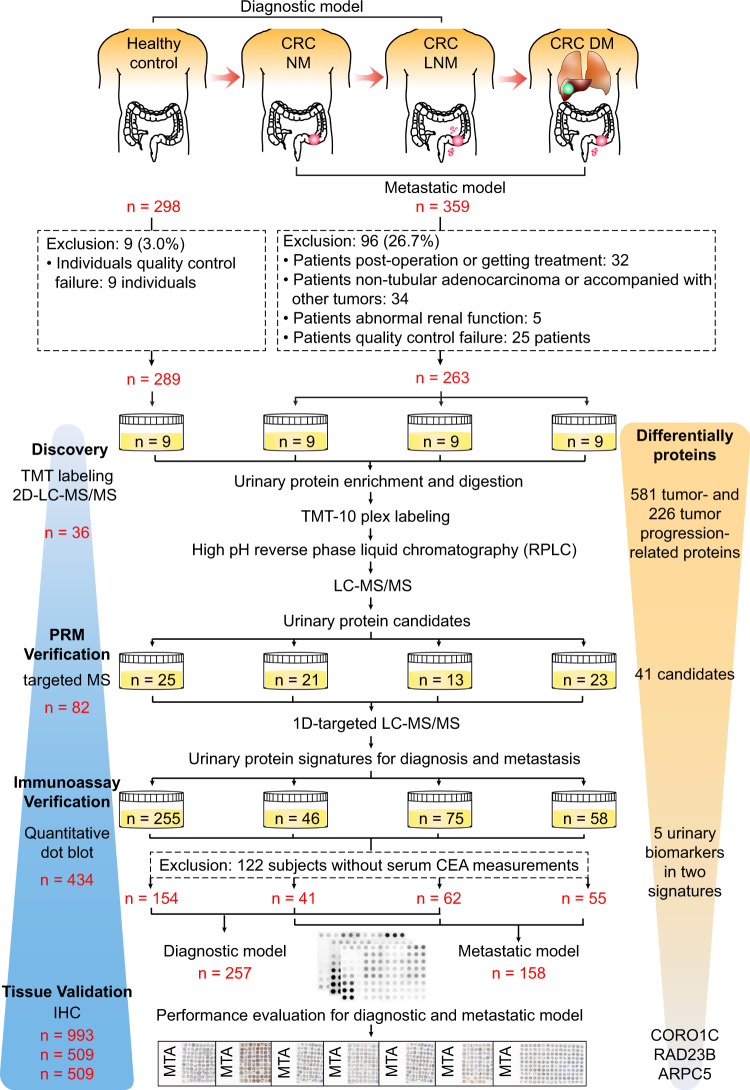
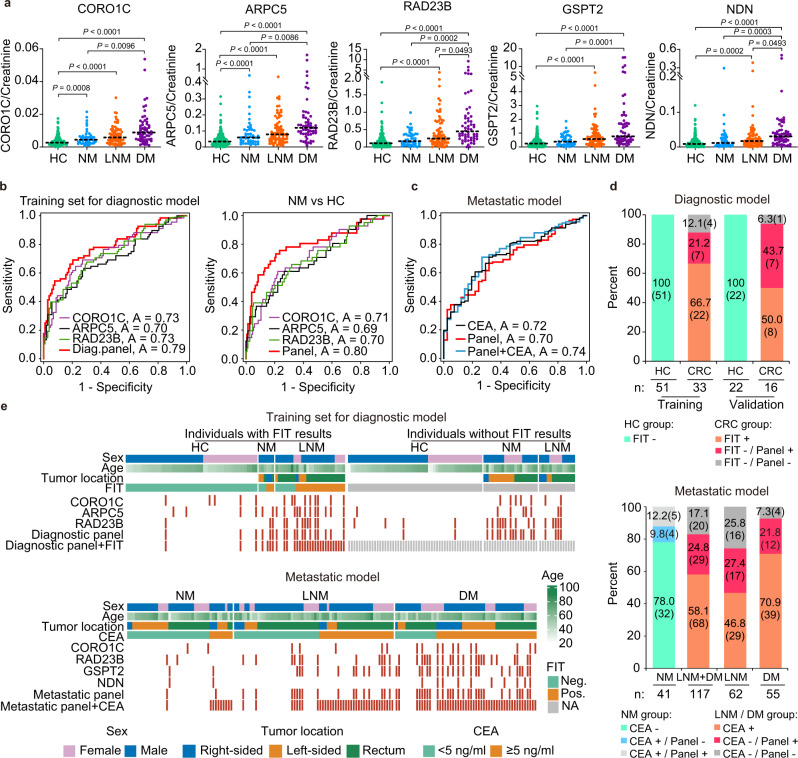
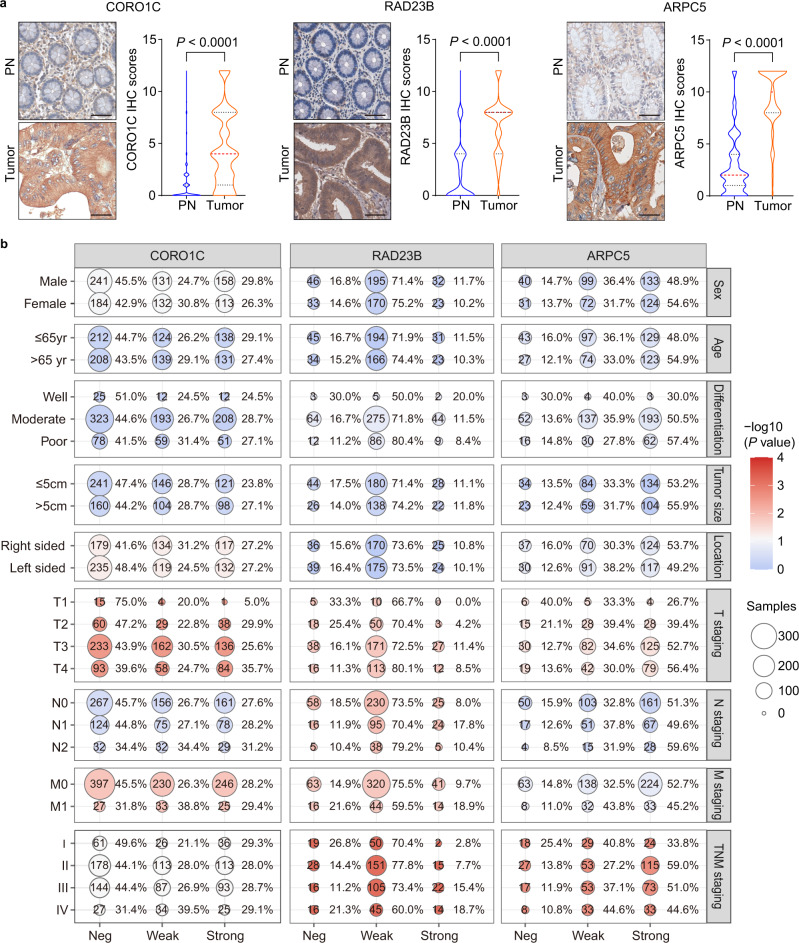
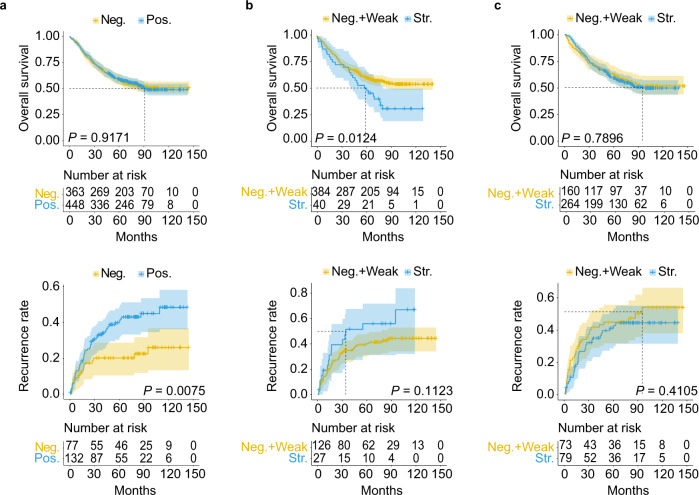
Currently, imaging, fecal immunochemical tests (FITs) and serum carcinoembryonic antigen (CEA) tests are not adequate for the early detection and evaluation of metastasis and recurrence in colorectal cancer (CRC). To comprehensively identify and validate more accurate noninvasive biomarkers in urine, we implement a staged discovery-verification-validation pipeline in 657 urine and 993 tissue samples from healthy controls and CRC patients with a distinct metastatic risk. The generated diagnostic signature combined with the FIT test reveals a significantly increased sensitivity (+21.2% in the training set, +43.7% in the validation set) compared to FIT alone. Moreover, the generated metastatic signature for risk stratification correctly predicts over 50% of CEA-negative metastatic patients. The tissue validation shows that elevated urinary protein biomarkers reflect their alterations in tissue. Here, we show promising urinary protein signatures and provide potential interventional targets to reliably detect CRC, although further multi-center external validation is needed to generalize the findings.


Conflict of interest statement

The authors declare no competing interests.

Figures

Fig. 1
Fig. 1. The overall workflow of study sample inclusion and exclusion criteria as well as the discovery, PRM verification, immunoassay verification, and tissue validation for CRC urine biomarkers.
The detailed inclusion and exclusion criteria of the samples are shown. CRC patients were divided into three groups by metastatic status: patients without metastases (NM), patients with lymph node metastasis (LNM), and patients with distant metastasis (DM). The four-stage workflow consisted of a series of mass spectrometry (MS) and immunoassay-based approaches, including the tandem mass tag (TMT) labeling-2D-LC-MS/MS quantitative proteomic strategy, parallel reaction monitoring (PRM)-based targeted proteomic method, quantitative dot blot analysis and tissue immunohistochemistry (IHC), to construct a coherent and high-throughput cancer biomarker method in urine. CRC colorectal cancer, MTA multi-tissue array.
Fig. 2
Fig. 2. Quantitative urinary proteomics analysis in CRC at the discovery stage.
a Score plot of unsupervised principal component analysis (PCA) overview of urinary proteomics among the healthy controls (HCs), CRC without metastases (NM), CRC with lymph node metastasis (LNM) and CRC with distant metastasis (DM) groups. b, c CRC tumor-related (three CRC groups vs. HC; b) and tumor progression-related (c) pathway networks. Pathways are grouped vertically into three classes: disease, function, and canonical pathways. The color of each node represents the −log10 (P value) of that pathway. The size of each node represents the number of differential proteins in that pathway/disease/function. Interactions between pairs of pathways are indicated by curves. d Heatmap of the dysregulated biofunctions in the three CRC patient groups depicted by IPA. Red: Z_score>0, activated; Blue: Z score<0, inhibited. e Heatmap of the dysregulated canonical pathways in the three CRC groups depicted by IPA. The color represents the −log10 (P value) of that pathway. f Schematic diagram of tumor progression-related pathways, including the RAC, CDC42, FAK, and RhoA signaling pathways. The protein levels in the HC, NM, LNM, and DM groups are shown. The color and the size of the circle within each gene represent the expression levels of different stages of CRC for each gene. CRC colorectal cancer, IPA ingenuity pathway analysis. In b, c, e, the P value is calculated using the right-tailed Fisher’s exact test without adjustments. The source data are provided in Source Data.
Fig. 3
Fig. 3. Generation of the CRC urinary protein biomarker signature.
a Unsupervised clustering analysis of 41 deregulated proteins in the four groups (HC, healthy controls; NM, CRC without metastases; LNM, CRC with lymph node metastasis; DM, CRC with distant metastasis) based on PRM data. b Variable importance plots produced by the random forest algorithm measured as each variable’s mean decrease in accuracy. The most important predictors have the highest mean decrease accuracy values. Left panel, for the class of CRC patients vs. HCs (diagnostic model); right panel, for the class of patients with metastasis (LNM and DM) vs. NM (metastatic model). c The AUC was used to evaluate the ability of individual proteins to distinguish between CRC patients and HCs (left panel; diagnostic model) as well as between patients with metastasis and those without metastasis (right panel; metastatic model). d The AUC of combining any two variables was calculated and shown as matrix plots for the diagnostic model and metastatic model. The proteins that show superior discrimination and complementarity are marked in red. e ROC curves for the diagnostic model (NM + LNM vs. HC) to discriminate the HC group from the CRC group (NM + LNM) or NM group (stage I + stage II). f ROC curves for the metastatic model (LNM + DM vs. NM). The performance of the selected protein signature and individual proteins were compared. CRC colorectal cancer; PRM parallel reaction monitoring; ROC, receiver operating characteristic, AUC area under ROC curve, Diag. panel, diagnostic panel, Meta. panel metastatic panel. The source data are provided in Source Data.
Fig. 4
Fig. 4. Independent urine verification of the urinary protein signature using dot blot analysis.
a Scatter plot for CORO1C, ARPC5, RAD23B, GSPT2, and NDN in 255 healthy controls (HCs) and 179 CRC patients, including CRC without metastases (NM; n = 46), CRC with lymph node metastasis (LNM; n = 75) and CRC with distant metastasis (DM; n = 58). The median values in each group are shown as black dotted lines. The differences between groups for each marker were analyzed by two-sided Kruskal–Wallis test followed by a Dunn’s multiple comparisons test. Uncropped original blots in Source Data. b ROC curve of the diagnostic panel for the diagnostic model (NM + LNM vs. HC) in the training set and discrimination of the NM group CRC from HC. c ROC curve of serum CEA, metastatic panel, and the combination of the metastatic panel and CEA for the metastatic model (LNM + DM vs. NM). d Diagnostic and metastatic predictive power of the diagnostic signature and metastatic signature in the individuals who were misdiagnosed by the FIT test or serum CEA. The values in parentheses indicate the number of samples corresponding to each percent. +, positive; −, negative; n, number of samples. e Heatmap of the dot plot data for single urinary markers as well as the diagnostic or metastatic panel with a specificity of 95%, and the combination of corresponding clinical biomarker indices for the diagnostic or metastatic model was considered positive when either the panel or FIT/CEA was positive. Red: positive using the cutoff value with a specificity of 95%. The FIT test, serum CEA, tumor location, sex, and age are indicated by color-coding. CRC colorectal cancer, FIT fecal immunochemical test, CEA carcinoembryonic antigen, Neg. negative; Pos. positive; NA not available. The source data are provided in Source Data.
Fig. 5
Fig. 5. Immunohistochemical staining of three diagnostic biomarkers in tissues and their clinical significance.
a Representative immunohistochemistry images and score distribution of CORO1C, RAD23B, and ARPC5 expression in paracarcinoma normal tissues (PN) and CRC tumors (tumor). The median and quartile values in each group of individuals are shown as thick red dash lines and thin black dotted lines, respectively. Scale bar: 50 μm. The statistical analysis was performed by two-sided Mann–Whitney rank test. b The balloon plot for the clinical significance of CORO1C, RAD23B, and ARPC5 in colon adenocarcinoma patients with distinct staining intensities. The number in the circle is the sample size, and the percentage next to the circle is the corresponding percentage. Chi-square test was used for calculating the two-sided P values. Neg negative, Weak weak expression, Str. strong expression. The source data are provided in Source Data.
Fig. 6
Fig. 6. Kaplan–Meier survival analysis of three diagnostic biomarkers in patients with colorectal adenocarcinoma.
a, b, c The overall survival (OS) and recurrence-free survival (RFS) curves of CORO1C (a), RAD23B (b), and ARPC5 (c). The survival curve with 95% confidence interval in shading was plotted for each group. P values were calculated by two-sided log-rank test. The numbers at the bottom of each panel indicate the patients at risk. Neg. negative, Pos. positive, Weak weak expression, Str. strong expression. The source data are provided in Source Data.

Similar articles

Cited by

References

    1. Bray F, et al. Global cancer statistics 2018: GLOBOCAN estimates of incidence and mortality worldwide for 36 cancers in 185 countries. CA Cancer J. Clin. 2018;68:394–424. doi: 10.3322/caac.21492. - DOI - PubMed
    1. Arnold M, et al. Global patterns and trends in colorectal cancer incidence and mortality. Gut. 2017;66:683–691. doi: 10.1136/gutjnl-2015-310912. - DOI - PubMed
    1. Siegel RL, et al. Colorectal cancer statistics, 2017. CA Cancer J. Clin. 2017;67:177–193. doi: 10.3322/caac.21395. - DOI - PubMed
    1. Kekelidze M, D’Errico L, Pansini M, Tyndall A, Hohmann J. Colorectal cancer: current imaging methods and future perspectives for the diagnosis, staging and therapeutic response evaluation. World J. Gastroenterol. 2013;19:8502–8514. doi: 10.3748/wjg.v19.i46.8502. - DOI - PMC - PubMed
    1. Sahani DV, Bajwa MA, Andrabi Y, Bajpai S, Cusack JC. Current status of imaging and emerging techniques to evaluate liver metastases from colorectal carcinoma. Ann. Surg. 2014;259:861–872. doi: 10.1097/SLA.0000000000000525. - DOI - PubMed

Publication types