. 2022 May 19;13(1):2810.
doi: 10.1038/s41467-022-30558-3.

Target receptor identification and subsequent treatment of resected brain tumors with encapsulated and engineered allogeneic stem cells

Affiliations

Target receptor identification and subsequent treatment of resected brain tumors with encapsulated and engineered allogeneic stem cells

Deepak Bhere et al. Nat Commun. .

Retraction in

Abstract

Cellular therapies offer a promising therapeutic strategy for the highly malignant brain tumor, glioblastoma (GBM). However, their clinical translation is limited by the lack of effective target identification and stringent testing in pre-clinical models that replicate standard treatment in GBM patients. In this study, we show the detection of cell surface death receptor (DR) target on CD146-enriched circulating tumor cells (CTC) captured from the blood of mice bearing GBM and patients diagnosed with GBM. Next, we developed allogeneic "off-the-shelf" clinical-grade bifunctional mesenchymal stem cells (MSCBif) expressing DR-targeted ligand and a safety kill switch. We show that biodegradable hydrogel encapsulated MSCBif (EnMSCBif) has a profound therapeutic efficacy in mice bearing patient-derived invasive, primary and recurrent GBM tumors following surgical resection. Activation of the kill switch enhances the efficacy of MSCBif and results in their elimination post-tumor treatment which can be tracked by positron emission tomography (PET) imaging. This study establishes a foundation towards a clinical trial of EnMSCBif in primary and recurrent GBM patients.


Conflict of interest statement

K.S. owns equity in and is a member of the Board of Directors of AMASA Therapeutics, a company developing stem cell-based therapies for cancer. D.B. owns equity in and is a consultant at AMASA Therapeutics. K.S.’s and D.B.’s interests were reviewed by Brigham and Women’s Hospital and Mass General Brigham in accordance with their conflict-of-interest policies. The other authors declare that they have no competing interests.

Figures
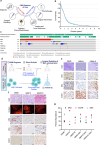
Fig. 1
Fig. 1. GBM patient roadmap and survival.
a Therapeutic roadmap representing the clinical standard of care for primary and recurrent GBM patients. b Kaplan–Meier survival plot showing 10-year survival data of 587 GBM patients from the TCGA portal. c Genomic mutation analysis of GBM patient datasets revealing the potential for the development of receptor-targeted therapies. d Illustration showing the diagnostic application of circulating tumor cells (CTC) based stratification for patients and the potential for integration into mainline treatment. e Photomicrographs of target receptors’ staining by immunocytochemistry of patient GBM tumor blocks. f Photomicrographs of target receptors’ staining by immunocytochemistry of mice bearing GBM xenografts corresponding to tumor blocks in e. g Plot showing a comparison of target receptor expression between human tissue blocks and GBM xenografts (MX) implanted in mice (n = 3 randomly chosen microscopic fields/ sample/ marker). Image analysis was done with ImageJ. Scale bars 100 μM (e, f); Fluorescence: mCherry expression of Xenografts; NB: Normal Brain. Data are shown as mean ± S.D.
Fig. 2
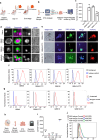
Fig. 2. Detection of target receptor expression in circulating tumor cells.
a Illustration showing the experimental model for CTC analysis from mice bearing GBM xenografts. b Illustration showing the principle underlying CTC isolation from blood samples using CELLTRACKS system and subsequent analysis. c Plot showing CD105+/CD45 GBM CTC isolated and enumerated from mice bearing GBM tumor xenografts harvested and analyzed at day 21 (n = 3 mice/group). d Photomicrographs showing CD105 and CD45 staining on single cells as obtained from the analyzer. e Photomicrographs revealing mCherry Fluorescence and DR5 staining on GBM-FmC-CTC isolated from mice. f Plot showing surface expression of DR5 on GBM cells and corresponding GBM-CTC by flow cytometry. g Plot showing surface expression of DR4 on GBM cells and their corresponding GBM-CTC. h Schematic depicting the workflow for CTC isolation and analysis for clinical blood samples. i Plot showing the number of CD146+/CD105+/CD45 CTC isolated from various deidentified GBM patient samples prior to surgical debulking of tumor. j Plot showing cell surface DR5 receptor expression on clinical CTC samples by flow cytometry. Scale bars 50 μM (d) and 100 μM (e). Data are shown as mean ± S.E.M.
Fig. 3
Fig. 3. Allogeneic MSC can be banked for “off-the-shelf” therapeutic use.
a Illustration depicting the MSC isolation and banking process. b Conventional karyotype analysis of MSCBif as compared with naive MSC showing no changes in the chromosomes post MSC transduction. c Plot showing surface expression analysis of naïve MSC and MSCBif using expression markers CD146, CD90, CD105, and CD45 revealing distinct MSC identity of MSCBif by flow cytometry. d Plot showing the quantification of various markers analyzed in c. e Immunogenicity profiling plots for MHC Class I and II antigen markers of MSC and MSCBif by flow cytometry. f Plot quantifying the immunogenicity profiling represented in e. Data shown are an aggregate of three biologically independent experiments. Data are shown as mean ± S.E.M.
Fig. 4
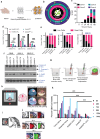
Fig. 4. sECM kinetics is essential to MSC migration in vitro and facilitates EnMSCBif efficacy.
a Schematic representing the formulation of MSCBif with the hydrogel to obtain EnMSCBif. b Illustration detailing the virtual zoning strategy used for quantification of the migration assay and corresponding zones to quantitate migration. EnMSCBif was placed at the center and the migration of MSC over time was quantitated. c Plot showing migration of MSC into various zones corresponding to the illustration in b at specified time points. d Plot showing changes in viability of various GBM-FmC following EnMSCBif treatment and GCV activation of HSV-TK as compared to controls. G, GCV. Data shown for n = 3 biologically independent samples/tumor type/treatment. e Trypan blue assay revealing percent live: dead GBM cells following EnMSCBif treatment as compared to controls. G, GCV. f Western blot showing the activation of the extrinsic apoptotic cascade following EnMSCBif treatment of GBM8-FmC, GBM18-FmC, and GBM31R-FmC. TK, HSV-TK. g, h Illustration depicting the evaluation of EnMSCBif kinetics in 3D bio-printed brains (g) and bio-printed with GBM8-FmC tumors (h). i Photomicrograph of the bio-printed brain. j Photomicrographs showing changes in tumor and stem cell fluorescence over time in 3D printed brains. Statistical analyses were performed using two-way ANOVA with multiple comparisons (d, k). Data shown for n = 3 biologically independent samples/tumor type/treatment (k). Plot showing changes in GBM8-FmC survival over time following GBM resection and EnMSCBif implantation in 3D printed brains. Scale bars 100 μM (i), 50 μM (i inset) and 100 μM (j). Data are shown as mean ± S.E.M. ***p < 0.001.
Fig. 5
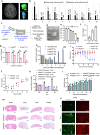
Fig. 5. Computer-assisted modeling aids with estimating resection cavity volume and the safety profile of EnMSCBif in vivo reveals no abnormalities in major organs.
a Representative MR scan and computer modeling of tumor volume (green) and resection cavity volume (blue) using 3D slicer. b Plot representing tumor and resection cavity volumes obtained from retrospective analysis of ten deidentified GBM patients pre- and post-surgical debulking. c Illustration of the real-time formulation of GMP-MSCBif obtained from master cell bank post shipment. d Photograph of representative bags used for GMP-MSCBif shipment. e Plot showing the viability of MSCBif over time in 10%HSA. Data analyzed by comparing two groups using t test. f Plot showing gelation time of GMP-EnMSCBif with varying cell numbers. g Plot showing activation of HSV-TK kill switch in GMP-EnMSCBif following GCV administration. h Plot showing changes in tumor volume in mice bearing GBM tumors treated with varying doses of GMP-EnMSCBif post resection in a dose-escalation study. (n = 5 mice/ group). i Plot showing changes in weights of mice bearing GBM tumors treated with varying doses of GMP-EnMSCBif post resection over time. j Plot showing median gelation time of GMP-Hystem Hydrogel from the two different lots in the absence and presence of MSC. k Plot showing the viability of GBM cells following co-culture with GMP-EnMSCBif at specified time points. l Plot showing weights of mice (n = 5 mice/group) following administration of either GMP-Hystem hydrogel alone or GMP-EnMSCBif in NOD.SCID mice over time. m Photomicrographs of H&E stains of the mouse brain and other major organs following GMP-EnMSCBif administration in non-tumor-bearing mice. n Photomicrographs of brain tissues by expansion microscopy (dEXM) using GFAP and Nestin staining. Data shown for n = 3 biologically independent samples/dose (eg). Statistical analyses were done using two-way ANOVA with multiple comparisons (h, k). Data are shown as mean ± S.E.M. Scale bars 200 μM (m), and 100 μM (n); **p < 0.05, ***p < 0.01.
Fig. 6
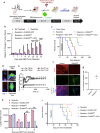
Fig. 6. EnMSCBif increases survival of mice in a clinically relevant mouse model of GBM resection.
a Schematic representing the murine model of GBM resection and treatment. b Plot showing changes in GBM8-FmC tumor volume over time following EnMSCBif administration post tumor resection as compared to controls. (n = 5 mice/group. Data representative of three independent experiments; Statistical analyses were done using two-way ANOVA with multiple comparisons). c Kaplan–Meier survival analysis of EnMSCBif treatment in GBM8-FmC mouse model of resection. d PET images showing brain uptake of [18F] FHBG tracer in mice (n = 3 mice/group) administered with EnMSCBif. e Plot representing uptake of the PET tracer, [18F] FHBG in mice administered with EnMSCBif. f Photomicrographs of immunofluorescence imaging of mouse brain sections stained with Cl. Caspase 3 as compared to control. g Plot showing the number of Cl. Caspase 3 cells as compared to control. h Plot showing changes in tumor volumes of GBM31R-FmC bearing mice (n = 5 mice/group) over time following EnMSCBif administration post tumor resection as compared to controls. i Kaplan–Meier survival analysis of EnMSCBif treatment in GBM31R-FmC mouse model of resection. Data are shown as mean ± S.E.M. Scale bars 100 μM. ***p < 0.01, ****p < 0.001.

Similar articles

Cited by

References

    1. Bianco, J. et al. On glioblastoma and the search for a cure: where do we stand? Cell. Mol. Life Sci. 10.1007/s00018-017-2483-3 (2017). - PMC - PubMed
    1. Chmielewska, M., Losiewicz, K., Socha, P., Mecik-Kronenberg, T. & Wasowicz, K. The application of circulating tumor cells detecting methods in veterinary oncology. Pol. J. Vet. Sci.16, 141–151 (2013). - PubMed
    1. Hong, B. & Zu, Y. Detecting circulating tumor cells: current challenges and new trends. Theranostics3, 377–394 (2013). - PMC - PubMed
    1. Sullivan, J. P. et al. Brain tumor cells in circulation are enriched for mesenchymal gene expression. Cancer Discov.4, 1299–1309 (2014). - PMC - PubMed
    1. Kauer, T. M., Figueiredo, J. L., Hingtgen, S. & Shah, K. Encapsulated therapeutic stem cells implanted in the tumor resection cavity induce cell death in gliomas. Nat. Neurosci.15, 197–204 (2011). - PMC - PubMed

Publication types