. 2022 May 19;13(1):2798.
doi: 10.1038/s41467-022-30479-1.

Inhibition mechanism of the chloride channel TMEM16A by the pore blocker 1PBC

Affiliations

Inhibition mechanism of the chloride channel TMEM16A by the pore blocker 1PBC

Andy K M Lam et al. Nat Commun. .

Abstract

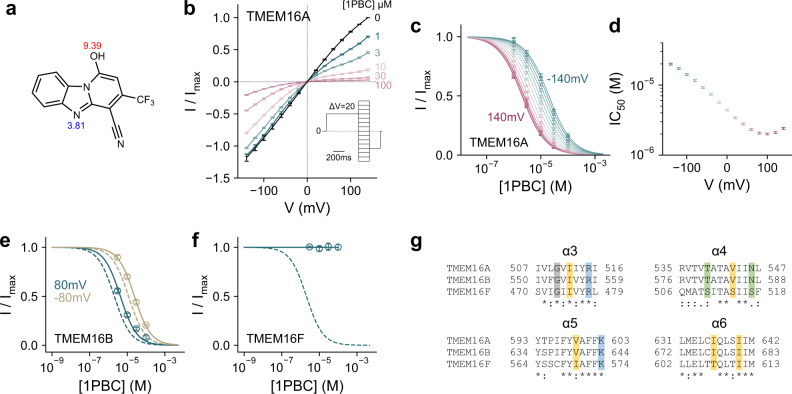
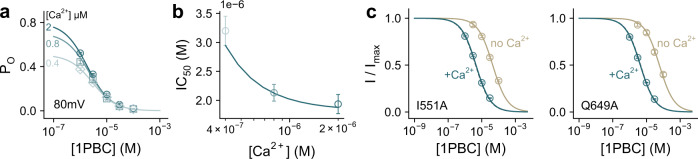
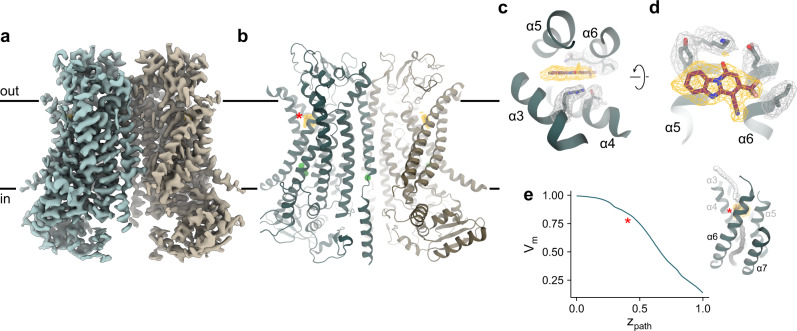
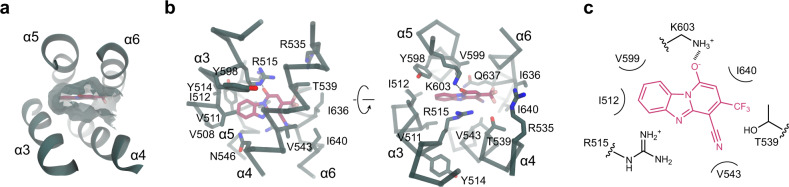
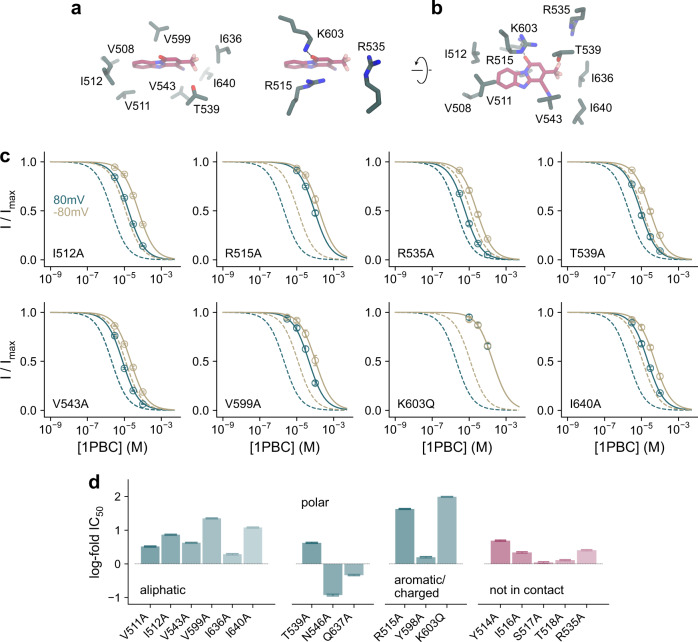
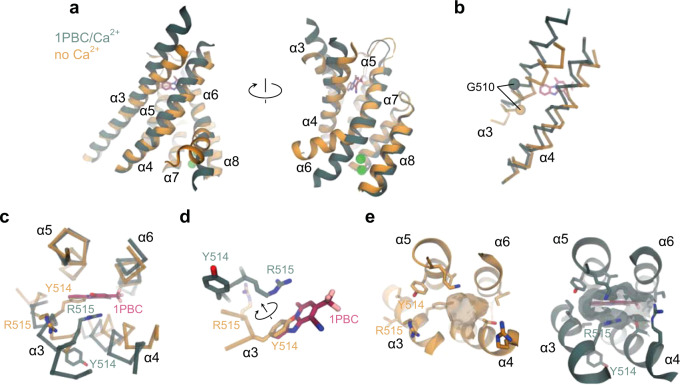
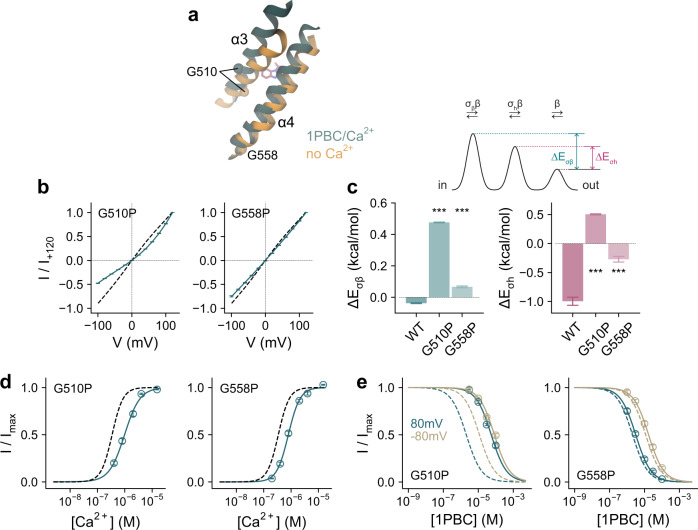
TMEM16A, a calcium-activated chloride channel involved in multiple cellular processes, is a proposed target for diseases such as hypertension, asthma, and cystic fibrosis. Despite these therapeutic promises, its pharmacology remains poorly understood. Here, we present a cryo-EM structure of TMEM16A in complex with the channel blocker 1PBC and a detailed functional analysis of its inhibition mechanism. A pocket located external to the neck region of the hourglass-shaped pore is responsible for open-channel block by 1PBC and presumably also by its structural analogs. The binding of the blocker stabilizes an open-like conformation of the channel that involves a rearrangement of several pore helices. The expansion of the outer pore enhances blocker sensitivity and enables 1PBC to bind at a site within the transmembrane electric field. Our results define the mechanism of inhibition and gating and will facilitate the design of new, potent TMEM16A modulators.


Conflict of interest statement

The authors declare no competing interests.

Figures

Fig. 1
Fig. 1. Functional characterization of the TMEM16A blocker 1PBC.
a Chemical structure of 1PBC. The pKa values of ionizable groups were calculated with the chemistry package Chemicalize (ChemAxon, https://chemicalize.com/). b Steady-state current-voltage relationship of wild-type mouse TMEM16A at the indicated concentrations of 1PBC applied to the intracellular side of the membrane at 2 µM intracellular Ca2+. Data are averages of 6 biological replicates, errors are SEM. c Concentration-response relations of 1PBC at voltages from −140 to 140 mV, ΔV = 20 mV. Data are calculated from b, errors are SEM. Solid lines are fits to the Hill equation. d IC50 values obtained from (c) at the indicated voltages. Data are best-fit values, errors are 95% CI. Concentration-response relations of 1PBC of mouse TMEM16B (e) and TMEM16F (f) at 15 and 300 µM intracellular Ca2+ respectively at −80 and 80 mV. Data are averages of 5 and 6 biological replicates respectively, errors are SEM. Solid lines are fits to the Hill equation. Dashed lines are the relations of TMEM16A. g Sequence alignment of the outer pore region of mouse TMEM16A (UniProt ID: Q8BHY3), mouse TMEM16B (UniProt ID: Q8CFW1), and mouse TMEM16F (UniProt ID: Q6P9J9). Sequence identity between TMEM16A and B, 60.5%; between TMEM16A and F, 39.5%. A conserved glycine in α3 is highlighted in gray and other colors indicate the type of the residues interacting with the blocker (yellow, hydrophobic; green, polar; blue, basic) in TMEM16A.
Fig. 2
Fig. 2. 1PBC block is state-dependent.
a Concentration-response relations of 1PBC at the indicated intracellular Ca2+ concentrations at 80 mV. Data are scaled according to the open probability of the channel in the absence of 1PBC as determined previously. Data are averages of 6, 5, and 7 biological replicates for 2 µM, 800 nM, and 400 nM Ca2+ respectively, errors are SEM. b IC50 values at the plotted intracellular Ca2+ concentrations at 80 mV, which were obtained via an empirical fit to the Hill equation on the data shown in (a). Shown are the best-fit values, errors are 95% CI. a, b Solid lines are a global fit to an open-channel block mechanism (Eqs. 4–9), with estimated parameters Kd 1PBC = 3.6 ± 0.29 µM at zero mV and apparent valence δb = 0.27 ± 0.025 (see “Methods”). c Concentration-response relations of 1PBC at 0 mV at zero and 2 µM intracellular Ca2+ for the constitutively active mutants I551A and Q649A. Data are averages of 6, 9, 7, and 7 biological replicates for I551A at 2 µM Ca2+, I551A at 0 Ca2+, Q649A at 2 µM Ca2+, and Q649A at 0 Ca2+ respectively, errors are SEM. Solid lines are fits to the Hill equation. Dashed lines are the relation of WT.
Fig. 3
Fig. 3. Structure of TMEM16A in complex with 1PBC and Ca2+.
Cryo-EM map (a) and ribbon representation (b) of mouse TMEM16A in a 1PBC- and Ca2+-bound form viewed from within the membrane. Black lines, membrane boundaries; green spheres, bound Ca2+; yellow mesh, density of the bound 1PBC molecule. Close-up view of the binding site from the extracellular side (c) and from within the membrane (d). Selected densities and sidechains are shown. e Membrane potential profile of the pore in the 1PBC/Ca2+-bound structure. Inset, coordinates (spheres) where the transmembrane potential was calculated. The spheres are colored according to the calculated values. The membrane potential profile was calculated using the PBEQ module in CHARMM (see “Methods”). b, e Asterisk indicates the location of the 1PBC binding site.
Fig. 4
Fig. 4. 1PBC binding site.
a Position of 1PBC in the binding pocket viewed from the extracellular side. Molecular boundaries are represented as green surface. b Detailed view of residues in contact distance to 1PBC. A putative salt bridge between Lys 603 and the 1PBC hydroxyl is indicated. c Schematic contact map between 1PBC and selected surrounding residues.
Fig. 5
Fig. 5. Interacting residues.
a, b Close-up of selected residues surrounding the bound 1PBC. c Concentration-response relations of 1PBC of selected mutants at a saturating Ca2+ concentration at −80 and 80 mV. Data are averages of the indicated number of biological replicates shown in Supplementary Table 1, errors are SEM. Solid lines are fits to the Hill equation. Dashed lines are the relations of WT. d Log-fold changes in IC50 of mutants at 80 mV. Mutants of residues in contact with the blocker are shown in green. Bars indicate IC50 values obtained via a fit of the averaged data shown in Supplementary Fig. 7 to the Hill equation, errors are 95% CI. The number of biological replicates is shown in Supplementary Table 1.
Fig. 6
Fig. 6. Rearrangement of the extracellular vestibule.
a Superposition of the pore region of the rebuilt Ca2+-free apo (PDB: 5OYG) and the 1PBC/Ca2+-bound structures viewed from within the membrane. b α3 and α4 of the superposed structures in Cα representation. The Cα atoms of Gly 510 are shown as spheres. c α3 and α4 with respect to the other pore-forming helices in the superposed structures viewed from the extracellular side. Selected residues on α3 are displayed. d Close-up view of the residues that rearrange upon the binding of 1PBC. e Molecular surface of the extracellular vestibule viewed from the top of the membrane. Selected residues lining the volume are shown. ae The 1PBC/Ca2+ structure is shown in green and the Ca2+-free apo structure in gold.
Fig. 7
Fig. 7. Pore conformation.
a Superposition of the narrow neck region of the hourglass-shaped pore of the rebuilt Ca2+-free apo (PDB: 5OYG) and the 1PBC/Ca2+-bound structures viewed from the top. Asterisk indicates the pore axis. b Molecular surface of the neck region viewed from the top. Selected residues lining the volume are shown. c Pore radius along the z-axis relative to the position of Ile 641 (gate). The locations of constrictions are indicated. Asterisk indicates the location of the 1PBC binding site. Dashed line denotes the ionic radius of a Cl ion.
Fig. 8
Fig. 8. Functional characterization of conformational changes.
a Section of the pore in the superposed 1PBC/Ca2+-bound and the rebuilt Ca2+-free apo structures viewed from within the membrane. Spheres show Cα of Gly 510 and Gly 558 on α3 and α4 respectively. b Instantaneous current-voltage relations of the indicated mutants at a saturating Ca2+ concentration (15 and 50 µM respectively). Data are averages of 5 and 6 biological replicates for G510P and G558P respectively, errors are SEM. Solid lines are fits of the averaged data to a model of ion permeation as described previously (Eq. 2). Dashed line is the relation of WT. c Energy barrier relative to the outermost barrier in the ion conduction path at the inner pore and the narrow neck region for the indicated mutants (Eq. 3 and see “Methods”). Bars indicate the best-fit values obtained via the fits shown in (b), errors are 95% CI. Inset, minimal ion permeation model illustrating the quantities plotted in (c). Asterisks indicate significant difference in a non-adjusted two-sided t-test (left, G510P, ***p = 0 and G558P, ***p = 3e−12; right, G510P, ***p = 2e−13 and G558P, ***p = 1e−14, each compared to WT). d Ca2+ concentration-response relation of the indicated mutants at 80 mV. Data are averages of 7 biological replicates for both G510P and G558P, errors are SEM. Solid lines are fits to the Hill equation. Dashed line shows the relation of WT. e Concentration-response relations of 1PBC of the indicated mutants at a saturating Ca2+ concentration (15 µM) at −80 and 80 mV. Data are averages of 9 and 8 biological replicates for G510P and G558P respectively, errors are SEM. Solid lines are fits to the Hill equation. Dashed lines are the relations of WT.
Fig. 9
Fig. 9. Mechanism.
In the Ca2+-free closed state, constrictions in the narrow neck and extracellular vestibule limit the access of either anions or the blocker 1PBC, whose binding site is occupied by Tyr 514 on α3. Ca2+ binding results in a series of transitions in the channel that opens the pore by rearranging the outer vestibule. The outward movement of α4 widens the outer pore entrance, while the more extended conformational change of α3 relocates Tyr 514 away from the pore and projects the adjacent Arg 515 towards the pore lumen, creating a site that accommodates the blocker. These rearrangements are subsequently propagated to the intracellular part of the narrow neck region to release a hydrophobic gate that stabilizes the constricted pore in the closed state. The binding of the blocker to the site immediately external to the narrow neck results in a direct blockade of the ion conduction path, thereby inhibiting channel activity. Blocker access to a pre-open conformation, where the site is already remodeled but the gate is still closed, appears to be feasible and might be represented in the observed structure.

References

    1. Caputo A, et al. TMEM16A, a membrane protein associated with calcium-dependent chloride channel activity. Science. 2008;322:590–594. doi: 10.1126/science.1163518. - DOI - PubMed
    1. Schroeder BC, Cheng T, Jan YN, Jan LY. Expression cloning of TMEM16A as a calcium-activated chloride channel subunit. Cell. 2008;134:1019–1029. doi: 10.1016/j.cell.2008.09.003. - DOI - PMC - PubMed
    1. Yang YD, et al. TMEM16A confers receptor-activated calcium-dependent chloride conductance. Nature. 2008;455:1210–1215. doi: 10.1038/nature07313. - DOI - PubMed
    1. Suzuki J, Umeda M, Sims PJ, Nagata S. Calcium-dependent phospholipid scrambling by TMEM16F. Nature. 2010;468:834–838. doi: 10.1038/nature09583. - DOI - PubMed
    1. Yang H, et al. TMEM16F forms a Ca2+-activated cation channel required for lipid scrambling in platelets during blood coagulation. Cell. 2012;151:111–122. doi: 10.1016/j.cell.2012.07.036. - DOI - PMC - PubMed

Publication types

MeSH terms