. 2022 May 19;13(1):2785.
doi: 10.1038/s41467-022-30466-6.

Neuronal hyperexcitability drives central and peripheral nervous system tumor progression in models of neurofibromatosis-1

Affiliations

Neuronal hyperexcitability drives central and peripheral nervous system tumor progression in models of neurofibromatosis-1

Corina Anastasaki et al. Nat Commun. .

Abstract

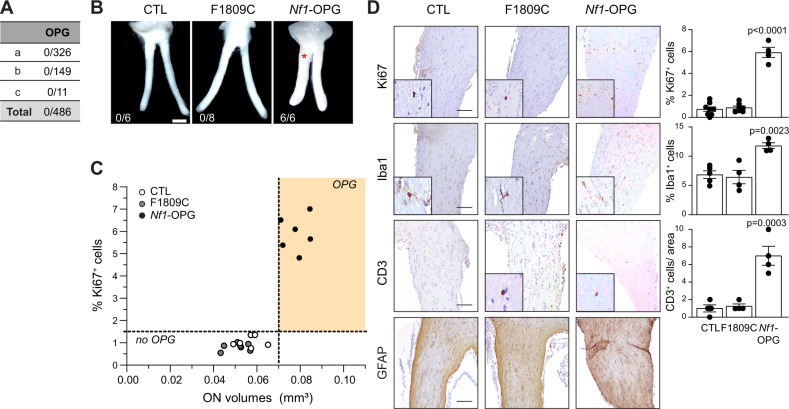
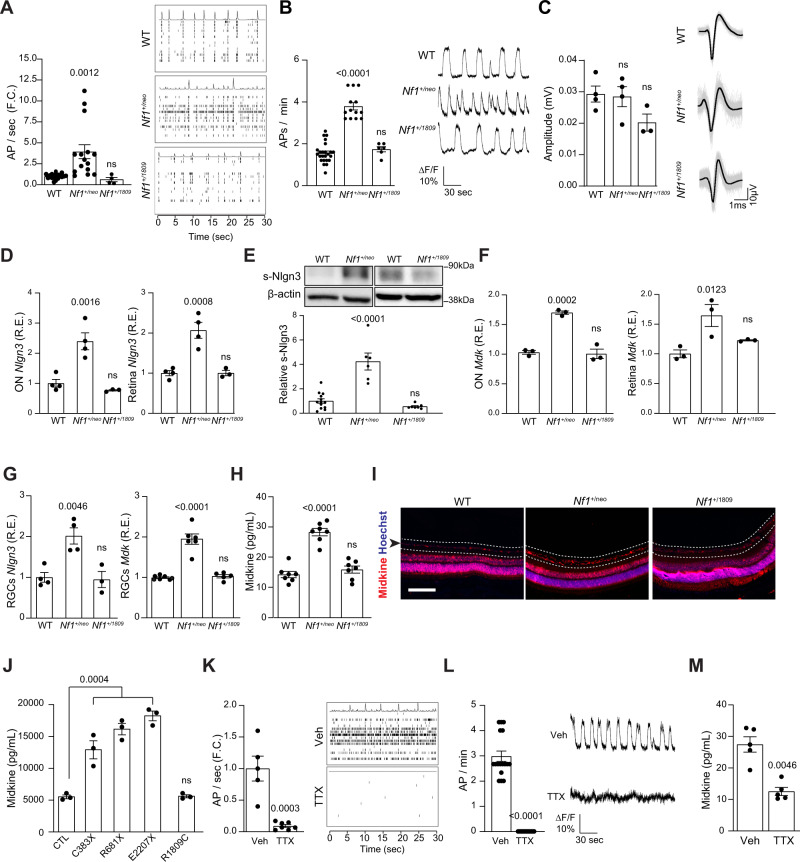
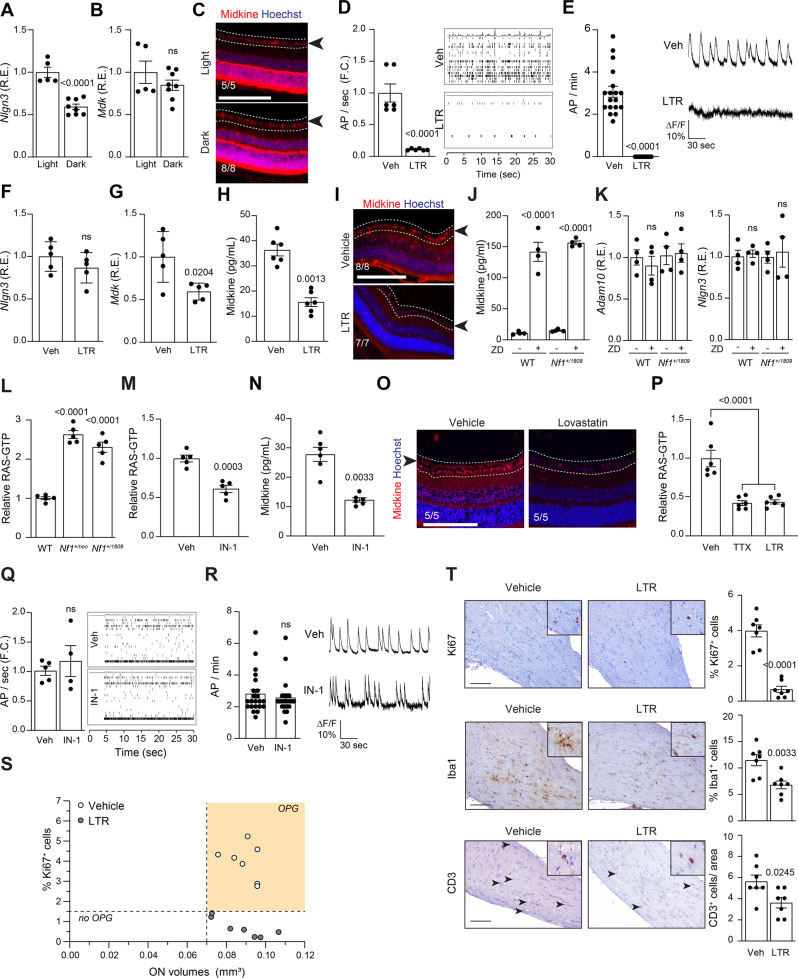
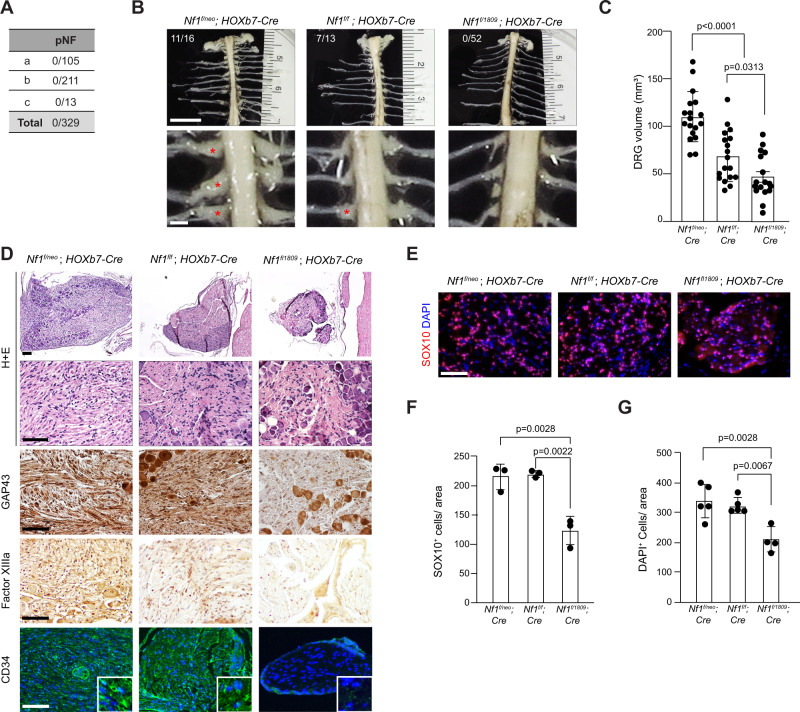
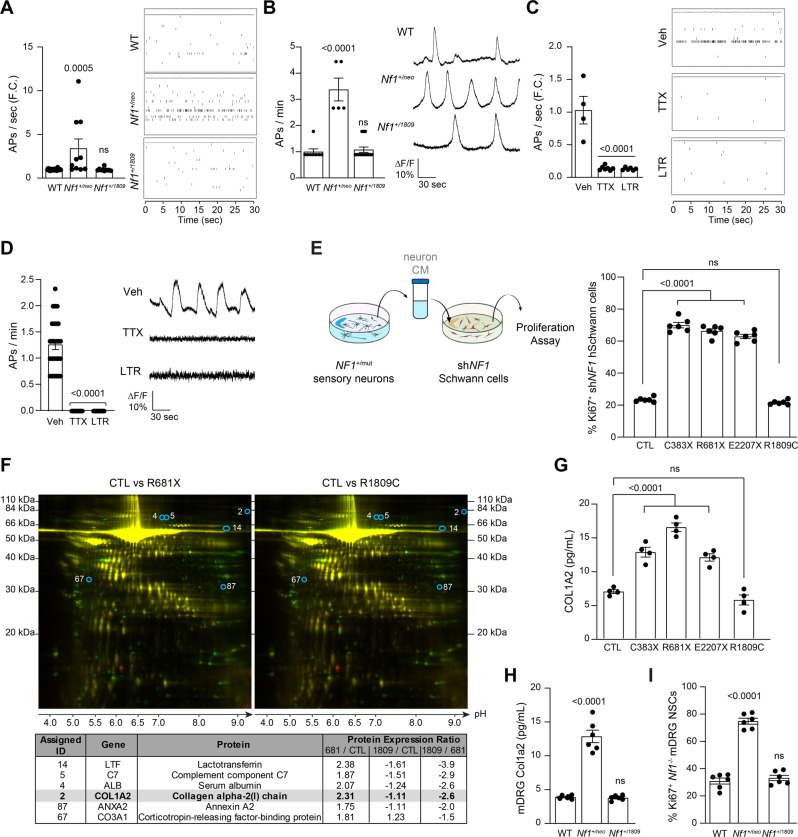
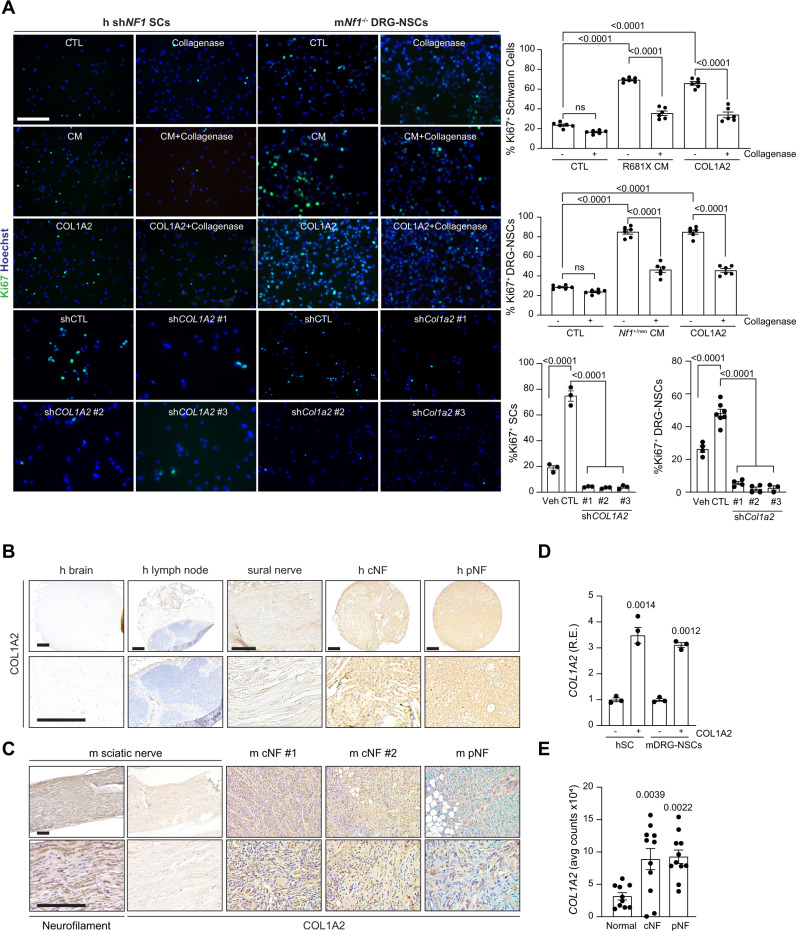
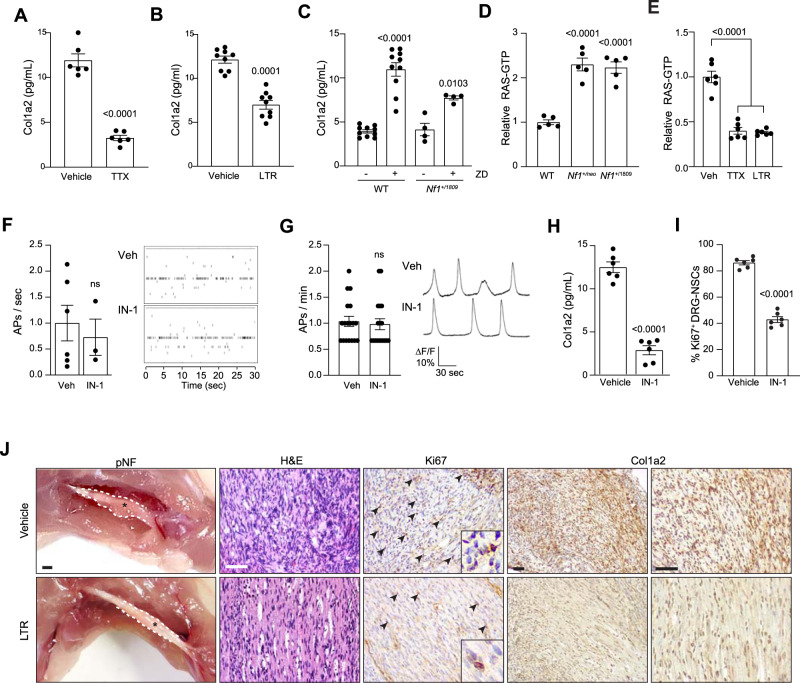
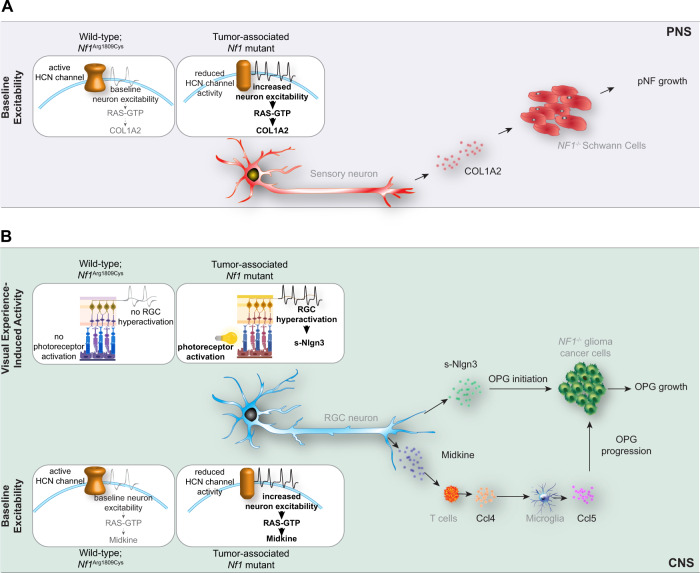
Neuronal activity is emerging as a driver of central and peripheral nervous system cancers. Here, we examined neuronal physiology in mouse models of the tumor predisposition syndrome Neurofibromatosis-1 (NF1), with different propensities to develop nervous system cancers. We show that central and peripheral nervous system neurons from mice with tumor-causing Nf1 gene mutations exhibit hyperexcitability and increased secretion of activity-dependent tumor-promoting paracrine factors. We discovered a neurofibroma mitogen (COL1A2) produced by peripheral neurons in an activity-regulated manner, which increases NF1-deficient Schwann cell proliferation, establishing that neurofibromas are regulated by neuronal activity. In contrast, mice with the Arg1809Cys Nf1 mutation, found in NF1 patients lacking neurofibromas or optic gliomas, do not exhibit neuronal hyperexcitability or develop these NF1-associated tumors. The hyperexcitability of tumor-prone Nf1-mutant neurons results from reduced NF1-regulated hyperpolarization-activated cyclic nucleotide-gated (HCN) channel function, such that neuronal excitability, activity-regulated paracrine factor production, and tumor progression are attenuated by HCN channel activation. Collectively, these findings reveal that NF1 mutations act at the level of neurons to modify tumor predisposition by increasing neuronal excitability and activity-regulated paracrine factor production.


Conflict of interest statement

D.H.G. has an active licensing agreement with the Tuberous Sclerosis Alliance for the use of the GFAP-Cre mouse strain. The remaining authors declare no competing interests.

Figures

Fig. 1
Fig. 1. Arg1809Cys Nf1-mutant mice do not develop optic gliomas following somatic Nf1 inactivation.
A Incidence of optic pathway glioma (OPG) in NF1 patients harboring the c.5425C > T NF1 germline mutation. (a), (b), (c). B Representative images of dissected optic nerves from control (Nf1f/f; CTL) and Nf1-mutant mice harboring conditional somatic Nf1 inactivation in neuroglial progenitors (Nf1f/1809; GFAP-Cre, F1809C; Nf1f/neo; GFAP-Cre, Nf1-OPG). Whereas Nf1-OPG mice form OPGs (red asterisk), CTL and F1809C mice do not. The number of mice that formed OPGs is shown in each panel. Scale bar: 1 mm. C Graph demonstrating the relationship between optic nerve volumes and Ki67+ cells in CTL, F1809C, and Nf1-OPG optic nerves. n = 6 for all groups. D Ki67, Iba1, CD3, and GFAP immunostaining of optic nerves in CTL, F1809C, and Nf1-OPG mice. Scale bars, 50 µm. (Ki67: CTL n = 8, F1809C n = 7, Nf1-OPG n = 4, P < 0.0001; Iba1: CTL n = 5, F1809C n = 4, Nf1-OPG n = 4, P = 0.0023; CD3: CTL n = 4, F1809C n = 4, Nf1-OPG n = 4, P = 0.0003). Data are represented as means ± SEM. One-way ANOVA with Dunnett’s post-test correction. P values are indicated within each panel. ns, not significant. Source data are provided as a Source Data file.
Fig. 2
Fig. 2. OPG-associated Nf1-mutant neurons have increased activity and OPG-promoting factor production.
Nf1+/neo, but not Nf1+/1809, RGC neuron activity (AP firing rates), as measured by (A) multi-electrode arrays (CTL n = 27, Nf1+/neo n = 15, P = 0.0012, Nf1+/1809 n = 4), or (B) calcium imaging (CTL n = 24, Nf1+/neo n = 13, P < 0.0001, Nf1+/1809 n = 6), is elevated relative to WT RGC neurons. Each dot represents (A) the averge of a minimum of three technical replicates for a single animal, or (B) a single neuron. Right panels depict representative (A) spike plots of entire multi-electrode array well recordings over 30 s and (B) traces of neuronal activity represented as fluorescence differentials over 3 min. C The amplitudes of action potentials are similar in Nf1+/neo and Nf1+/1809 RGC neurons relative to WT controls (CTL n = 4, Nf1+/neo n = 4, Nf1+/1809 n = 3). ns not significant. Right panels: representative traces of action potentials recorded over 3 ms (gray). The average of the action potentials is shown in black. D Neuroligin-3 transcript (Nlgn3) relative expression (CTL n = 4, Nf1+/neo n = 4, O.N. P = 0.0016, retina P = 0.0008, Nf1+/1809 n = 3, ns), and (E) soluble neuroligin-3 (s-Nlgn3; CTL n = 13, Nf1+/neo n = 6, P < 0.0001, Nf1+/1809 n = 7, ns) are increased in Nf1+/neo optic nerves (ON) and retinae relative to WT and Nf1+/1809 counterparts. β-actin was used as a loading control. F Midkine transcript (Mdk) relative expression is increased in whole optic nerves and retinae from Nf1+/neo mice relative to WT controls and Nf1+/1809 mice. n = 3 for all groups. O.N. Mdk R.E., P = 0.0002; retinal Mdk R.E., P = 0.0123. G Nlgn3 (CTL n = 4, Nf1+/neo n = 4, Nf1+/1809 n = 3; P = 0.0046) and Mdk (CTL n = 7, Nf1+/neo n = 6, Nf1+/1809 n = 5; P < 0.0001) transcript relative expression is increased in Nf1+/neo retinal ganglion cell (RGC) neurons relative to WT and Nf1+/1809 RGCs. H, I Midkine protein expression is elevated in (H) the Nf1+/neo conditioned media (CM) from RGCs in vitro (n = 7 for all groups; P < 0.0001), and (I) the RGC layer of Nf1+/neo mice relative to WT and Nf1+/1809 mice (n = 5 for each group). Scale bar, 50 µm. Dotted lines and arrow highlight the RGC layer. J Midkine expression is elevated in human CNS excitatory NF1C383X (P = 0.0004), NF1R681X (P < 0.0001) and NF1E2207X (P < 0.0001) mutant neurons, but not NF1R1809C neurons, relative to controls (CTL). n = 3 for all groups. K, L Tetrodotoxin (TTX; 1 µM) reduced the AP firing rate of Nf1+/neo RGC neurons relative to controls, as measured by (K) multi-electrode arrays (vehicle n = 5, TTX n = 7; P = 0.0003) and (L) calcium imaging (vehicle n = 17, TTX n = 17; P < 0.0001). Right panels: representative (K) spike plots of entire multi-electrode array well recordings over 30 s, and (L) traces of neuronal activity over 3 min. M TTX reduced midkine secretion by Nf1+/neo RGC neurons. n = 5 for all groups (P = 0.0046). Data are represented as means ± SEM. BH, J One-way ANOVA with Dunnett’s post-test correction, or (A, KL) two-tailed unpaired and (M) two-tailed paired Student’s t test. P values are indicated within each panel. ns, not significant. Source data are provided as a Source Data file.
Fig. 3
Fig. 3. OPG-associated Nf1-mutant neuronal hyperexcitability is HCN channel-dependent.
A Neuroligin (Nlgn3; P < 0.0001) but not (B) midkine (Mdk; ns not significant) transcript relative expression is decreased in retinae of Nf1+/neo mice following dark-rearing from 4 to 8 weeks. Light-reared n = 5, dark-reared n = 8. C Midkine expression is not reduced in the RGC layer (dotted lines, black arrow) or retinae in 8-week-old Nf1+/neo mice following dark-rearing from 4 to 8 weeks. Light-reared n = 5, dark-reared n = 8. D, E RGC activity is reduced following 200 µM lamotrigine (LTR) treatment, as measured by (D) multi-electrode array (vehicle n = 6; LTR n = 6; P < 0.0001), or (E) calcium imaging (vehicle n = 18; LTR n = 18; P < 0.0001). Right panels: representative (D) spike plots of entire multi-electrode array well recordings over 30 s, and (E) traces of neuronal activity over 3 min. F Nlgn3 relative expression is unaltered (ns not significant), while (G) Mdk transcript relative expression is decreased in retinae of Nf1+/neo mice following LTR treatment in vivo. n = 5 for all groups. P = 0.0204. H, I Midkine expression is reduced in (H) Nf1+/neo RGC neurons in vitro (n = 6 for all groups; P = 0.0013), and (I) in the RGC layer (dotted lines, black arrow) of retinae in 12-week-old Nf1f/neo; GFAP-Cre (Nf1-OPG) mice following LTR treatment in vivo (vehicle n = 8; LTR n = 7). J, K ZD7288 (ZD) treatment (30 µM) of WT and Nf1+/1809 RGC neurons (J) increased midkine production (P < 0.0001), but (K) did not alter Adam10 or Nlgn3 transcript expression in vitro (ns, not significant). n = 4 for all groups. L, M RAS activity is elevated in Nf1+/neo and Nf1+/1809 (L) RGC neurons relative to WT controls (P < 0.0001), and (M) is reduced in Nf1+/neo neurons following IN-1 treatment (1 µM; P = 0.0003). n = 5 for all groups. N Midkine levels are reduced in Nf1+/neo RGC neurons following IN-1 treatment. n = 6 for all groups; P = 0.0033. O RGC layer (dotted lines, black arrow) midkine expression is reduced following lovastatin treatment of 12-week-old Nf1-OPG animals in vivo. n = 5 for all groups. P RAS-GTP is reduced in TTX (1 µM)- and LTR-treated Nf1+/neo RGCs. n = 6 for all groups, P < 0.0001. Q, R Nf1+/neo RGC neuron AP firing rate is not reduced following IN-1 treatment, as measured by (Q) multi-electrode array (vehicle n = 5; IN-1 n = 4), or (R) calcium-imaging recordings (vehicle n = 22; IN-1 n = 22). Right: Q spike plots of entire multi-electrode array well recordings over 30 s, and (R) traces of neuronal activity over 3 min. ns, not significant. S Graph demonstrating the relationship between optic nerve volumes and Ki67+ cells in vehicle- and LTR-treated Nf1-OPG optic nerves. n = 7 for both groups. T LTR-treated Nf1-OPG mouse optic nerves have reduced Ki67+ (P < 0.0001), Iba1+ (P = 0.0033) and CD3+ cells (P = 0.0245) relative to vehicle-treated Nf1-OPG mice. n = 7 for all groups. Scale bars, 100 µm. Data are represented as means ± SEM, (A, B, DG, M, Q, R, T) unpaired two-tailed Student’s t test, (H, N) paired Student’s t test, (JL, P) One-way ANOVA with (J) Tukey’s or (K, L, P) Dunnett’s post-test correction. P values are indicated within each panel. ns, not significant. Source data are provided as a Source Data file.
Fig. 4
Fig. 4. Arg1809Cys Nf1-mutant mice do not develop neurofibromas following somatic Nf1 inactivation.
A Incidence of peripheral nervous system tumors in NF1 patients harboring the c.5425 C > T NF1 germline mutation. pNF: plexiform neurofibroma; (a), (b), (c). B Representative gross images (bright field) of spinal cords from 6-month-old Nf1f/neo; Hoxb7-Cre (n = 16), Nf1f/f; Hoxb7-Cre (n = 13), and Nf1f/1809 ; Hoxb7-Cre (n = 52) mice, showing (C) enlarged DRG (red asterisks) in Nf1f/neo; Hoxb7-Cre (n = 17; P < 0.0001) and Nf1f/f; Hoxb7-Cre mice (n = 17; P = 0.0313), but not in Nf1f/1809 ; Hoxb7-Cre mice (n = 17). Scale bars: 1 mm. The number of mice that formed pNFs is also shown in the top panels in (B). D, E Representative (D) H + E staining, GAP43, Factor XIIIa and CD34 staining, and (E) SOX10 and S100β, immunostaining. n = 4 for all groups. F, G Quantification of SOX10+ (n = 3 for all groups; Nf1f/neo; Hoxb7-Cre, P = 0.0028; Nf1f/f; Hoxb7-Cre, P = 0.0022) and DAPI+ cells (Nf1f/neo; Hoxb7-Cre, n = 5, P = 0.0028; Nf1f/f; Hoxb7-Cre, n = 5, P = 0.0067; Nf1+/1809; Hoxb7-Cre, n = 4) in DRGs. Scale bars, 50 µm. Data are presented as the mean ± SEM. One-way ANOVA with Tukey’s test for multiple comparison. Source data are provided as a Source Data file.
Fig. 5
Fig. 5. pNF-associated NF1-mutant PNS neurons exhibit increased activity and COL1A2-dependent preneoplastic NF1−/ Schwann cell growth.
A, B Nf1+/neo, but not Nf1+/1809, DRG neuron AP firing rates are elevated relative to WT DRG neurons, as measured by (A) multi-electrode array (WT, n = 24, Nf1+/neo, n = 10; P = 0.0005, Nf1+/1809 n = 10, ns), or (B) calcium imaging recordings (WT n = 8, Nf1+/neo n = 5, P < 0.0001, Nf1+/1809 n = 14, ns). C, D TTX (1 µM) and lamotrigine (LTR; 200 µM) reduce Nf1+/neo DRG neuron AP firing rate as measured by multi-electrode array (vehicle n = 4, TTX n = 7, P < 0.0001; LTR n = 6, P < 0.0001) and calcium imaging (vehicle n = 23, TTX n = 9, P < 0.0001, LTR n = 14, P < 0.0001). The right panels show representative (A, C) spike plots of entire multi-electrode array well recordings over 30 s, and (B, D) traces of neuronal activity over 3 min. E Schematic illustrating treatment of human shNF1 Schwann cells with hiPSC-sensory neuron conditioned media (CM). NF1-deficient Schwann cell proliferation is increased after treatment with NF1C383X, NF1R681X, and NF1E2207X mutant neuron CM (P < 0.0001), but not NF1R1809C neuron CM relative to controls (CTL). n = 6 for all groups. F Analytical comparison of 2D gel electrophoresis (top-to-bottom: decreasing molecular weight; left-to-right: decreasing acidity) of NF1R681X (left) and NF1R1809C (right) CM relative to CTL hiPSC-sensory neuron CM. Red dots indicate proteins with increased expression, green dots indicate proteins with decreased expression, and yellow dots indicate unaltered proteins in NF1-mutant sensory neuron CM relative to CTL neuron CM. The six proteins uniquely increased more than 1.5-fold in NF1R681X hiPSC-sensory neuron CM relative to CTL, but not in NF1R1809C CM, relative to CTL are circled in blue and are listed in the lower panel. Representative CM from CTL, NF1R1809C, and NF1R681X sensory neurons was analyzed by 2D gel electrophoresis (n = 1). G, H COL1A2 levels are increased in (G) NF1C383X, NF1R681X, and NF1E2207X mutant neuron CM (P < 0.0001), but not in NF1R1809C neuron CM (n = 4 for all groups), as well as in (H) Nf1+/neo mouse DRG neuron CM (P < 0.0001), but not in Nf1+/1809 mouse DRG neuron CM (n = 6 for all groups). I Nf1-deficient DRG-NSC proliferation is increased after treatment with Nf1+/neo DRG neuron CM (P < 0.0001), but not Nf1+/1809 DRG neuron CM, relative to WT controls. n = 6 for all groups. Data are presented as the mean ± SEM. AE, GI One-way ANOVA with (AD, GI) Dunnett’s, or (E) Tukey’s multiple comparisons test. P values are indicated within each panel. ns, not significant. Source data are provided as a Source Data file.
Fig. 6
Fig. 6. COL1A2 is necessary and sufficient for NF1-deficient Schwann cell growth in vitro.
A Immunofluorescent staining and corresponding quantitation of Ki67+ human shNF1 Schwann cells (left) and Nf1/− mouse DRG–NSCs (right) following incubation with hiPSC-sensory neuron conditioned media (CM), with (h P = 0.0007; m P < 0.0001) and without (P < 0.0001) collagenase (n = 6 for all groups), COL1A2 alone with (h P = 0.0036; m P < 0.0001) and without (P < 0.0001) collagenase (n = 6 for all groups), as well as with and without control or short hairpins against COL1A2 (n = 3 for all groups, P < 0.0001) or Col1a2 (vehicle n = 4, control short hairpin n = 7, shCol1a2-1 n = 4, sh Col1a2-2 n = 4, sh Col1a2-3 n = 3, P < 0.0001). BC (B) Human and (C) mouse cutaneous (cNF) and plexiform neurofibromas (pNF) express COL1A2. Normal brain, lymph node and normal sural (human) or normal sciatic (mouse) nerves were negative for COL1A2 expression. Neurofilament was used as positive control for normal mouse nerve tissue. These data derive from a single-tissue microarray. D COL1A2 RNA expression is increased in human shNF1 Schwann cells (left; P = 0.0014) and mouse Nf1−/− DRG–NSCs (right; P = 0.0012) following COL1A2 treatment. n = 3 for all groups. E COL1A2 RNA expression is increased in human Schwann cells isolated from human cNF (P = 0.0039) and pNF tumors (P = 0.0022) relative to controls. Normal n = 10, cNF n = 11, pNF n = 11. Data are presented as the mean ± SEM. A, E One-way ANOVA with (A) Tukey’s or (E) Dunnett’s multiple comparisons test, or (D) paired two-tailed Student t test. Scale bars, 50 µm. Source data are provided as a Source Data file.
Fig. 7
Fig. 7. Col1a2 secretion is regulated by HCN channel-regulated sensory neuron activity.
A, B TTX (1 µM; A; vehicle n = 6, TTX n = 6; P < 0.0001) and lamotrigine (LTR; 200 µM; B; vehicle n = 9, LTR n = 9; P = 0.0001) reduce Nf1+/neo DRG neuron Col1a2 secretion by 73 and 47% relative to vehicle-treated controls. C ZD7288 (ZD; 30 µM) increases Col1a2 secretion in WT (n = 10 in both groups; P < 0.0001) and Nf1+/1809 (n = 4 in both groups; P = 0.0103) DRG neurons. D RAS activity is increased in both Nf1+/neo and Nf1+/1809 DRG neurons relative to controls (n = 5 in all groups; P < 0.0001), (E) and is inhibited following TTX and LTR treatment (n = 6 in all groups; P < 0.0001). F, G IN-1 has no effect on DRG neuronal activity, as measured by (F) multi-electrode array (vehicle n = 6, IN-1 n = 3, ns not significant), or (G) calcium-imaging recordings (vehicle n = 18, IN-1 n = 18; ns, not significant). Right: representative (F) spike plots of entire multi-electrode array well recordings over 30 s, and (G) traces of neuronal activity over 3 min. H IN-1 reduces Col1a2 secretion by 77.9% in Nf1+/neo DRG neurons. n = 6 for both groups, P = 0.0001. I IN-1 reduces proliferation by 50% in Nf1−/ DRG–NSCs. n = 6 for both groups, P < 0.0001. J Lamotrigine treatment decreases pNF progression in vivo. Gross images and representative immunostaining of mouse pNFs demonstrate that LTR treatment reduces pNF size, partly restores neuronal histology (H&E), reduces proliferation (Ki67+ cells) and decreases Col1a2 production. Scale bars: gross anatomy images, 1 mm; sections, 100 µm. n = 5 for both groups. Data are represented as means ± SEM (AC, H, I) using two-tailed paired Student’s t tests, (F, G) two-tailed unpaired t tests, or (D, E) one-way ANOVA with Dunnett’s post-test correction. P values are indicated within each panel. ns, not significant. Source data are provided as a Source Data file.
Fig. 8
Fig. 8. Proposed model for NF1 mutation-induced, neuronal hyperexcitability-regulated low-grade tumor growth.
A Tumor-associated NF1-mutant sensory neurons have increased baseline neuron excitability and deregulated HCN channel function, leading to elevated COL1A2 secretion. COL1A2, in turn, increases NF1−/ Schwann cell proliferation to stimulate pNF growth. B Tumor-associated NF1-mutant retinal ganglion cell (RGC) activity is governed by two distinct mechanisms. First, visual experience (light)-induced activity enhances RGC production of soluble-Nlgn3 (s-Nlgn3), which drives OPG initiation and cell growth. Second, tumor-associated NF1-mutant RGCs have increased intrinsic baseline neuronal hyperexcitability, which is controlled by HCN channel function. Increased baseline HCN channel-regulated RGC excitability triggers increased midkine production to induce a T-cell (Ccl4) and microglial (Ccl5) signaling cascade that governs OPG progression and growth. PNS, peripheral nervous system, CNS, central nervous system, pNF, plexiform neurofibroma, OPG, optic pathway glioma. Small elements of this schematic were designed on BioRender.com. Source data are provided as a Source Data file.

References

    1. Joyce JA. Therapeutic targeting of the tumor microenvironment. Cancer Cell. 2005;7:513–520. doi: 10.1016/j.ccr.2005.05.024. - DOI - PubMed
    1. Ungefroren H, Sebens S, Seidl D, Lehnert H, Hass R. Interaction of tumor cells with the microenvironment. Cell Commun. Signal. 2011;9:18. doi: 10.1186/1478-811X-9-18. - DOI - PMC - PubMed
    1. Hu M, et al. Distinct epigenetic changes in the stromal cells of breast cancers. Nat. Genet. 2005;37:899–905. doi: 10.1038/ng1596. - DOI - PubMed
    1. Gorzalczany Y, Akiva E, Klein O, Merimsky O, Sagi-Eisenberg R. Mast cells are directly activated by contact with cancer cells by a mechanism involving autocrine formation of adenosine and autocrine/paracrine signaling of the adenosine A3 receptor. Cancer Lett. 2017;397:23–32. doi: 10.1016/j.canlet.2017.03.026. - DOI - PubMed
    1. Ferner RE, Gutmann DH. Neurofibromatosis type 1 (NF1): diagnosis and management. Handb. Clin. Neurol. 2013;115:939–955. doi: 10.1016/B978-0-444-52902-2.00053-9. - DOI - PubMed

Publication types

Substances