

Plant beta-diversity across biomes captured by imaging spectroscopy
- PMID: 35589739
- PMCID: PMC9120498
- DOI: 10.1038/s41467-022-30369-6
Plant beta-diversity across biomes captured by imaging spectroscopy
Abstract
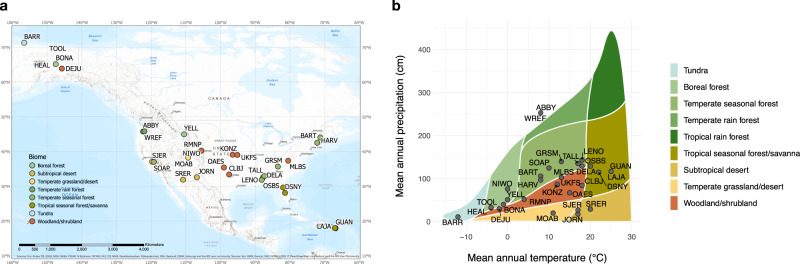
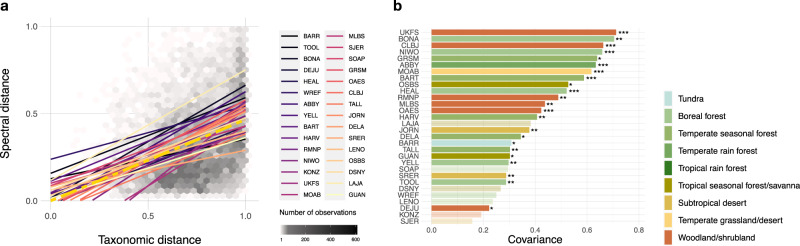
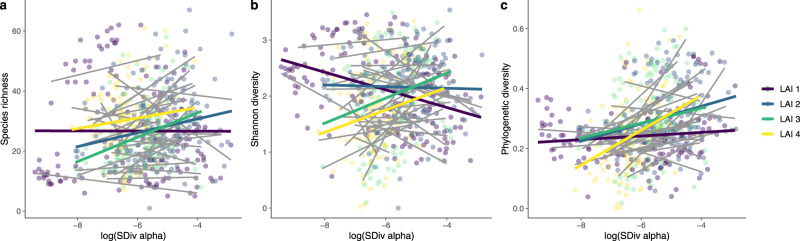
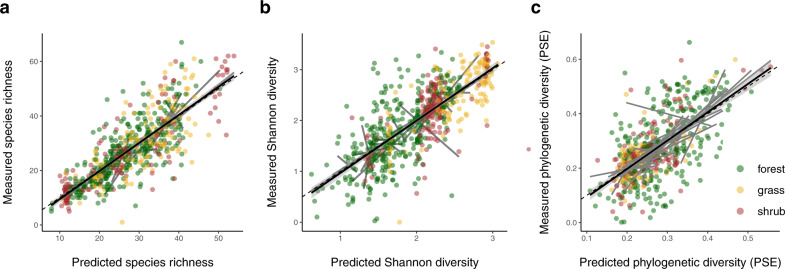
Monitoring the rapid and extensive changes in plant species distributions occurring worldwide requires large-scale, continuous and repeated biodiversity assessments. Imaging spectrometers are at the core of novel spaceborne sensor fleets designed for this task, but the degree to which they can capture plant species composition and diversity across ecosystems has yet to be determined. Here we use imaging spectroscopy and vegetation data collected by the National Ecological Observatory Network (NEON) to show that at the landscape level, spectral beta-diversity-calculated directly from spectral images-captures changes in plant species composition across all major biomes in the United States ranging from arctic tundra to tropical forests. At the local level, however, the relationship between spectral alpha- and plant alpha-diversity was positive only at sites with high canopy density and large plant-to-pixel size. Our study demonstrates that changes in plant species composition and diversity can be effectively and reliably assessed with imaging spectroscopy across terrestrial ecosystems at the beta-diversity scale-the spatial scale of spaceborne missions-paving the way for close-to-real-time biodiversity monitoring at the planetary level.
© 2022. The Author(s).
Conflict of interest statement
The authors declare no competing interests.
Figures
Similar articles
-
Mapping tropical forest canopy diversity using high‐fidelity imaging spectroscopy.Ecol Appl. 2014;24(6):1289-96. doi: 10.1890/13-1824.1. Ecol Appl. 2014. PMID: 29160652
-
Mapping canopy traits over Québec using airborne and spaceborne imaging spectroscopy.Sci Rep. 2023 Oct 11;13(1):17179. doi: 10.1038/s41598-023-44384-0. Sci Rep. 2023. PMID: 37821515 Free PMC article.
-
Foliar functional traits from imaging spectroscopy across biomes in eastern North America.New Phytol. 2020 Oct;228(2):494-511. doi: 10.1111/nph.16711. Epub 2020 Jun 23. New Phytol. 2020. PMID: 32463927
-
Effects of air pollution on ecosystems and biological diversity in the eastern United States.Ann N Y Acad Sci. 2009 Apr;1162:99-135. doi: 10.1111/j.1749-6632.2009.04153.x. Ann N Y Acad Sci. 2009. PMID: 19432647 Review.
-
Effects on the function of Arctic ecosystems in the short- and long-term perspectives.Ambio. 2004 Nov;33(7):448-58. doi: 10.1579/0044-7447-33.7.448. Ambio. 2004. PMID: 15573572 Review.
Cited by
-
Dispersion-assisted high-dimensional photodetector.Nature. 2024 Jun;630(8015):77-83. doi: 10.1038/s41586-024-07398-w. Epub 2024 May 15. Nature. 2024. PMID: 38750367
-
Current and Near-Term Earth-Observing Environmental Satellites, Their Missions, Characteristics, Instruments, and Applications.Sensors (Basel). 2024 May 28;24(11):3488. doi: 10.3390/s24113488. Sensors (Basel). 2024. PMID: 38894281 Free PMC article. Review.
-
Plant diversity across dimensions: Coupling biodiversity measures from the ground and the sky.Sci Adv. 2025 Jan 24;11(4):eadr0278. doi: 10.1126/sciadv.adr0278. Epub 2025 Jan 24. Sci Adv. 2025. PMID: 39854465 Free PMC article.
-
Spectrometer-Less Remote Sensing Image Classification Based on Gate-Tunable van der Waals Heterostructures.Adv Sci (Weinh). 2024 Jun;11(24):e2309781. doi: 10.1002/advs.202309781. Epub 2024 Apr 12. Adv Sci (Weinh). 2024. PMID: 38610112 Free PMC article.
-
Deep learning-enabled ultra-broadband terahertz high-dimensional photodetector.Nat Commun. 2025 Aug 30;16(1):8133. doi: 10.1038/s41467-025-63364-8. Nat Commun. 2025. PMID: 40885712 Free PMC article.
References
-
- Díaz, S. et al. Summary for policymakers of the global assessment report on biodiversity and ecosystem services of the Intergovernmental Science-Policy Platform on Biodiversity and Ecosystem Services. 10.5281/zenodo.3553579 (2019).
-
- HyspIRI Mission Concept Team. HyspIRI Final Report. https://hyspiri.jpl.nasa.gov/downloads/reports_whitepapers/HyspIRI_FINAL.... Jet Propulsion Laboratories, California Institute of Technology, Pasadena, CA, USA (2018).
Publication types
MeSH terms
LinkOut - more resources
Full Text Sources
