. 2022 Jun;606(7913):389-395.
doi: 10.1038/s41586-022-04735-9. Epub 2022 May 19.

Neoantigen quality predicts immunoediting in survivors of pancreatic cancer

Affiliations

Neoantigen quality predicts immunoediting in survivors of pancreatic cancer

Marta Łuksza et al. Nature. 2022 Jun.

Abstract

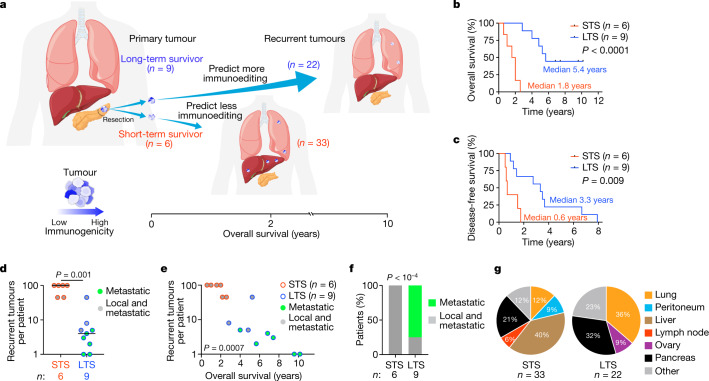
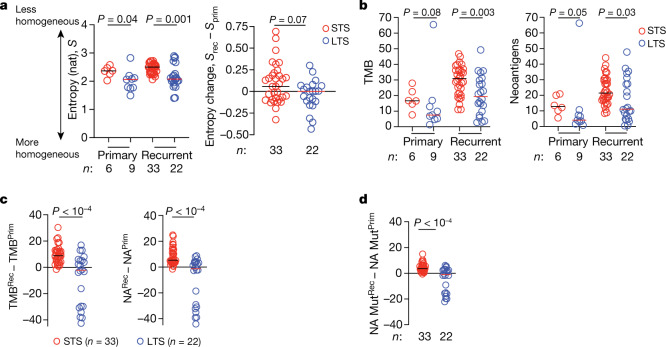
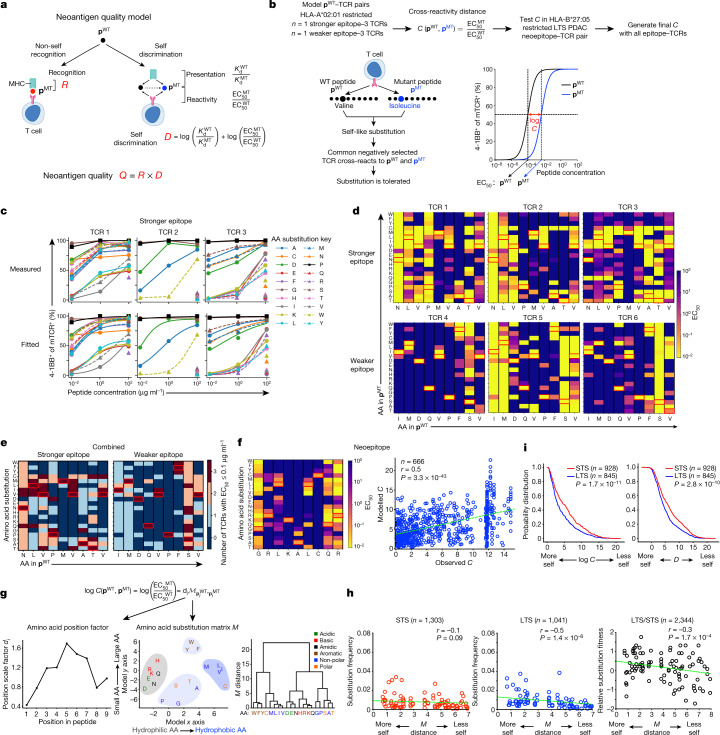
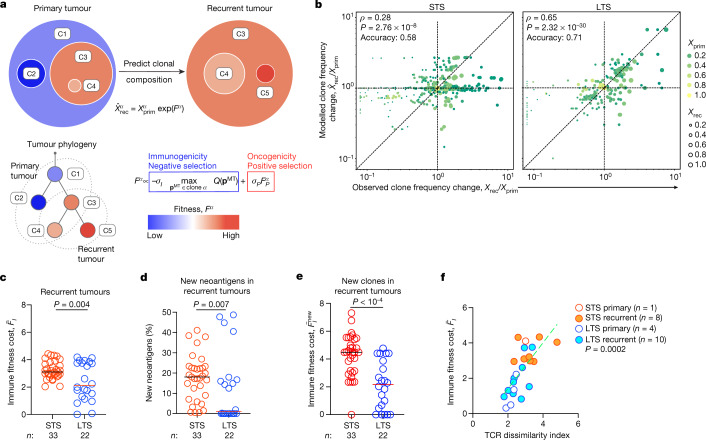
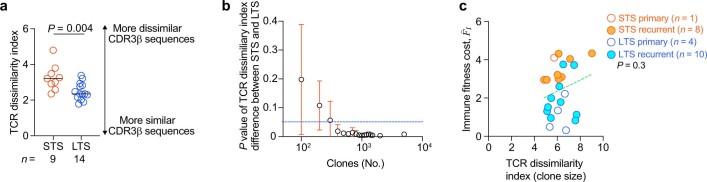
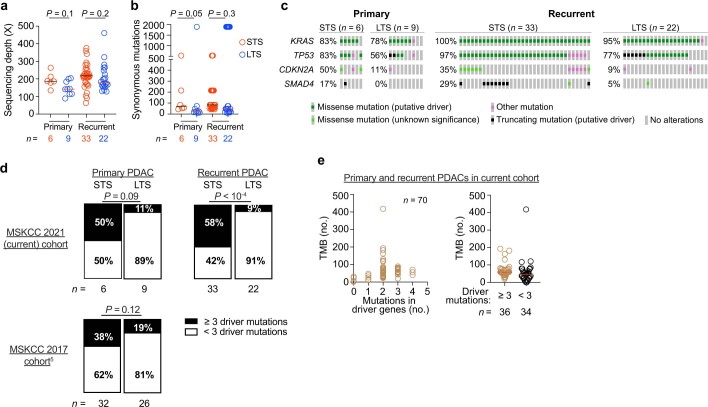
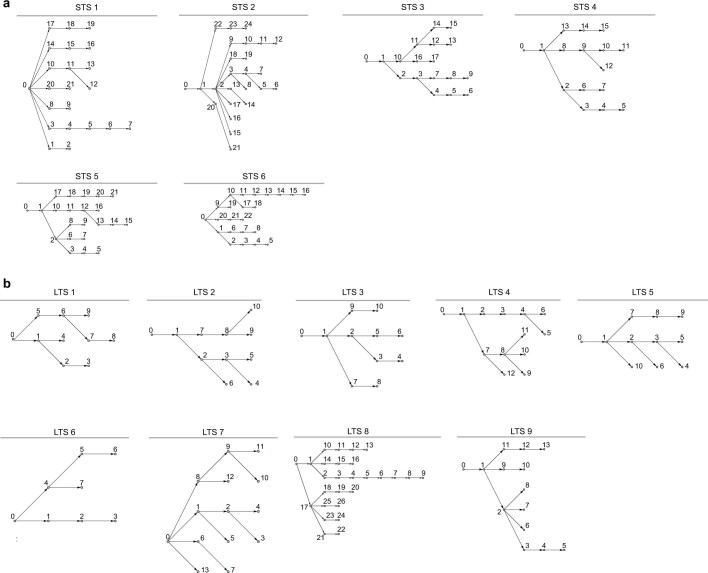
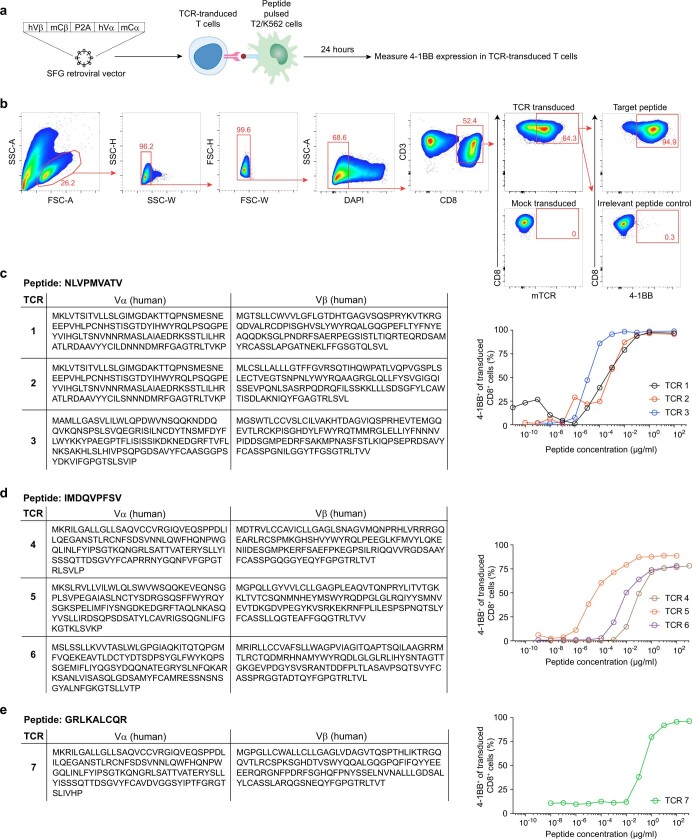
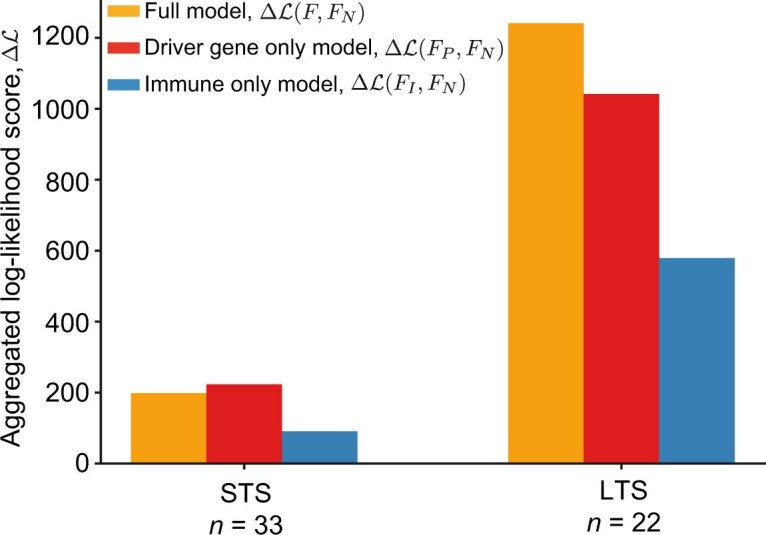
Cancer immunoediting1 is a hallmark of cancer2 that predicts that lymphocytes kill more immunogenic cancer cells to cause less immunogenic clones to dominate a population. Although proven in mice1,3, whether immunoediting occurs naturally in human cancers remains unclear. Here, to address this, we investigate how 70 human pancreatic cancers evolved over 10 years. We find that, despite having more time to accumulate mutations, rare long-term survivors of pancreatic cancer who have stronger T cell activity in primary tumours develop genetically less heterogeneous recurrent tumours with fewer immunogenic mutations (neoantigens). To quantify whether immunoediting underlies these observations, we infer that a neoantigen is immunogenic (high-quality) by two features-'non-selfness' based on neoantigen similarity to known antigens4,5, and 'selfness' based on the antigenic distance required for a neoantigen to differentially bind to the MHC or activate a T cell compared with its wild-type peptide. Using these features, we estimate cancer clone fitness as the aggregate cost of T cells recognizing high-quality neoantigens offset by gains from oncogenic mutations. With this model, we predict the clonal evolution of tumours to reveal that long-term survivors of pancreatic cancer develop recurrent tumours with fewer high-quality neoantigens. Thus, we submit evidence that that the human immune system naturally edits neoantigens. Furthermore, we present a model to predict how immune pressure induces cancer cell populations to evolve over time. More broadly, our results argue that the immune system fundamentally surveils host genetic changes to suppress cancer.


Conflict of interest statement

L.A.R. is listed as an inventor of a patent related to oncolytic viral therapy (US20170051022A1). L.A.R., Z.M.S. and V.P.B. are listed as inventors on a patent application related to work on antigen cross-reactivity. M.Ł., B.D.G. and V.P.B. are listed as inventors on a patent application related to work on neoantigen quality modelling (63/303,500). C.I.-D. has received research support from Bristol-Myers Squibb. B.D.G. has received honoraria for speaking engagements from Merck, Bristol-Meyers Squibb and Chugai Pharmaceuticals; has received research funding from Bristol-Meyers Squibb; and has been a compensated consultant for PMV Pharma and Rome Therapeutics of which he is a co-founder. V.P.B. has received research support from Bristol-Myers Squibb and Genentech. J.W. is a consultant for Adaptive Biotech, Amgen, Apricity, Ascentage Pharma, Arsenal IO, Astellas, AstraZeneca, Bayer, Beigene, Boehringer Ingelheim, Bristol Myers Squibb, Celgene, Chugai, Eli Lilly, Elucida, F Star, Georgiamune, Imvaq, Kyowa Hakko Kirin, Linneaus, Merck, Neon Therapeutics, Polynoma, Psioxus, Recepta, Takara Bio, Trieza, Truvax, Sellas, Serametrix, Surface Oncology, Syndax, Syntalogic and Werewolf Therapeutics. J.W. receives grant/research support from Bristol Myers Squibb and Sephora. J.W. has equity in Tizona Pharmaceuticals, Adaptive Biotechnologies, Imvaq, Beigene, Linneaus, Apricity, Arsenal IO and Georgiamune. T. Merghoub is a co-founder and holds equity in IMVAQ Therapeutics; he is a consultant for Immunos Therapeutics, ImmunoGenesis and Pfizer; he has research support from Bristol-Myers Squibb, Surface Oncology, Kyn Therapeutics, Infinity Pharmaceuticals, Peregrine Pharmaceuticals, Adaptive Biotechnologies, Leap Therapeutics and Aprea; he has patents on applications related to work on oncolytic viral therapy, alphavirus-based vaccine, neoantigen modelling, CD40, GITR, OX40, PD-1 and CTLA-4. The other authors declare no competing interests.

Figures

Fig. 1
Fig. 1. LTSs of PDAC develop tumours with distinct recurrence time, multiplicity and tissue tropism.
a, The experimental design. b, c, Overall survival (b) and disease-free survival (c) of patients with PDAC. dg, The number (d), correlation with overall survival (e), patterns (f) and sites (g) of recurrent PDACs. In g, other indicates omentum, aorta, diaphragm and perirectum (STS); and pericardium, inferior vena cava, adrenal, kidney and liver (LTS). n indicates the number of individual patients (bf) or recurrent tumours (g). The horizontal bars show the median values. P values were determined using two-tailed log-rank tests (Mantel–Cox; b and c), two-tailed Mann–Whitney U-tests (d), two-tailed Pearson correlation (e) and two-tailed χ2 tests (f). Source data
Fig. 2
Fig. 2. LTSs of PDAC develop tumours with fewer neoantigens.
a, Shannon entropy (S, left), and the difference in Shannon entropy between recurrent (Srec) and primary (Sprim) PDACs (right). b, TMB and neoantigen number (NA) in primary and recurrent PDACs. c, d, The difference in TMB and NA (c), and the number of mutations that generate neoantigens (NA Mut) (d) between recurrent and primary PDACs. n indicates the number of individual tumours. The horizontal bars show the median values. For ad, P values were determined using two-tailed Mann–Whitney U-tests. Source data
Fig. 3
Fig. 3. High-quality neoantigens are immunoedited in LTS  PDACs.
a, Neoantigen quality model. b, The model and experimental approach to estimate cross-reactivity distance C. c, d, Measured (top) and fitted (bottom) pMT–TCR activation curves (c, amino acid (AA) position 4), and activation heat maps (d, all amino acid positions) for stronger and weaker pWT–TCR pairs. e, Composite pMT–TCR EC50 values of all stronger and weaker pWT–TCR pairs. f, pMT–TCR activation heat map and observed versus modelled C(pWT, pMT) for the HLA-B*27:05-restricted pWT–TCR pair. n indicates the number of single-amino-acid-substituted pWT, pMT and pMT, pMT pairs. g, Cross-reactivity distance model C and dendrogram of agglomerative clustering of substitution matrix M. h, Observed amino acid substitution frequency versus matrix M-defined substitution distance in primary and recurrent STS and LTS PDACs. M distance is the matrix M-defined amino acid distance from g. Circles indicate substituted residues. n indicates the number of substitutions. i, Cumulative probability distributions of log(C) and D. n indicates the number of neoantigens. The red rectangles in the heat maps indicate amino acids in pWT. The green line is a linear regression fit. Heat maps are ordered according to the amino acid order in the dendogram in g. P values were determined using two-tailed Pearson correlation (f and h) and two-sided Kolmogorov–Smirnov tests (i). Source data
Fig. 4
Fig. 4. The neoantigen quality fitness model identifies edited clones to predict the clonal composition of recurrent tumours.
a, Recurrent tumour clone composition prediction based on the primary tumour composition and the fitness model. b, Model fitted Xˆrecα/Xprimα and observed Xrecα/Xrecα clone frequency changes for the STS (left) and LTS (right) cohorts. Frequency ratios below the sampling threshold were evaluated with pseudocounts. ce, The immune fitness cost F¯I of recurrent tumours (c), new clones (e), and the percentage of new neoantigens in recurrent tumours (d). f, TCR dissimilarity index and immune fitness cost F¯I in tumours. n indicates the number of tumours. The green line is a linear regression fit. The horizontal bars show the median values. P values were determined using two-tailed Spearman correlation (b), two-tailed Pearson correlation (f) and two-tailed Mann–Whitney U-tests (ce). Source data
Extended Data Fig. 1
Extended Data Fig. 1. Top ranked T cells in LTS tumours have more similar CDR3β sequences.
(a) T cell receptor (TCR) CDR3β sequence dissimilarity (TCR dissimilarity index) in STS and LTS primary and recurrent PDACs. TCR dissimilarity index calculated using the Restricted Boltzmann Machine model. n = individual tumours. Horizontal bars = median. (b) Trend of P value of TCR dissimilarity index between STS and LTS PDACs (as in left panel) with number of clones in the sample. n = 17 tumours. Blue line indicates a P value of 0.05; circle = mean P value; error bars = standard error of the mean. (c) TCR dissimilarity index based on T cell clone size (Supplementary Methods) and immune fitness cost F®I. Green line = linear regression fit. P value by two-tailed Mann-Whitney U-test (a) and two-tailed Pearson correlation (c). Source data
Extended Data Fig. 2
Extended Data Fig. 2. Tumour mutational features in STSs and LTSs of PDAC .
(a) Whole-exome sequencing depth and (b) number of synonymous mutations in primary and recurrent PDACs from STSs and LTSs. (c) Oncoprints of driver mutation frequencies in primary and recurrent PDACs. Frequencies = percentage of patients in each cohort that harbor corresponding driver gene mutations. (d) Frequency of primary (left) and recurrent (right) PDACs with mutations in ≥ 3 oncogenes. (e) Number of nonsynonymous mutations (TMB) versus number of mutations in oncogenes in primary and recurrent PDACs. n = individual tumours. Horizontal bars = median. P value by two-tailed Mann-Whitney U-test. Source data
Extended Data Fig. 3
Extended Data Fig. 3. Tumour evolutionary trees in STSs and LTSs of PDAC.
(a, b) Tumour clone phylogenies in primary and recurrent PDACs from STSs (a, n = 6) and LTSs (b, n = 9).
Extended Data Fig. 4
Extended Data Fig. 4. TCR transduction and antigen specificity.
(a) Experimental schema to transduce and measure pWT-specific T cell receptor (TCR) activation. hVα,β = human α and β variable regions; mCα,β = mouse α and β constant regions. (b) Representative gating strategy to detect transduced TCR activation and specificity. (ce) Sequences of model pWTs and pWT-specific TCRs, and TCR activation across varied pWTconcentrations. Source data
Extended Data Fig. 5
Extended Data Fig. 5. T cell activation is variably degenerate to single amino acid substitutions.
(ac) T cell activation to model pWTs (black curves) and single amino acid substituted pMTs (color curves). Source data
Extended Data Fig. 6
Extended Data Fig. 6. T cell activation to degenerate substitutions follows a sigmoidal function.
(ac) Fitted T cell activation curves to model pWTs (black curves) and single amino acid substituted pMTs (color curves). Source data
Extended Data Fig. 7
Extended Data Fig. 7. Cross-reactivity distance C model.
Amino acid position dependent factor (a) and substitution matrix (b) of cross-reactivity model based on T cell receptor (TCR) cross-reactivity to strong (CMV) and weak (gp100) pWTs and single amino acid substituted pMTs (Fig. 3d, e). (c) Correlation of substitution-induced differential MHC-I binding (logA = KdWT/KdMT) and substitution induced differential TCR activation (logC = EC50MT/EC50WT) for all model pWT-TCR pairs and single amino acid substituted pMTs. KdWT and KdWT determined through computational predictions of pWT and pMT binding to HLA-A*02:01 (CMV, gp100 peptides) and HLA-B*27:05 (tumour neopeptide) with Net MHC 3.4. EC50MT and EC50WT measured experimentally through pWT and pMT reactivity to TCRs. n = individual peptide-TCR measurements. P values by two-tailed Pearson correlation (c). Source data
Extended Data Fig. 8
Extended Data Fig. 8. LTS and STS PDACs have equivalent genetic changes in HLA class-I pathway genes.
(a) Number of mutations (synonymous and non-synonymous), homozygous deletions, heterozygous deletions and copy number neutral loss of heterozygosity (LOH) changes in HLA class-I pathway genes (B2M, CANX, CALR, HLA-A, HLA-B, HLA-C, HLA-E, HLA-F, HLA-G, TAP1, TAP2, TAPBP, ERAP1, ERAP2, HSPA5, PDIA3, SAR1B, SEC13, SEC23A, SEC24A, SEC24B, SEC24C, SEC24D, SEC31A) in primary and recurrent PDACs. (b) mRNA expression in HLA class-I pathway genes by bulk RNA sequencing (ICGC, TCGA cohorts) and transcriptional analysis (Affymetrix, Memorial Sloan Kettering Cancer Center (MSKCC) cohort) in primary PDAC tumours. (c) Representative multiplexed immunohistochemical images (left) and ratio (right) of MHC-I+ tumour cells (CK19+) and MHC-I+ non-tumour cells (CK19-) in STS and LTS primary PDACs. n = individual tumours. Horizontal bars = median. Horizontal bars on violin plots show median and quartiles. P value by Wald’s test adjusted for multiple comparison testing. Source data
Extended Data Fig. 9
Extended Data Fig. 9. Evaluation of clone fitness model predictions.
The log-likelihood score (Supplementary Methods, eq. (31)) is shown for the STS and LTS cohorts to estimate the statistical information gain of fitness models and the amount of evidence of the selective pressures captured by each of the models. The orange bars show the aggregated log-likelihood scores, ΔLSTSF,FN and ΔLLTSF,FN, of the two-component fitness model, F, with parameters σI,σP optimized for each recurrent tumour sample, as compared to the null model, FN, standing for neutral clone evolution, with zero fitness and parameters σI=0,σP=0. The red bars present the corresponding aggregated log-likelihood scores ΔLSTSFP,FN and ΔLLTSFP,FN for the driver-gene only fitness model, FP, which accounts for positive selection on driver genes but disregards the effect of immune selection, with parameter σI=0, and σP optimized for each recurrent tumour sample. Finally, the blue bars present the corresponding aggregated log-likelihood scores ΔLSTSFI,FN and ΔLLTSFI,FN for the immune-only fitness model, FI, with parameter σP=0, and σI optimized for each recurrent tumour sample. Source data

References

    1. Shankaran V, et al. IFNγ and lymphocytes prevent primary tumour development and shape tumour immunogenicity. Nature. 2001;410:1107–1111. doi: 10.1038/35074122. - DOI - PubMed
    1. Hanahan D, Weinberg RA. Hallmarks of cancer: the next generation. Cell. 2011;144:646–674. doi: 10.1016/j.cell.2011.02.013. - DOI - PubMed
    1. Matsushita H, et al. Cancer exome analysis reveals a T-cell-dependent mechanism of cancer immunoediting. Nature. 2012;482:400–404. doi: 10.1038/nature10755. - DOI - PMC - PubMed
    1. Łuksza M, et al. A neoantigen fitness model predicts tumour response to checkpoint blockade immunotherapy. Nature. 2017;551:517–520. doi: 10.1038/nature24473. - DOI - PMC - PubMed
    1. Balachandran VP, et al. Identification of unique neoantigen qualities in long-term survivors of pancreatic cancer. Nature. 2017;551:512–516. doi: 10.1038/nature24462. - DOI - PMC - PubMed

MeSH terms

Substances