Clinical Trial
. 2022 Jun;28(6):1256-1268.
doi: 10.1038/s41591-022-01789-0. Epub 2022 May 19.

Rituximab versus tocilizumab in rheumatoid arthritis: synovial biopsy-based biomarker analysis of the phase 4 R4RA randomized trial

Collaborators, Affiliations
Clinical Trial

Rituximab versus tocilizumab in rheumatoid arthritis: synovial biopsy-based biomarker analysis of the phase 4 R4RA randomized trial

Felice Rivellese et al. Nat Med. 2022 Jun.

Abstract

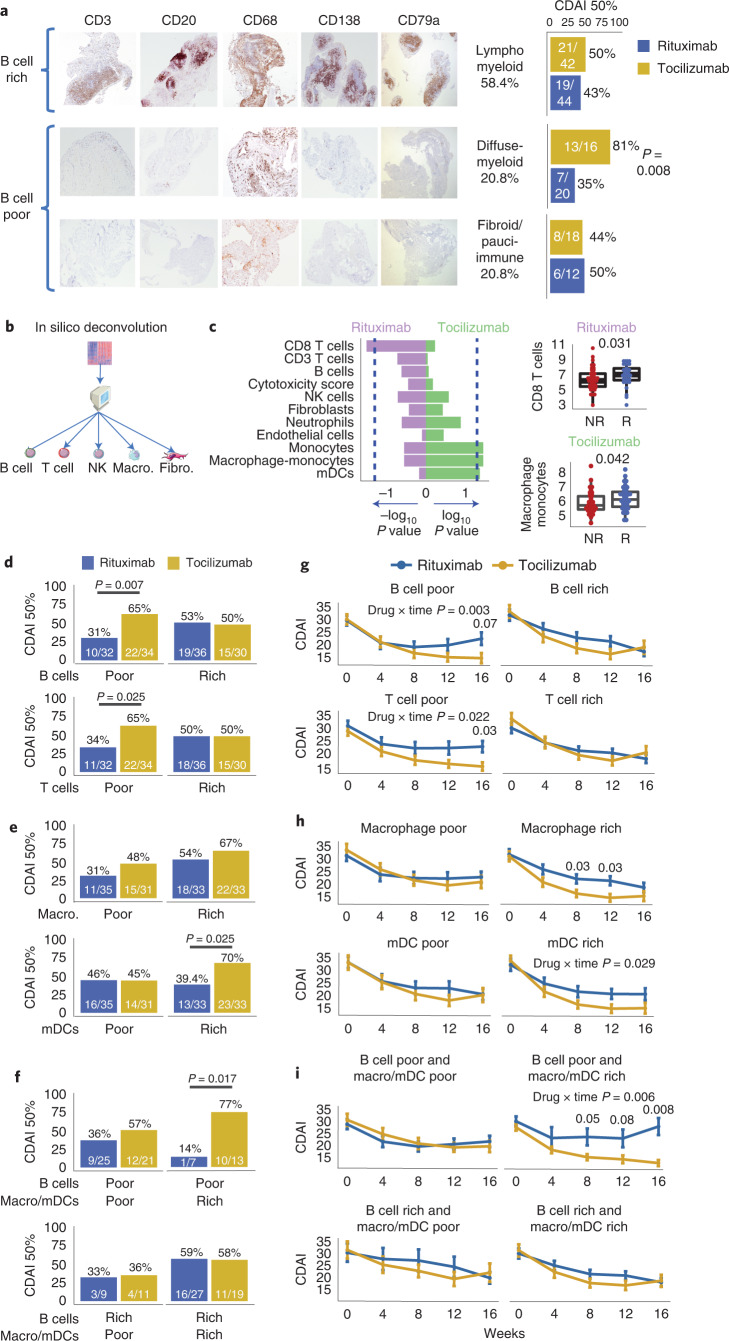
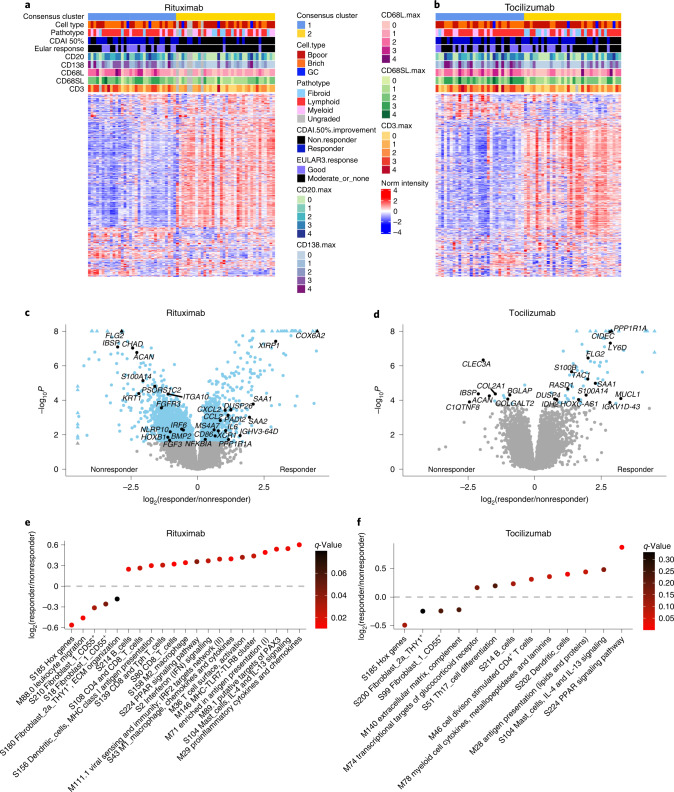
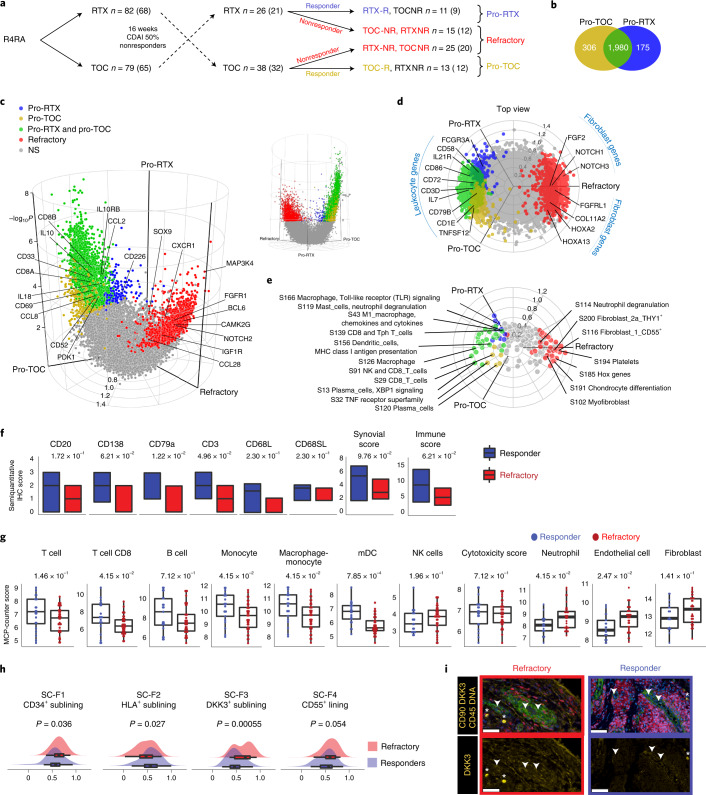
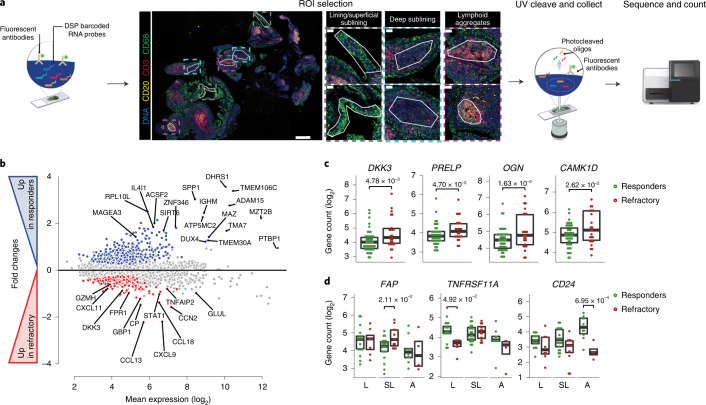
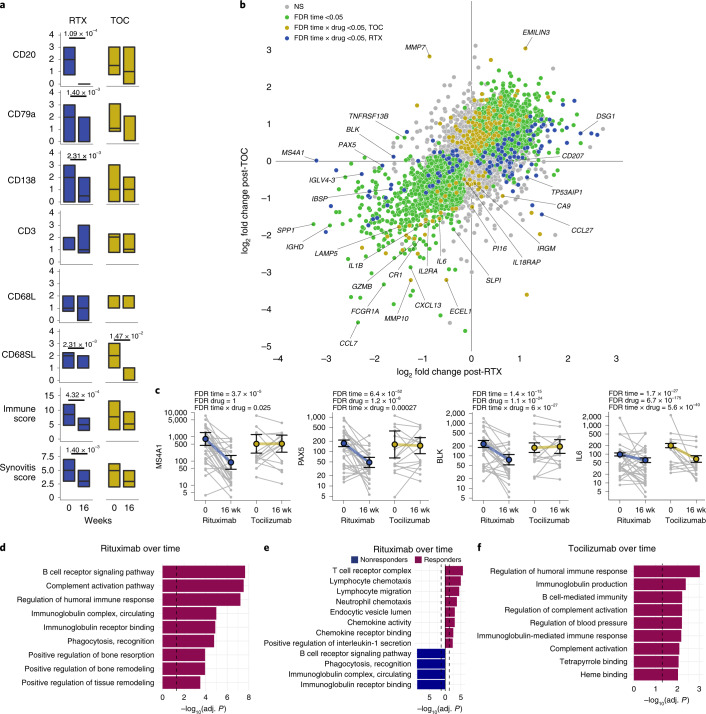
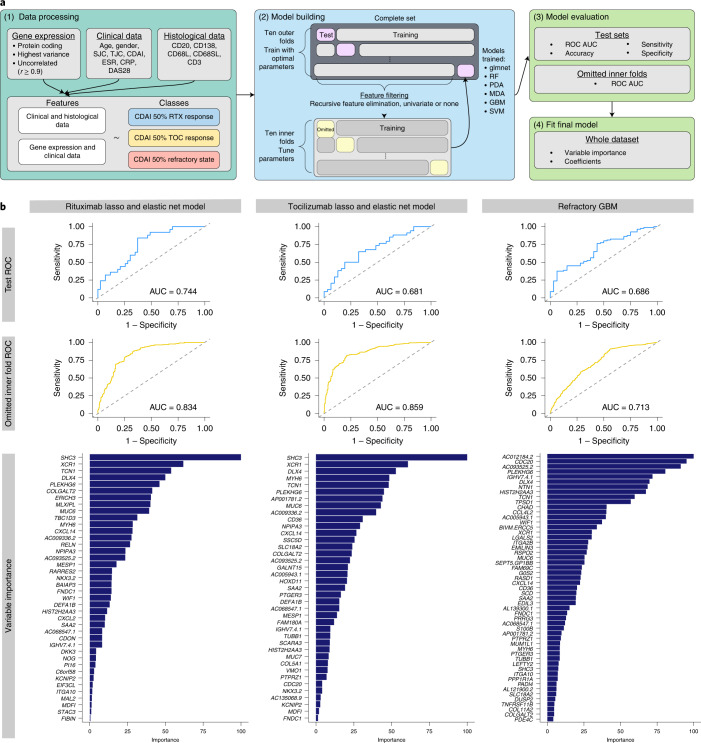
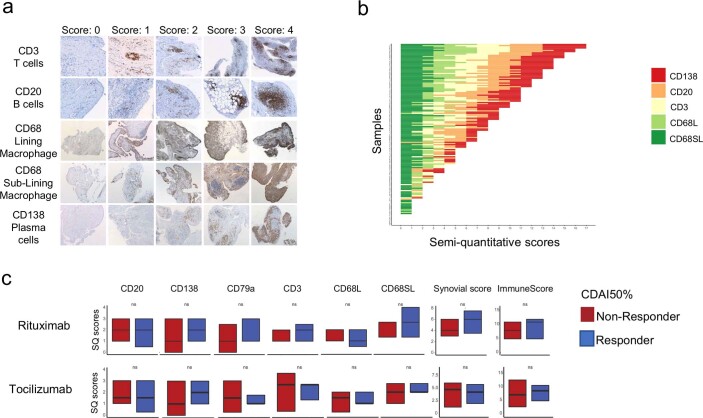
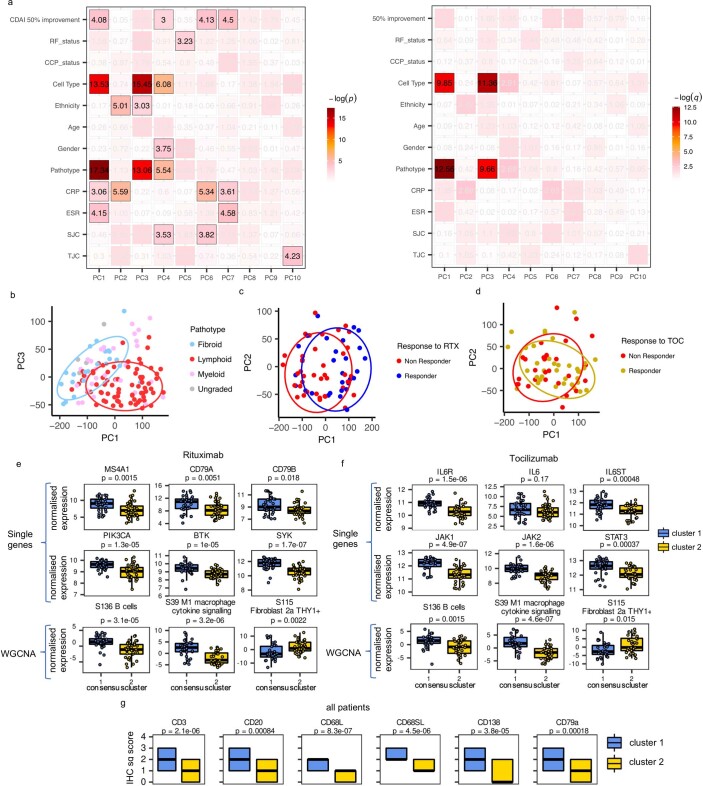
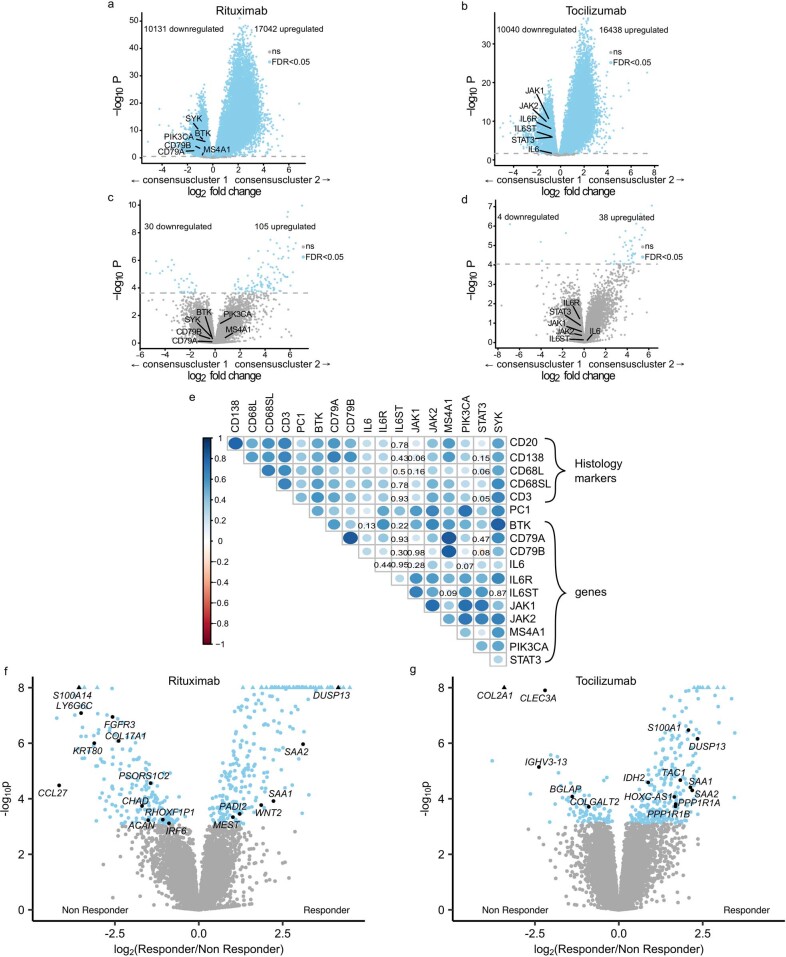
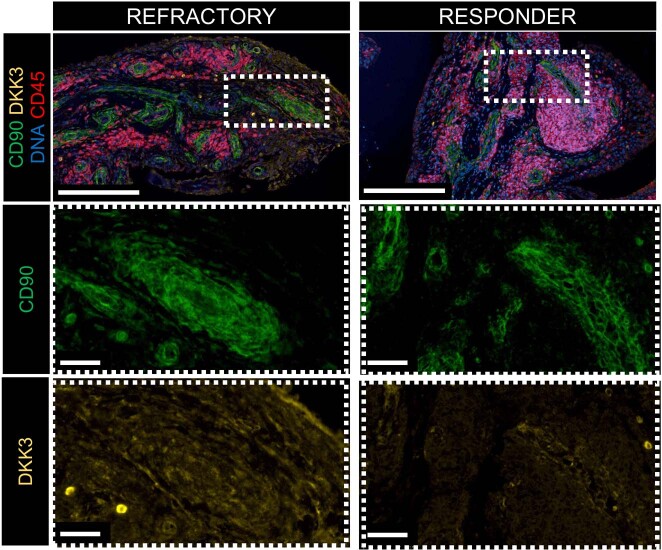
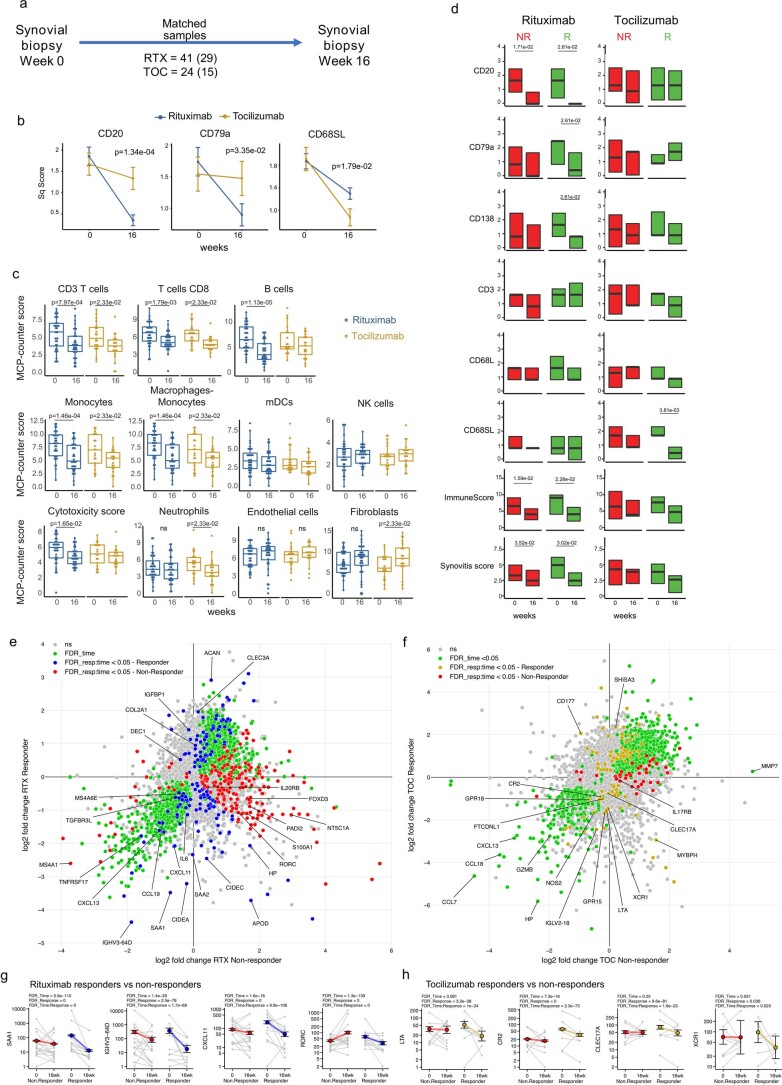
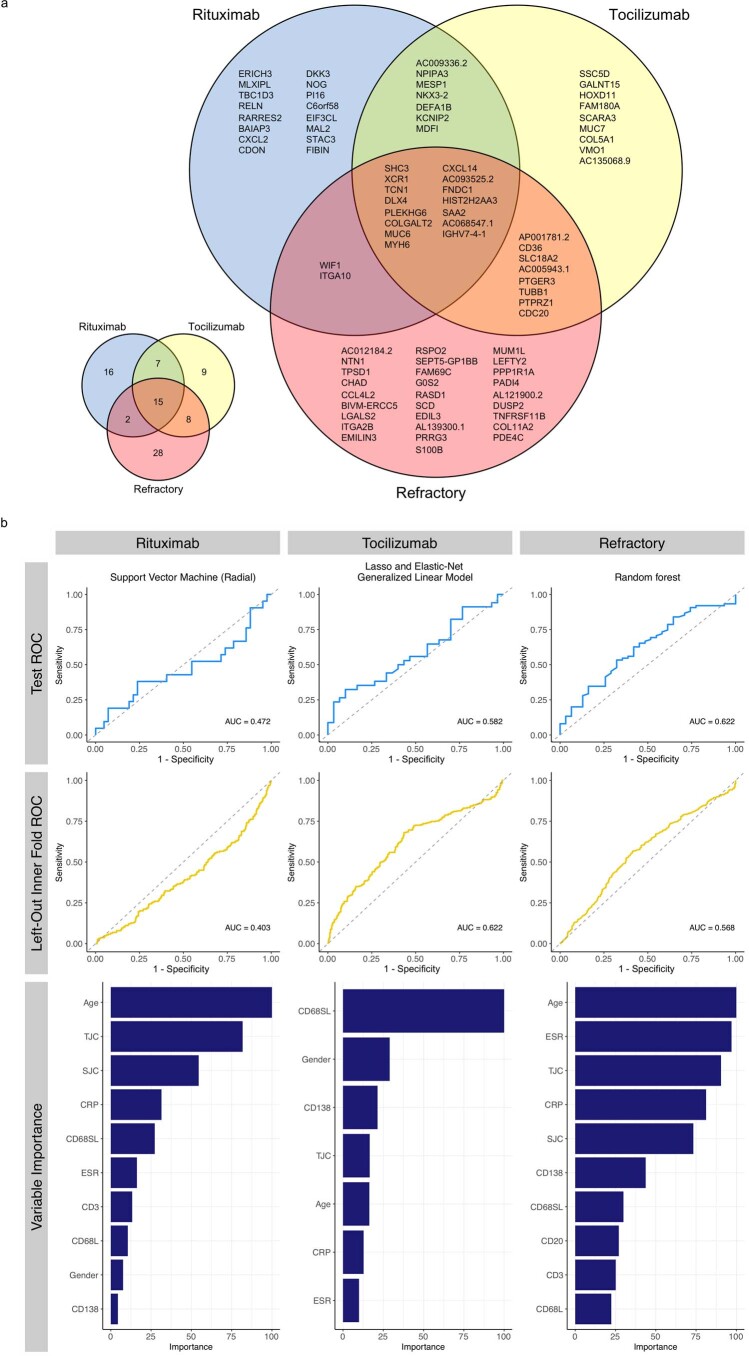
Patients with rheumatoid arthritis (RA) receive highly targeted biologic therapies without previous knowledge of target expression levels in the diseased tissue. Approximately 40% of patients do not respond to individual biologic therapies and 5-20% are refractory to all. In a biopsy-based, precision-medicine, randomized clinical trial in RA (R4RA; n = 164), patients with low/absent synovial B cell molecular signature had a lower response to rituximab (anti-CD20 monoclonal antibody) compared with that to tocilizumab (anti-IL6R monoclonal antibody) although the exact mechanisms of response/nonresponse remain to be established. Here, in-depth histological/molecular analyses of R4RA synovial biopsies identify humoral immune response gene signatures associated with response to rituximab and tocilizumab, and a stromal/fibroblast signature in patients refractory to all medications. Post-treatment changes in synovial gene expression and cell infiltration highlighted divergent effects of rituximab and tocilizumab relating to differing response/nonresponse mechanisms. Using ten-by-tenfold nested cross-validation, we developed machine learning algorithms predictive of response to rituximab (area under the curve (AUC) = 0.74), tocilizumab (AUC = 0.68) and, notably, multidrug resistance (AUC = 0.69). This study supports the notion that disease endotypes, driven by diverse molecular pathology pathways in the diseased tissue, determine diverse clinical and treatment-response phenotypes. It also highlights the importance of integration of molecular pathology signatures into clinical algorithms to optimize the future use of existing medications and inform the development of new drugs for refractory patients.


Conflict of interest statement

S.E.C., B.M.H. and S.E.W. are employees and stockholders of NanoString Technologies, Inc. C.P. and M.J.L. are inventors on a patent application (no. GB 2100821.4), submitted by Queen Mary University of London, that covers methods used to select treatments in RA. All other authors declare no competing interests.

Figures

Fig. 1
Fig. 1. Synovial histological markers at baseline associate with response to rituximab and tocilizumab.
a, Classification into synovial pathotypes according to semiquantitative scores for CD3+ T cells, CD20+ B cells, CD68+ macrophages and CD138+ plasma cells, with representative examples from patients classified as lymphomyeloid (CD20 ≥ 2 and/or CD138≥2), diffuse-myeloid (CD68SL≥2, and CD20/CD138<2) or fibroid/pauci-immune (CD68SL/CD20/CD138<2). Right, 16-week CDAI 50% response in patients stratified by pathotype (n = 152). Bar plots showing the proportion of CDAI 50% responders for rituximab (in blue) and tocilizumab (in yellow) within each pathotype, with corresponding exact numbers. Fisher's test, exact P values for P < 0.05. b, Approach to in silico deconvolution of synovial tissue using MCP-counter. c, MCP-counter scores for each cell type compared among CDAI 50% responders (R) and nonresponders (NR). Bar plots indicate nominal log10 P values for tocilizumab and –log10 P values for rituximab (two-sided Mann–Whitney test); dashed lines correspond to P = 0.05. Boxplots (right) show median and first and third quartiles, whiskers extending to the highest and lowest values. df, 16-week CDAI 50% response in patients stratified into B and T cell poor/rich (d) and macrophage/mDC poor/rich (e) according to median MCP-counter scores for individual cells (rich if above median, poor if below), or by combining B cell and macrophage/mDC scores from d,e (f). Exact P values shown when <0.05, two-sided Fisher's test comparing the proportions of responders to rituximab (in blue) and tocilizumab (in yellow). gi, Longitudinal disease activity scores (CDAI), shown as mean ± s.d., for each month from baseline to 16 weeks for patients randomized to rituximab (in blue) or tocilizumab (in yellow) and classified as B and T cell poor/rich (g), macrophage/mDC poor/rich (h) and combined B cell/macrophage poor/rich (i). Comparison of CDAI between the two medications at individual time points by two-sided Mann–Whitney test, exact P values for <0.05 (adjustment for multiple comparisons by FDR). P values for the drug × time interaction term (two-way repeated-measures analysis of covariance) are shown when <0.05. ci, n = 133 patients with baseline RNA-seq. NK, natural killer cells. mDC, myeloid dendritic cells.
Fig. 2
Fig. 2. Molecular signatures of response and nonresponse to rituximab and tocilizumab.
a,b, Monte Carlo reference-based consensus clustering of the 22,256 most variable genes identified a high-inflammatory-consensus cluster 1 (blue) and low-inflammatory cluster 2 (yellow). Heatmaps were produced for patients treated with rituximab (n = 68, a) and tocilizumab (n = 65, b) using Pearson’s distance metric and the complete linkage method using the ComplexHeatmap package in R. Upper tracks show consensus cluster, cell type (B cell rich/poor), the overall pathotype, CDAI 50% response, EULAR response and histological scores for CD20, CD138, CD68L, CD68SL and CD3. c,d, Volcano plots of DEGs using DESeq2 comparing CDAI 50% responders versus nonresponders to rituximab (c) and tocilizumab (d). Comparison between groups using Wald's test and correcting for multiple testing, Storey’s q-value (q < 0.05 significant, shown in blue). Positive and negative values represent upregulation and downregulation, respectively, in responders and nonresponders. e,f, Modular analysis applying QuSAGE to responders versus nonresponders to rituximab (e) and tocilizumab (f); log2 fold changes of responders (positive values) and nonresponders (negative values) are plotted for blood microarray-based modules, with WGCNA modules summarized in one plot and dots color coded for their q-value.
Fig. 3
Fig. 3. Identification of multidrug nonresponse (refractory) signature.
a, Patient classification according to treatment switch (complete scheme shown in Supplementary Fig. 1): patients responding to rituximab (RTX) following tocilizumab (TOC) failure (pro-rituximab, blue), patients responding to tocilizumab following rituximab failure (pro-tocilizumab, yellow) and patients in whom both drugs failed sequentially (refractory, red). Numbers in brackets denote patients with available RNA-seq. b, Venn diagram showing the overlap of DEGs between patients classified as in a. c,d, Three-way DEG analysis on baseline synovial biopsies of patients classified as in a, with side (c) and top view (d). Significant differences in pro-rituximab (blue), pro-tocilizumab (yellow) and refractory (red) patients and significant genes overlapping in pro-rituximab and pro-tocilizumab patients (green) are color coded. Significance was internally estimated by the volcano3D package combining significance (q < 0.05) from both LRT and pairwise Wald test via DESeq2. e, Three-way QuSAGE radial plot showing differential WGCNA module expression in patients classified as above. f, Histological semiquantitative scores for immune cells in refractory patients (n = 40) and responders to one of any two medications (n = 24). Boxplots showing median and first and third quartiles. Two-way Mann–Whitney test, exact P values FDR adjusted for multiple comparisons. g, Deconvolution of immune cells using MCP-counter in patients classified as refractory or responders as in a. Boxplots showing median and first and third quartiles, dot-plots showing individual patients. Two-way Mann–Whitney test, exact P values FDR adjusted for multiple comparisons. h, Fibroblast single-cell subset enrichment scores in refractory patients (n = 32) or responders to either rituximab or tocilizumab (n = 21), as in a. Boxplots showing median and first and third quartiles, whiskers extending to the highest and lowest values. Exact P values are shown, two-sided Mann–Whitney test. i, Multiplex immunofluorescence in refractory and responder patients; nuclear staining (blue), CD45 (red), CD90 (green), DKK3 (yellow) (all top) and DKK3 single staining (yellow, bottom). *, DKK3+CD45+ lymphocytes; arrowheads, DKK3+CD90+ fibroblasts. A larger overview and individual stainings are provided in Extended Data Fig. 4. Representative images out of a total of three refractory and three responders. Scale bars, 50 μm. NS, not significant.
Fig. 4
Fig. 4. DSP of refractory RA.
a, Scheme showing the approach to DSP, including selection of ROIs: CD68+ lining and superficial sublining, CD20CD3 deep sublining and CD3+CD20+ lymphoid aggregates. b, MA plot showing mean expression (log2) on the x axis and fold change on the y axis comparing responders and refractory patients across all ROIs. Genes significantly upregulated (FDR<0.05) in responders are shown in blue (top), and those upregulated in refractory in red (bottom); in grey, genes with FDR > 0.05; P values were calculated using a negative binomial linear model applied to count data using DESeq2 (Wald test) and were FDR adjusted n = 12 patients, six ROIs per patient. c, Example of individual genes differentially expressed in refractory (red) or responders (green). Scatterplots showing individual ROIs, boxplots showing median and first and third quartiles. FDR-adjusted P values calculated as in b are shown for differentially expressed genes between refractory and responder individuals; n = 12 patients (4 responders to rituximab, 4 responders to tocilizimab and 4 refractory). d, Examples of individual genes differentially expressed in refractory (red) or responders (green) in different ROIs. Scatterplots showing individual ROIs (n = 12 patients, six ROIs per patient), boxplots showing median and first and third quartiles. FDR-adjusted P values calculated as in b are shown for differentially expressed genes between refractory and responder individuals. L, lining/superficial sublining; SL, deep sublining; A, lymphoid aggregates (as shown in a).
Fig. 5
Fig. 5. Histological and molecular analysis of paired pre- and post-treatment synovial biopsies.
a, Semiquantitative histological scores of synovial immune cells at baseline and 16 weeks in patients treated with rituximab and tocilizumab. Boxplots showing median and first and third quartiles. P values shown when <0.05, two-sided Wilcoxon signed-rank test (paired) comparing baseline and 16 weeks, adjusted for multiple testing by FDR; n = 65 patients with matched baseline and 16-week samples (41 randomized to rituximab, 24 to tocilizumab). b, Scatter plots comparing longitudinal gene expression changes between drugs over 16 weeks of treatment in 88 paired biopsies from 44 patients following treatment with rituximab (n = 29) or tocilizumab (n = 15). log2 fold change in expression following rituximab or tocilizumab is represented on the x and y axis, respectively. Genes equally affected by each drug lie along the line of identity. Fold change and statistical analysis of longitudinal differential gene expression were calculated by negative binomial general linear mixed-effects model. Genes in green show significant (FDR < 0.05) overall change in expression over time; those in blue/yellow show significantly differential change in expression over time between the two drugs based on significant (FDR < 0.05) interaction term time×medication (Methods). Genes with greater absolute fold change following rituximab or tocilizumab are shown in blue and yellow, respectively. c, Scatter plots for selected genes with colored points showing regression line of fitted mixed-effects model, with error bars showing 95% CIs (fixed effects). Gray points and lines show raw paired count data, with numbers as per the analysis above. df, Pathway analysis using a two-sided hypergeometric test to enrich downregulated genes between baseline and 16 weeks in patients treated with rituximab (d), responders and nonresponders to rituximab (e) and responders to tocilizumab (f). Dashed line indicates adjusted P = 0.05 (Bonferroni adjustment).
Fig. 6
Fig. 6. Predictive models using nested ten-by-ten-fold cross-validation for response to rituximab and tocilizumab.
a, Machine learning pipeline utilized to predict CDAI 50% response to rituximab and/or tocilizumab using gene expression, clinical data and histological data as features (n = 133). Data processing (1) involved selection of protein-coding genes with the highest variance and removal of highly correlated genes. Data were split into ten inner and ten outer folds for building machine learning models (2). In models built using gene expression, RFE or univariate filtering was used to select the most important/predictive features for each model. Each model was evaluated on both the test set and the set omitted during cross-validation (3). Average tuned parameters from the outer folds were used to fit to the whole dataset to determine the importance of features selected for each model (4). b, Grid of plots showing optimal predictive models for different treatments (left, glmnet rituximab response prediction; middle, glmnet tocilizumab response prediction; right, GBM refractory response prediction) using gene expression and baseline clinical parameters as features. From top to bottom, plots show ROC curves for the best model on the test dataset (from outer fold), ROC curves on the omitted dataset (from inner fold) and variable importance when fit to the whole dataset.
Extended Data Fig. 1
Extended Data Fig. 1. Histological analyses.
a, Atlas of semi-quantitative synovial IHC scores for immune cells. b, Distribution of semiquantitative scores at baseline in all patients, individually shown in the y axis. The total on the x axis represents the sum of the individual scores (Immune score). c, Baseline semi-quantitative IHC scores, Krenn synovitis score (‘Synovial score’) and total Immune score in patients stratified according to 16 weeks CDAI50% response to rituximab (top) and tocilizumab (bottom). Two-sided Mann Whitney test. ns= p value >0.05. n = 161 patients. Boxplots showing median with first and third quartiles.
Extended Data Fig. 2
Extended Data Fig. 2. Unsupervised Principal Component Analysis shows association primarily with cell types present and consequently also pathotype.
a, Clinical features and their degree of association with Principal Components (PC) 1–10 with coloring indicating the –log(p) (left) and FDR corrected –log(q) value (right). RF, Rheumatoid Factor; CCP, anti-Cyclic Citrullinated Protein; CRP, C-Reactive Protein; ESR, Erythrocyte Sedimentation Rate; SJC, Swollen Joint Counts; TJC, Tender Joint Count. b, PC 1 and 3 gene expression variance with coloring by (b) pathotypes showing fibroid (blue), lymphoid (red), myeloid (pink) and ungraded (grey) patients. Ellipses indicate 80% confidence interval. c and d, PC1 and 2 colored by response to treatment. Patients allocated to treatment group rituximab are displayed in c and to tocilizumab in d, with non response colored in red, response to RTX in blue and response to TOC in gold. Ellipses shown for all PCs represent the 80% confidence interval. e, Differential expression of genes important for B-cells (MS4A1, CD79A, CD79B, PIK3CA, BTK and SYK) and Weighted Gene Correlation Network Analysis (WGCNA) cell modules (B-cells, M1 macrophage cytokine signalling, Fibroblast 2a THY1+) in Rituximab treated patients (n = 68), according to the consensus clusters shown in (Fig. 2a). Boxplots show median with upper and lower hinges and whiskers extending to highest and lowest point, but at most 1.5x the interquartile range. p-values stated for Kruskal-Wallis test. f, IL-6 related genes (IL6R, IL6, IL6ST, JAK1, JAK2 and STAT3) and WGCNA cell modules expression in tocilizumab (Fig. 2b) treated patients (n = 65) based on consensus clusters. Boxplots as above. g, Boxplots showing median with upper and lower hinges for semiquantitative histological scores of CD3, CD20, CD68L, CD68SL, CD138 and CD79a for all patients (n = 133) split into consensuscluster 1 and consensuscluster 2. Kruskal-Wallis test p-values are shown.
Extended Data Fig. 3
Extended Data Fig. 3. Influence of immune cells on consensusclusters.
a-d, Volcano plots showing differential gene expression analysis using DESeq2 comparing consensuscluster 1 and 2 of patients treated with rituximab (left) or tocilizumab (right). While a and b were analyzed without covariates, c and d were adjusted for principal component (PC1). Comparison between groups were tested for significance using Wald test and multiple testing was corrected for with Storey’s q value (q < 0.05 = significant, shown in blue). Positive log2fold changes represent upregulation in consensuscluster 2, negative log2fold changes represents upregulation in consensuscluster 1. e, Correlation plot highlighting relation between PC1, histology markers and genes involved in the mode of action of RTX and TOC. Positive correlation is shown in blue while red would indicate negative correlation. For all correlations without significance, the p-value is shown. f,g, Volcano plots of DEGs using DESeq2 comparing CDAI50% responders versus non responders to rituximab (f) and tocilizumab (g) after adjustment for principal component 1. Comparison between groups using Wald test and correcting for multiple testing Storey’s q value (q < 0.05 = significant, shown in blue). Positive values represent upregulation in responders and negative values downregulation compared to non-responders.
Extended Data Fig. 4
Extended Data Fig. 4. Immunofluorescence of DKK3 + fibroblasts.
DKK3 + fibroblasts in refractory (left) and responder (right) patients (representative image out of 3 refractory and 3 responders). Immunofluorescence with DNA in blue, CD45 in red, CD90 in green and DKK3 in yellow. Lines at 0.250 mm in the overview (top panels) and 0.05 mm in the higher magnification (bottom panels).
Extended Data Fig. 5
Extended Data Fig. 5. Longitudinal analysis of paired pre- and post-treatment synovial biopsies.
a, Schema showing an overview of longitudinal analysis of matched pre and post-treatment synovial biopsies, with number of samples for each medication (in brackets samples with available RNA-Seq). b, Semi-quantitative scores at baseline and 16 weeks in patients stratified according to treatment with rituximab (n = 41) or tocilizumab (n = 24). Mean ± SEM. Exact p values from two-sided analysis of covariance testing the difference in the changes from baseline between treatments, with treatment as factor and baseline score as covariate. c, MCP-counter scores in baseline and 16 weeks samples. Scatterplots showing individual samples and boxplots showing median and first and third quartiles, whiskers extending to the highest and lowest values no further than 1.5*interquartile range. Two-sided Wilcoxon signed-rank test (paired), comparing baseline and 16 weeks, adjusted for multiple testing by false discovery rate. n = 29 for rituximab and n = 15 for tocilizumab. d, Semi-quantitative scores of synovial immune cells at baseline and 16 weeks in patients treated with rituximab (n = 41) and tocilizumab (n = 24), stratified by CDAI50% response (NR = non responders, R = responders). Boxplots showing median and first and third quartiles. p values shown when <0.05, two sided Wilcoxon signed-rank test (paired) comparing baseline and 16 weeks, adjusted for multiple testing by false discovery rate. e,f, Longitudinal negative binomial mixed effects model on Rituximab (n = 29) and (f) Tocilizumab (n = 15) treated patients showing differential gene expression between responders and non-responders categorised by CDAI 50% response. Blue genes show greater absolute gene expression change in rituximab responders, yellow genes show greater absolute gene expression change in tocilizumab responders, while red genes showed greater absolute gene expression change in non-responders. g,h Scatter plots of representative genes with coloured points showing regression line of fitted negative binomial mixed effects model with error bars showing 95% confidence intervals (fixed effects) from analyses in e & f respectively. Grey points and lines show raw paired count data. n = 29 for rituximab and n = 15 for tocilizumab.
Extended Data Fig. 6
Extended Data Fig. 6. Venn diagram showing overlap in genes between machine learning models and comparison with models built using only clinical and histological variables.
a, Venn diagram showing the overlap in genes selected as features in optimal predictive models for prediction of rituximab and tocilizumab response at week 16 and refractory state (failure to respond to both rituximab and tocilizumab). b, Grid of plots showing the optimal predictive models for different treatment when using clinical and histological variables only. From top to bottom plots show: ROC curves for the best model on the test data (from outer-fold) set; ROC curves on the left-out (from inner-fold) set; and the variable importance when fit to the whole data set.

Comment in

Similar articles

Cited by

References

    1. Smolen, J. S. et al. Rheumatoid arthritis. Nat. Rev. Dis. Prim.4, 18001 (2018). 10.1038/nrdp.2018.1 - DOI - PubMed
    1. Buch, M. H. Defining refractory rheumatoid arthritis. Ann. Rheum. Dis.77, 966–969 (2018). 10.1136/annrheumdis-2017-212862 - DOI - PubMed
    1. Borghaei, H. et al. Nivolumab versus docetaxel in advanced nonsquamous non-small-cell lung cancer. N. Engl. J. Med.373, 1627–1639 (2015). 10.1056/NEJMoa1507643 - DOI - PMC - PubMed
    1. Kawalec, P., Łopuch, S. & Mikrut, A. Effectiveness of targeted therapy in patients with previously untreated metastatic breast cancer: a systematic review and meta-analysis. Clin. Breast Cancer15, 90–100 (2015). 10.1016/j.clbc.2014.10.006 - DOI - PubMed
    1. Pitzalis, C., Choy, E. H. S. & Buch, M. H. Transforming clinical trials in rheumatology: towards patient-centric precision medicine. Nat. Rev. Rheumatol.16, 590–599 (2020). 10.1038/s41584-020-0491-4 - DOI - PubMed

Publication types

MeSH terms