. 2022 Oct;22(5):969-983.
doi: 10.3758/s13415-022-01009-9. Epub 2022 May 19.

Exploration heuristics decrease during youth

Affiliations

Exploration heuristics decrease during youth

Magda Dubois et al. Cogn Affect Behav Neurosci. 2022 Oct.

Abstract

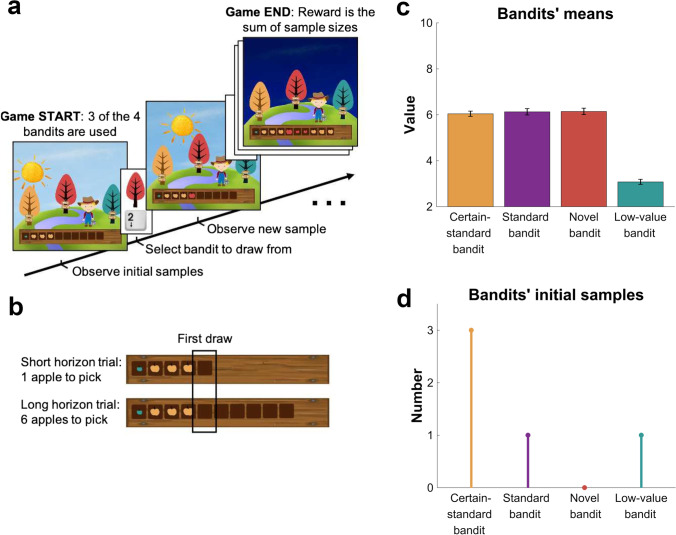
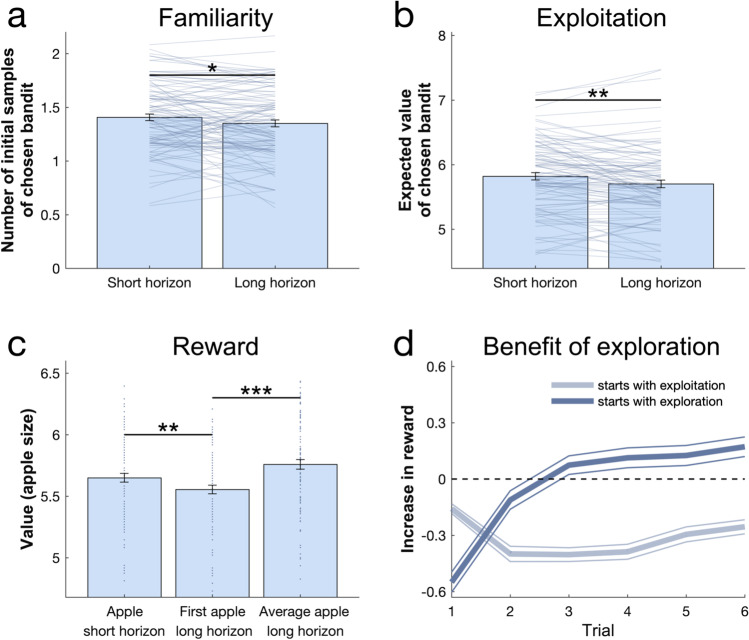
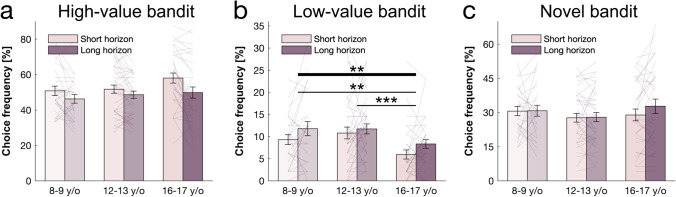
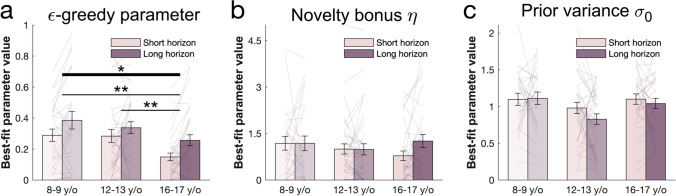
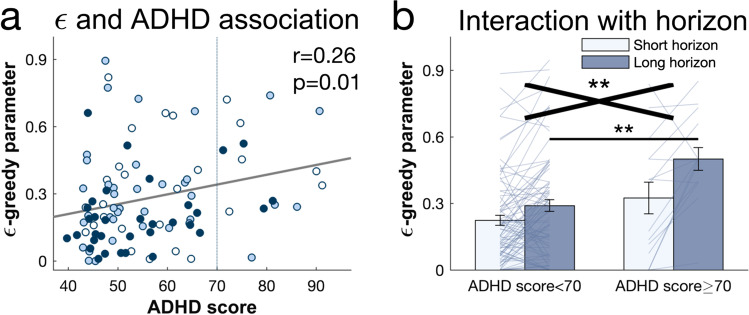
Deciding between exploring new avenues and exploiting known choices is central to learning, and this exploration-exploitation trade-off changes during development. Exploration is not a unitary concept, and humans deploy multiple distinct mechanisms, but little is known about their specific emergence during development. Using a previously validated task in adults, changes in exploration mechanisms were investigated between childhood (8-9 y/o, N = 26; 16 females), early (12-13 y/o, N = 38; 21 females), and late adolescence (16-17 y/o, N = 33; 19 females) in ethnically and socially diverse schools from disadvantaged areas. We find an increased usage of a computationally light exploration heuristic in younger groups, effectively accommodating their limited neurocognitive resources. Moreover, this heuristic was associated with self-reported, attention-deficit/hyperactivity disorder symptoms in this population-based sample. This study enriches our mechanistic understanding about how exploration strategies mature during development.

Keywords: Adolescence; Decision-making; Exploration; Impulsivity.


Conflict of interest statement

The authors declare no competing interests.

Figures

Fig. 1
Fig. 1
Exploration task. In the Maggie’s farm task, subjects had to choose from three bandits (depicted as trees) to maximise their overall reward. The rewards (apple size) of each bandit followed a normal distribution with a fixed sampling variance. (a) At the beginning of each trial, subjects are provided with some initial samples (number varied depending on the bandits present on that trial) on the wooden crate at the bottom of the screen and subjects had to select which bandit they want to sample from next. (b) Depending on the condition, they can either make one draw (short horizon) or six draws (long horizon). The empty spaces on the wooden crate (and the position of the sun) indicate how many draws they have left. Bandits could be of four generative groups characterized by different (c) mean reward and (d) number of initial samples (Methods for details)
Fig. 2
Fig. 2
Benefits of exploration. (a) Subjects (collapsed across all age groups) chose less familiar (i.e., more informative) bandits on their first choice in the long compared to the short horizon. (b) Subjects chose bandits with a lower expected value (i.e., they exploited less) in the long horizon compared to the short horizon. (c) This behaviour led to a lower reward in the long horizon than in the short horizon on their first draw, indicating that subjects sacrificed larger initial outcomes for the benefit of more information. This additional information helped making better decisions in the long run, leading to higher earnings over all draws in the long horizon (right bar plot). Similarly, (d) in the long horizon, starting off by exploring (dark blue) versus exploiting (choosing the bandit with the highest expected value; light blue), led to an initial decrease in reward (negative increase in reward; difference between obtained reward and highest reward of initial samples), but eventually increased it. This means that the information that was gained through exploration led to higher long-term outcomes. *p < 0.05; **p < 0.01; ***p < 0.001. Data are mean ± SEM and each dot/line represent a subject
Fig. 3
Fig. 3
Subjects use a mixture of exploration strategies. A sixfold cross-validation of the likelihood of held-out data was used for model selection. The labels on the x-axis capture the contributions of different models: uncertainty-dependent value-based random exploration (Thompson, i.e., Thompson sampling algorithm), directed exploration and value-based random exploration (UCB, i.e., UCB algorithm combined with a softmax decision function), a mixture of those three (hybrid, i.e., combined UCB and thompson), value-free random exploration (ϵ, i.e., ϵ-greedy parameter) and novelty exploration (η, i.e., novelty bonus parameter). (a) The average held-out data likelihood with standard error of the mean (SEM) bars. (b) The exceedance probabilities when using Bayesian model selection predicted the winning model: the Thompson model with both the ϵ-greedy parameter and the novelty bonus η. (c) Model simulation with 47 simulations predicted good recoverability of model parameters; σ0 is the prior variance and Q0 is the prior mean (cf. Supplementary Material for details about the models); 1 stands for short horizon-, and 2 for long horizon-specific parameters
Fig. 4
Fig. 4
Behavioural age effects. Choice patterns in the first draw for each horizon and age group (children: ages 8 and 9 years, early adolescents: ages 12 and 13 years, late adolescents: ages 16 and 17 years). (a) Early and late adolescents, but not children, sampled from the high-value bandit (i.e., bandit with the highest average reward of initial samples) more in the short horizon compared to the long horizon, showing that the horizon manipulation altered exploration behaviour. (b) Late adolescents sampled less from the low-valued bandit compared to the children and early adolescents indicating that value-free random exploration is reduced midway through adolescence. (c) Age groups did not differ in the amount of novelty exploration as measured by the choice frequency of the novel bandit, although it seems that its modulation by the horizon emerges in the old adolescent group. Horizontal bars represent rm-ANOVA (thick) and pairwise comparisons (thin). *p < 0.05; **p < 0.01; ***p < 0.001. Data are mean ± 1 SEM and each line represent one subject
Fig. 5
Fig. 5
Age effects on model parameters. The winning model’s parameters were fitted to each subject’s first draw. (a) Late adolescents had lower values of ϵ (value-free random exploration) overall compared to children and early adolescents, indicating that value-free random exploration decreases during adolescence. Children and late adolescents had higher values of ϵ in the long compared to the short horizon. (b) Subjects from all groups assigned a similar value to novelty, captured by the novelty bonus η. It was higher (more novelty exploration) in the long compared with the short horizon for late adolescents only indicating a goal-directed novelty exploration. (c) Subjects from all groups were similarly uncertain (prior variance σ0 value) about a bandit’s prior mean indicating a similar uncertainty-driven value-based exploration. p < 0.10; *p < 0.05; **p < 0.01; ***p < 0.001. Data are mean ± SEM and each line represent one subject
Fig. 6
Fig. 6
Increased value-free random exploration in ADHD. (a) Value-free random exploration (as captured by the model parameter ϵ) was linked to ADHD symptom scores in this population sample. A score >70 (dashed vertical line) is considered very elevated (Conners, 2008). Each dot represents one subject. White: children, light blue: early adolescents, dark blue: late adolescents. (b) Further analysis revealed an excessive usage of value-free random exploration specifically in the long horizon in the very elevated ADHD score group (subjects with an ADHD score ≥70). Black cross: score-by-horizon interaction. Black line: pairwise t-tests. Overall, our results suggest an overuse of value-free random exploration in ADHD. **p < 0.01; ns = p > 0.05. Data are mean ± 1 SEM and each line represent one subject

References

    1. Addicott MA, Pearson JM, Schechter JC, Sapyta JJ, Weiss MD, Kollins SH. Attention-deficit/hyperactivity disorder and the explore/exploit trade-off. Neuropsychopharmacology. 2020;May:1–8. doi: 10.1038/s41386-020-00881-8. - DOI
    1. Alméras, C., Chambon, V., & Wyart, V. (2022). Competing cognitive pressures on human exploration in the absence of trade-off with exploitation. PsyArXiv.
    1. Anderson, P. (2002). Assessment and development of executive function (EF) during childhood. Child Neuropsychology. 10.1076/chin.8.2.71.8724 - PubMed
    1. Arnsten, A. F. T., & Pliszka, S. R. (2011). Catecholamine influences on prefrontal cortical function: Relevance to treatment of attention deficit/hyperactivity disorder and related disorders. Pharmacology Biochemistry and Behavior. 10.1016/j.pbb.2011.01.020 - PMC - PubMed
    1. Auer P. Using confidence bounds for exploitation-exploration trade-offs. Journal of Machine Learning Research. 2003;3(3):397–422. doi: 10.1162/153244303321897663. - DOI

Publication types