. 2022 May 19;12(1):8385.
doi: 10.1038/s41598-022-12438-4.

OsSCL30 overexpression reduces the tolerance of rice seedlings to low temperature, drought and salt

Affiliations

OsSCL30 overexpression reduces the tolerance of rice seedlings to low temperature, drought and salt

Jia Zhang et al. Sci Rep. .

Abstract

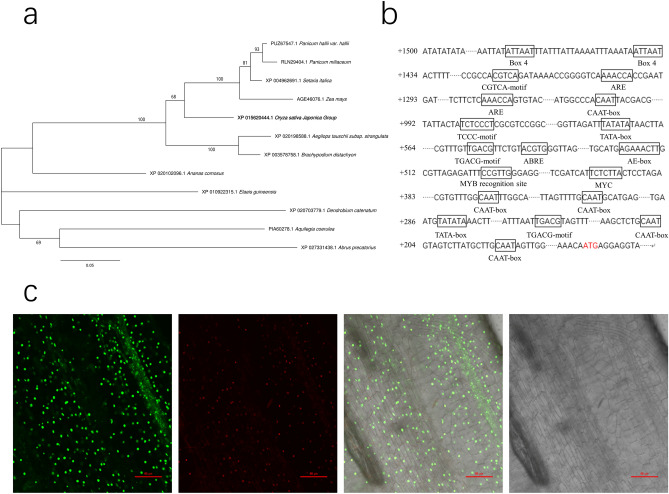
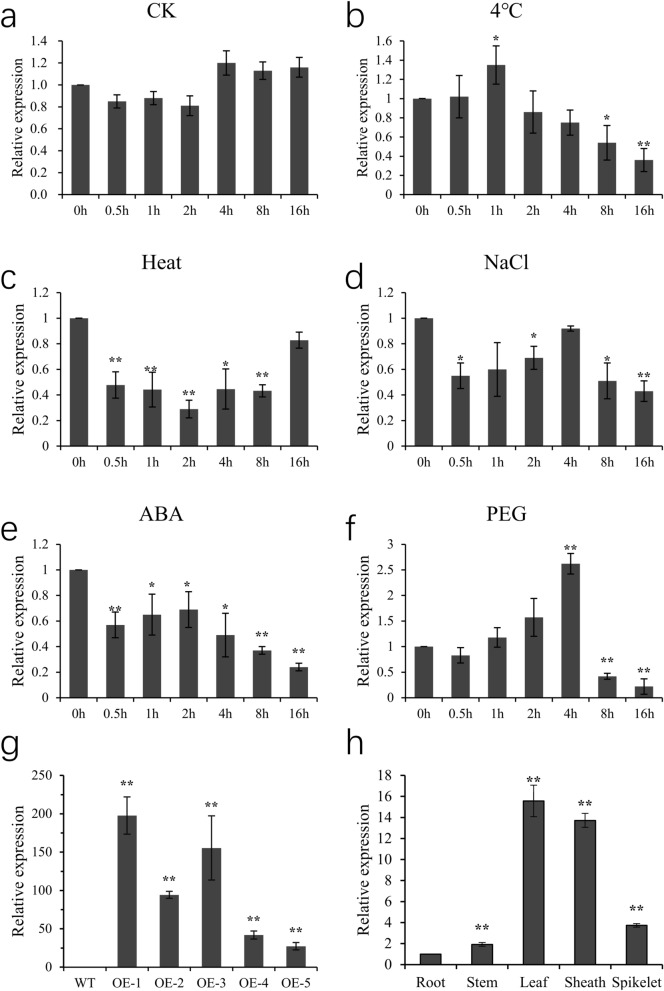
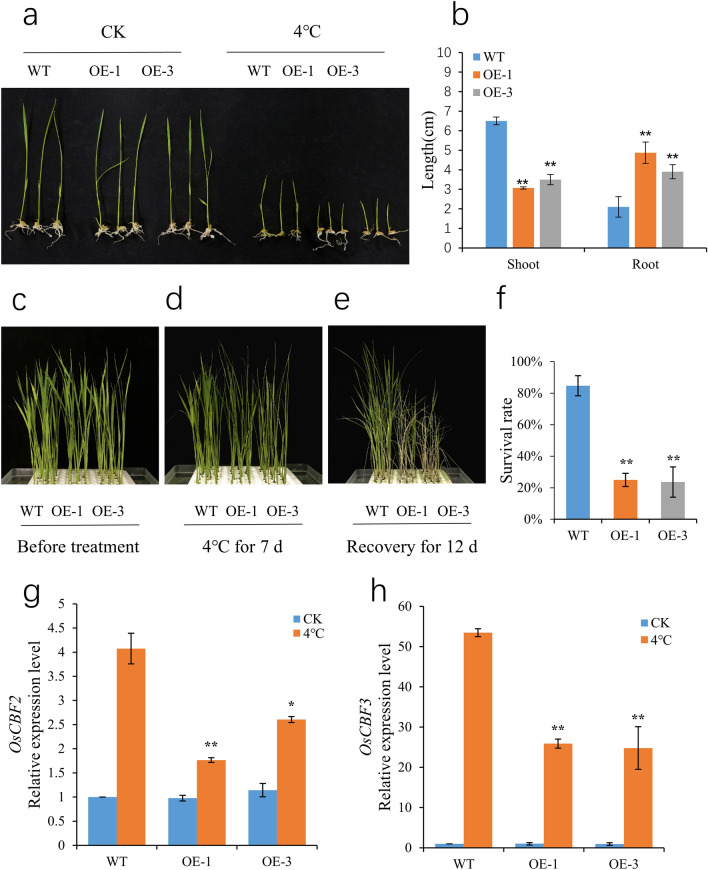
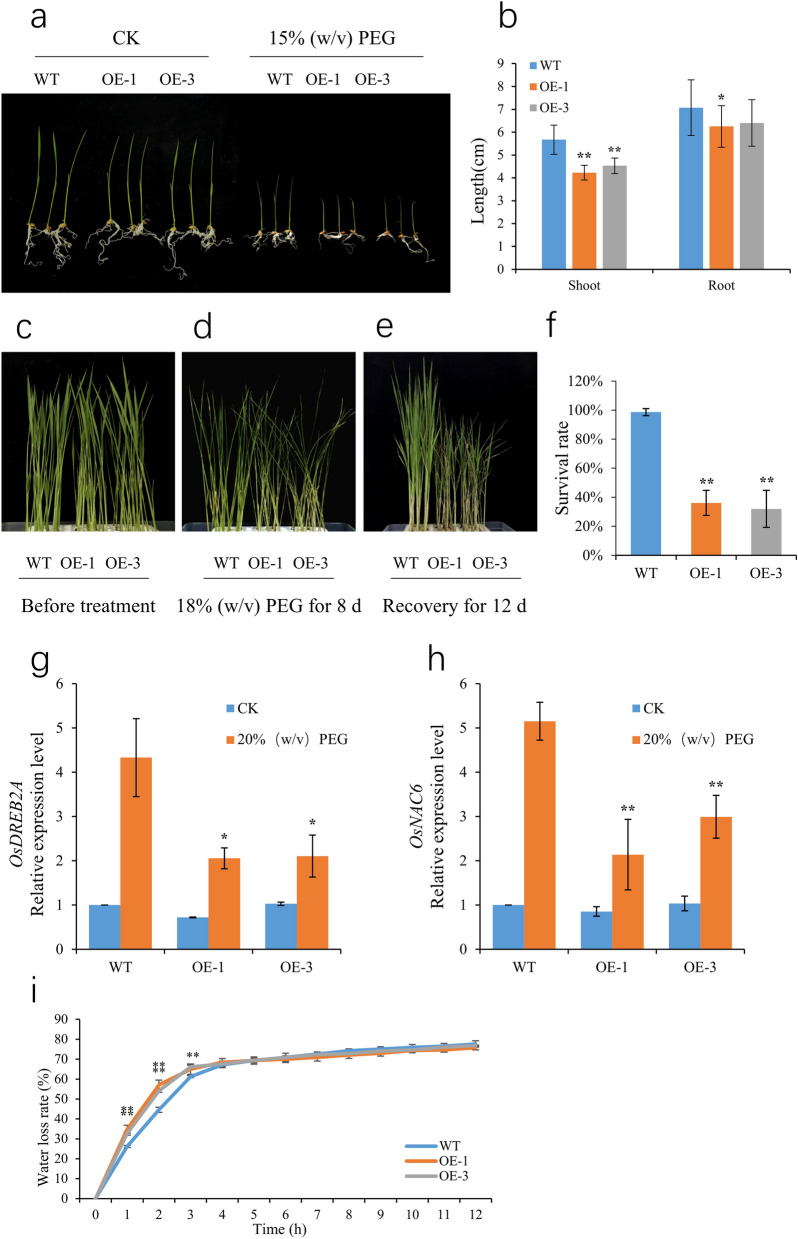
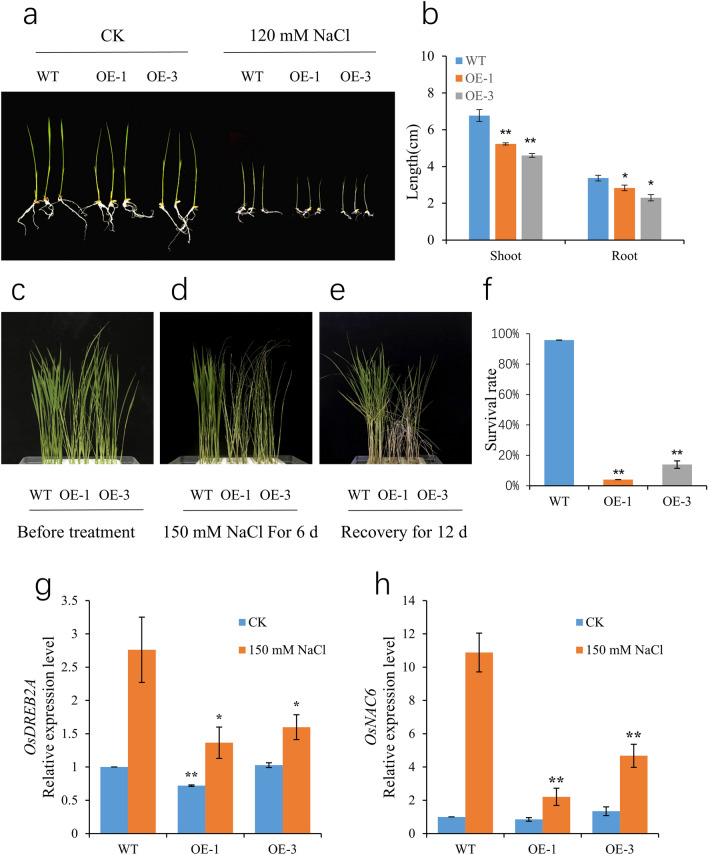
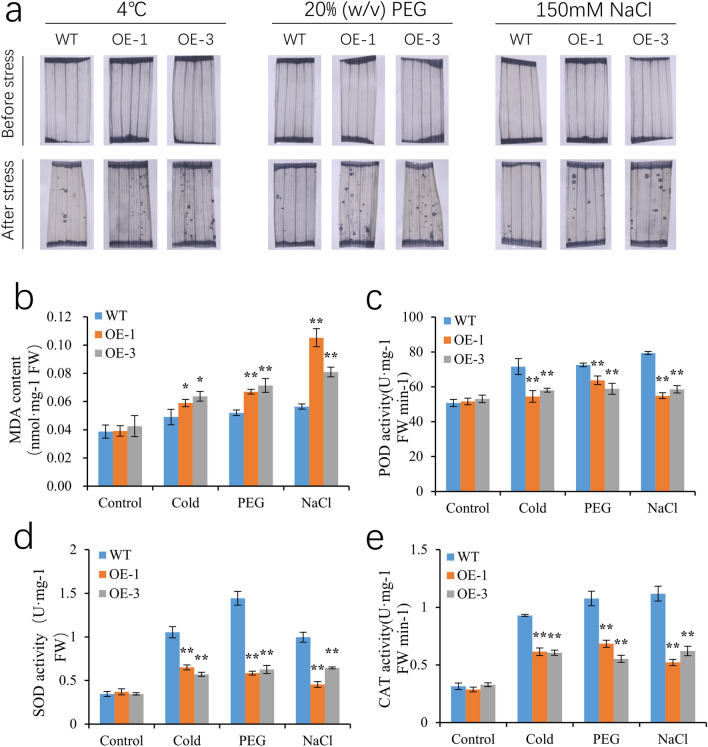
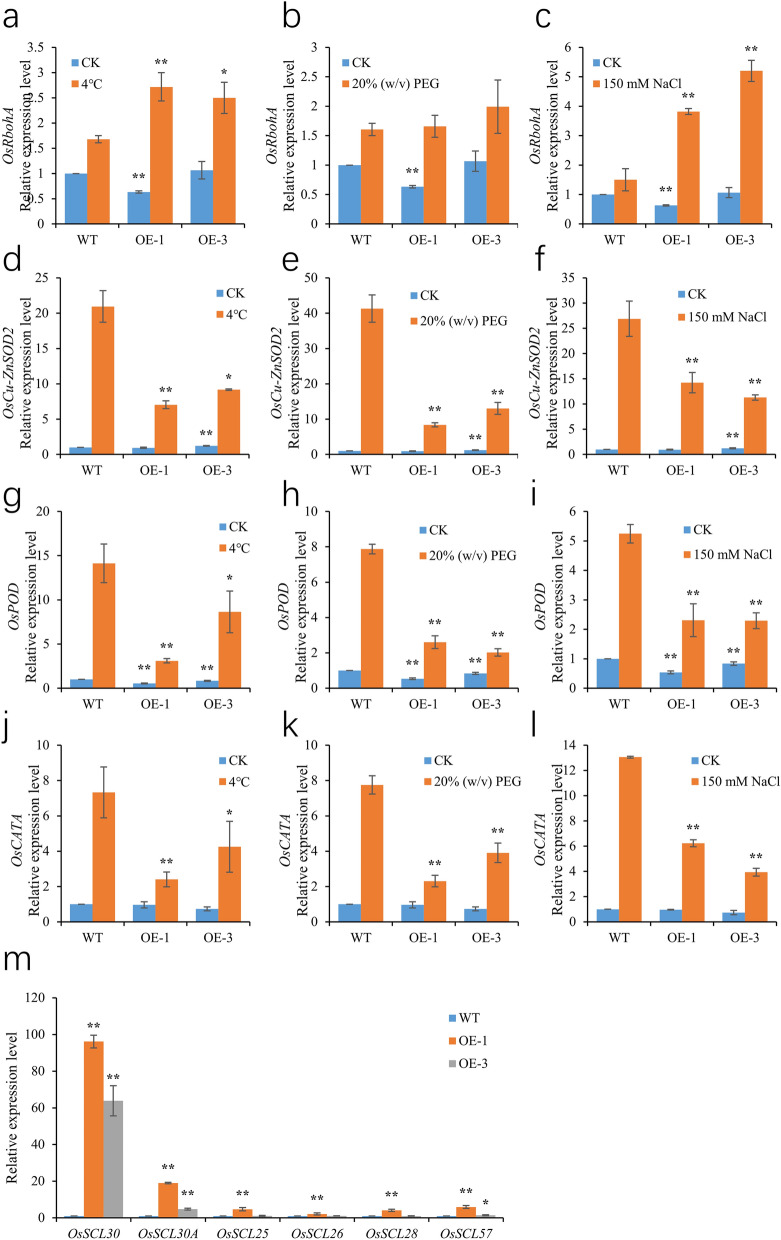
Rice is one of the main food crops for the world population. Various abiotic stresses, such as low temperature, drought, and high salinity, affect rice during the entire growth period, determining its yield and quality, and even leading to plant death. In this study, by constructing overexpression vectors D-163 + 1300:OsSCL30 and D-163 + 1300-AcGFP:OsSCL30-GFP, the mechanism of action of OsSCL30 in various abiotic stresses was explored. Bioinformatics analysis showed that OsSCL30 was located on the chromosome 12 of rice Nipponbare, belonging to the plant-specific SCL subfamily of the SR protein family. The 1500 bp section upstream of the open reading frame start site contains stress-related cis-acting elements such as ABRE, MYC, and MYB. Under normal conditions, the expression of OsSCL30 was higher in leaves and leaf sheaths. The results of reverse transcription polymerase chain reaction showed that the expression of OsSCL30 decreased after low temperature, drought and salt treatment. In root cells OsSCL30 was localized in the nuclei. The results of the rice seedling tolerance and recovery tests showed that overexpression of OsSCL30 diminished the resistance to low temperature, drought and salt stresses in transgenic rice and resulted in larger accumulation of reactive oxygen species. This study is of great significance for exploring the response mechanisms of SR proteins under abiotic stresses.


Conflict of interest statement

The authors declare no competing interests.

Figures

Figure 1
Figure 1
(a) Cluster analysis of OsSCL30 homologous genes in plants. (b) Analysis of elements associated with the OsSCL30 promoter region. (c) Subcellular localization of OsSCL30-GFP.
Figure 2
Figure 2
(af) OsSCL30 gene expression pattern under various environmental stresses and ABA treatment. (a. ck; b. 4 °C; c. 42 °C; d. 150 mM NaCl; e. 50 μM ABA; f. 15% w/v PEG) (g) OsSCL30 transgenic lines expression detection. (h) Tissue expression of OsSCL30. Error bars represent ± SE (n = 3). Asterisks indicate significant differences (*P < 0.05, **P < 0.01).
Figure 3
Figure 3
Effects of cold stress in wild type (WT) and OE lines. (a) Phenotypes of WT and OE lines under 4 °C for 3 days. (b) Plant height and root length of WT and OE lines treated at 4 °C for 3 days. (c) Phenotype of WT and OE lines hydroponically cultivated for 14 days (before imposition of the cold stress). (d) Phenotypes of WT and OE lines treated for 7 days at 4 °C. (e) Phenotypes of WT and OE lines after 12 days recovery following the 4 °C treatment. (f) Survival of recovered WT and OE lines. (gh) The expression levels of OsCBF2 and OsCBF3 were analyzed after two days of treatment at 4 °C, respectively. Error bars represent ± SE (n = 3). Asterisks indicate significant differences between transgenic lines and WT (*P < 0.05, **P < 0.01).
Figure 4
Figure 4
Effects of drought stress in wild type (WT) and OE lines. (a) Phenotypes of WT and OE lines under 15% w/v PEG for 3 days. (b) Plant height and root length of WT and OE lines treated at 15% w/v PEG for 3 days. (c) Phenotype of WT and OE lines hydroponically cultivated for 14 days (before imposition of the drought stress). (d) Phenotypes of WT and OE lines treated for 8 days at 18% w/v PEG. (e) Phenotypes of WT and OE lines after 12-day recovery following the 18% w/v PEG treatment. (f) Survival of recovered WT and OE lines. (gh) The expression levels of OsDREB2A and OsNAC6 were analyzed after two days of treatment at 20% w/v PEG, respectively. (i) Water loss rates of detached leaves from 14-day-old plants. Error bars represent ± SE (n = 3). Asterisks indicate significant differences between transgenic lines and WT (*P < 0.05, **P < 0.01).
Figure 5
Figure 5
Effects of salt stress in wild type (WT) and OE lines. (a) Phenotypes of WT and OE lines under 120 mM NaCl for 3 days. (b) Plant height and root length of WT and OE lines treated at 120 mM NaCl for 3 days. (c) Phenotype of WT and OE lines hydroponically cultivated for 14 days (before imposition of the salt stress). (d) Phenotypes of WT and OE lines treated for 6 days at 150 mM NaCl. (e) Phenotypes of WT and OE lines after 12 days recovery following the 150 mM NaCl treatment. (f) Survival of recovered WT and OE lines. (gh) The expression levels of OsDREB2A and OsNAC6 were analyzed after two days of treatment at 150 mM NaCl, respectively. Error bars represent ± SE (n = 3). Asterisks indicate significant differences between transgenic lines and WT (*P < 0.05, **P < 0.01).
Figure 6
Figure 6
(a) Nitroblue tetrazolium (NBT) staining was used to detect the levels of superoxide anion in wild type (WT) and OE lines before and after low temperature (4 °C for 2 days), drought (20% w/v PEG for 2 days), and salt (150 mM NaCl for 2 days) treatments. (be) Detection of reactive oxygen species scavenging enzyme activities in wild type (WT) and OE lines before and after low temperature (4 °C for 2 days), drought (20% w/v PEG for 2 days) and salt (150 mM NaCl for 2 days). Error bars represent ± SE (n = 3). Asterisks indicate significant differences between transgenic lines and WT (*P < 0.05, **P < 0.01).
Figure 7
Figure 7
(a-l) Expression of ROS production and clearance related genes in WT and OsSCL30-OE plants. (ac) Expression of OsRbohA in WT and OsSCL30-OE plants are treated with or without 4 °C, 20% w/v PEG and 150 mM NaCl for 2 days. (df) Expression of OsCu-ZnSOD2 in WT and OsSCL30-OE plants are treated with or without 4 °C, 20% w/v PEG and 150 mM NaCl for 2 days. (gi) Expression of OsPOD in WT and OsSCL30-OE plants are treated with or without 4 °C, 20% w/v PEG and 150 mM NaCl for 2 days. (jl) Expression of OsCATA in WT and OsSCL30-OE plants are treated with or without 4 °C, 20% w/v PEG and 150 mM NaCl for 2 days. (m) Expression of SCL subfamily related genes in WT and OsSCL30-OE plants. Error bars represent ± SE (n = 3). Asterisks indicate significant differences between transgenic lines and WT (*P < 0.05, **P < 0.01).
Figure 8
Figure 8
Seed phenotypes of WT and OsSCL30-OE of rice. (a) Grain length. (b) Grain width. (c) Glume color. (d) Endosperm color.

Similar articles

Cited by

References

    1. Gross BL, Zhao Z. Archaeological and genetic insights into the origins of domesticated rice. Proc. Natl. Acad. Sci. U.S.A. 2014;111:6190–6197. doi: 10.1073/pnas.1308942110. - DOI - PMC - PubMed
    1. Lyman NB, Jagadish KS, Nalley LL, Dixon BL, Siebenmorgen T. Neglecting rice milling yield and quality underestimates economic losses from high-temperature stress. PLoS ONE. 2013;8:e72157. doi: 10.1371/journal.pone.0072157. - DOI - PMC - PubMed
    1. Krasensky J, Jonak C. Drought, salt, and temperature stress-induced metabolic rearrangements and regulatory networks. J. Exp. Bot. 2012;63:1593–1608. doi: 10.1093/jxb/err460. - DOI - PMC - PubMed
    1. Almadanim MC, et al. Rice calcium-dependent protein kinase OsCPK17 targets plasma membrane intrinsic protein and sucrose-phosphate synthase and is required for a proper cold stress response. Plant, Cell Environ. 2017;40:1197–1213. doi: 10.1111/pce.12916. - DOI - PubMed
    1. Cramer GR, Urano K, Delrot S, Pezzotti M, Shinozaki K. Effects of abiotic stress on plants: a systems biology perspective. BMC Plant Biol. 2011;11:163. doi: 10.1186/1471-2229-11-163. - DOI - PMC - PubMed

Publication types