. 2022 May 19;5(1):448.
doi: 10.1038/s42003-022-03374-0.

Searching the web builds fuller picture of arachnid trade

Affiliations

Searching the web builds fuller picture of arachnid trade

Benjamin M Marshall et al. Commun Biol. .

Abstract

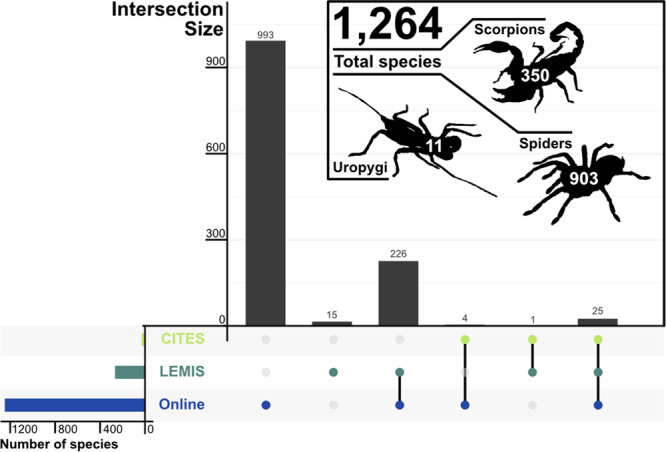
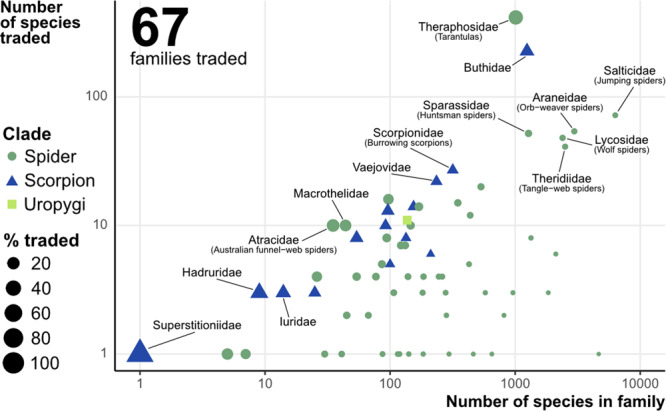
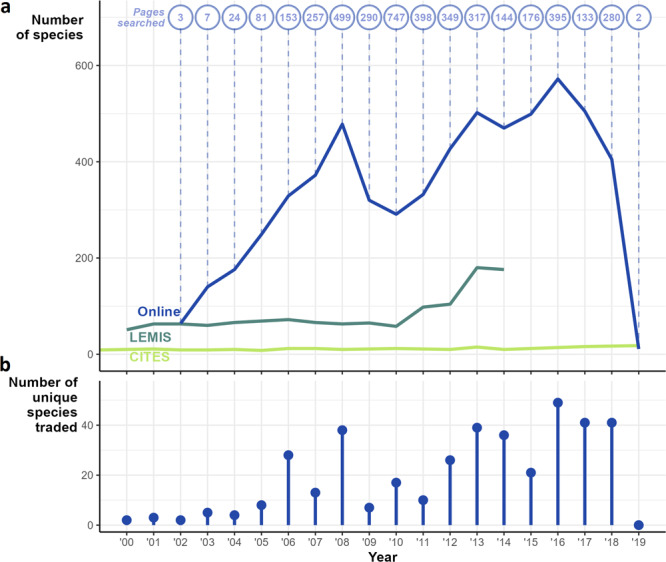
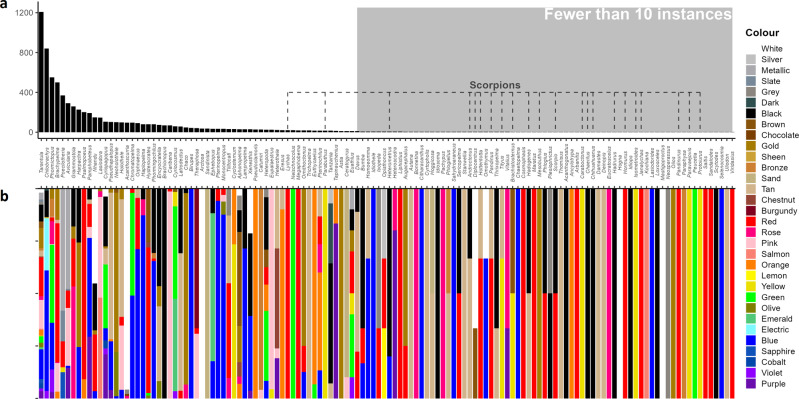
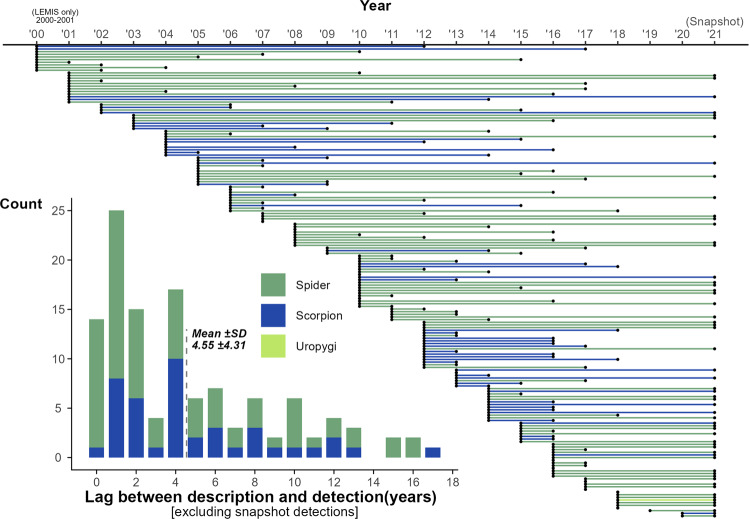
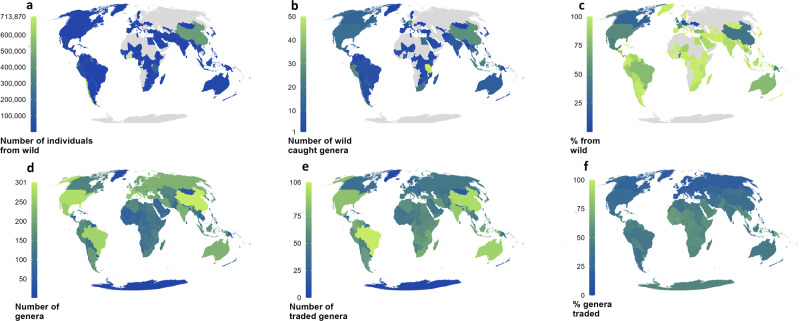
Wildlife trade is a major driver of biodiversity loss, yet whilst the impacts of trade in some species are relatively well-known, some taxa, such as many invertebrates are often overlooked. Here we explore global patterns of trade in the arachnids, and detected 1,264 species from 66 families and 371 genera in trade. Trade in these groups exceeds millions of individuals, with 67% coming directly from the wild, and up to 99% of individuals in some genera. For popular taxa, such as tarantulas up to 50% are in trade, including 25% of species described since 2000. CITES only covers 30 (2%) of the species potentially traded. We mapped the percentage and number of species native to each country in trade. To enable sustainable trade, better data on species distributions and better conservation status assessments are needed. The disparity between trade data sources highlights the need to expand monitoring if impacts on wild populations are to be accurately gauged and the impacts of trade minimised.


Conflict of interest statement

The authors declare no competing interests.

Figures

Fig. 1
Fig. 1. UpSet plot showing how the three different sources overlapped.
UpSet plot of how the three different sources overlapped in terms of species, with an insert showing how the total number of species was split between three major clades. Lower left hand bar chart shows the number of species detected via each source.
Fig. 2
Fig. 2. Number of species plotted against the number of species traded.
Each point represents one family, with some of the larger families named. Highlighted with text are some of the highest percentage traded families, with common names if applicable. n.b. log scales both x and y.
Fig. 3
Fig. 3. Numbers of species listed per year from the three data sources.
a The raw number of species in each of the data sources, supplemented with a count of the archived pages searched to describe the varying online sampling effort. b The number of species unique to that particular year, from any source.
Fig. 4
Fig. 4. Count and colours linked to mentions of arachnid genera.
a Raw counts of the number of times a genus keyword appeared alongside a mention of colour (based on actual colour listings). Most genera mentioned are spiders, and scorpions are highlighted with grey dashed lines. b The proportion of genera keyword detections linked to a particular colour, with legend detailing the colour word detected.
Fig. 5
Fig. 5. Years of detection in the trade of species described post-1999 (via LEMIS or online).
Inserted histogram shows the count of the year lags for those species detection could be connected to an exact year (i.e., not detected in the 2021 snapshot sampling).
Fig. 6
Fig. 6. The source of traded spiders and scorpions harvested from the wild.
ac show the source based on the origin listed in the LEMIS database. df show the natural distributions of all traded spiders and scorpions based on all data sources, number of species traded are shown in supplements. N.B., The natural distributions are only accurate to the country level, and in some cases represent extrapolation from broadly defined distributions (e.g., a “South American” distribution would be mapped as including all countries in South America).

References

    1. Morton O, Scheffers BR, Haugaasen T, Edwards DP. Impacts of wildlife trade on terrestrial biodiversity. Nat. Ecol. Evolution. 2021;5:540–548. doi: 10.1038/s41559-021-01399-y. - DOI - PubMed
    1. IPBES. Summary for policymakers of the global assessment report on biodiversity and ecosystem services of the Intergovernmental Science-Policy Platform on Biodiversity and Ecosystem Services (IPBES Secretariat, 2019).
    1. Marshall BM, Strine C, Hughes AC. Thousands of reptile species threatened by under-regulated global trade. Nat. Commun. 2020;11:1–12. doi: 10.1038/s41467-020-18523-4. - DOI - PMC - PubMed
    1. Hughes AC, Marshall BM, Strine C. Gaps in global wildlife trade monitoring leave amphibians vulnerable. eLife. 2021;10:e70086. doi: 10.7554/eLife.70086. - DOI - PMC - PubMed
    1. Muafor FJ, Levang P, Angwafo TE, Gall PL. Making a living with forest insects: beetles as an income source in Southwest Cameroon. Int. Forestry Rev. 2012;14:314–325. doi: 10.1505/146554812802646693. - DOI