. 2022 Jul;36(7):1781-1793.
doi: 10.1038/s41375-022-01594-1. Epub 2022 May 19.

PU.1 and MYC transcriptional network defines synergistic drug responses to KIT and LSD1 inhibition in acute myeloid leukemia

Affiliations

PU.1 and MYC transcriptional network defines synergistic drug responses to KIT and LSD1 inhibition in acute myeloid leukemia

Brittany M Curtiss et al. Leukemia. 2022 Jul.

Abstract

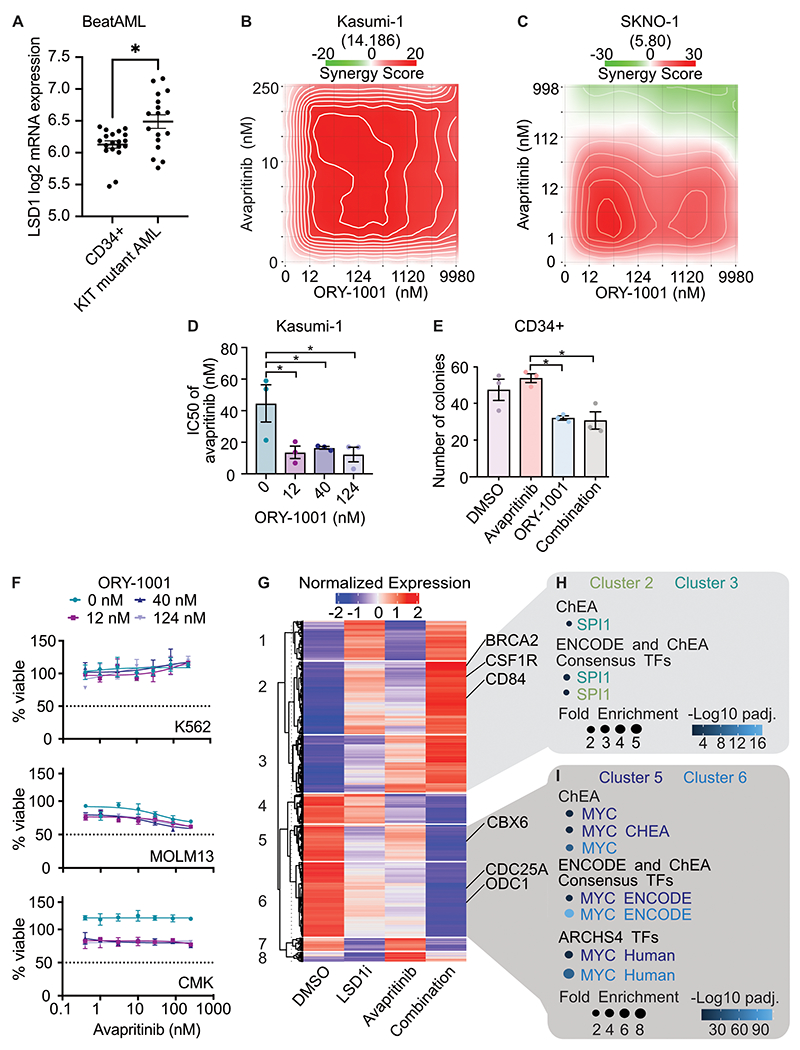
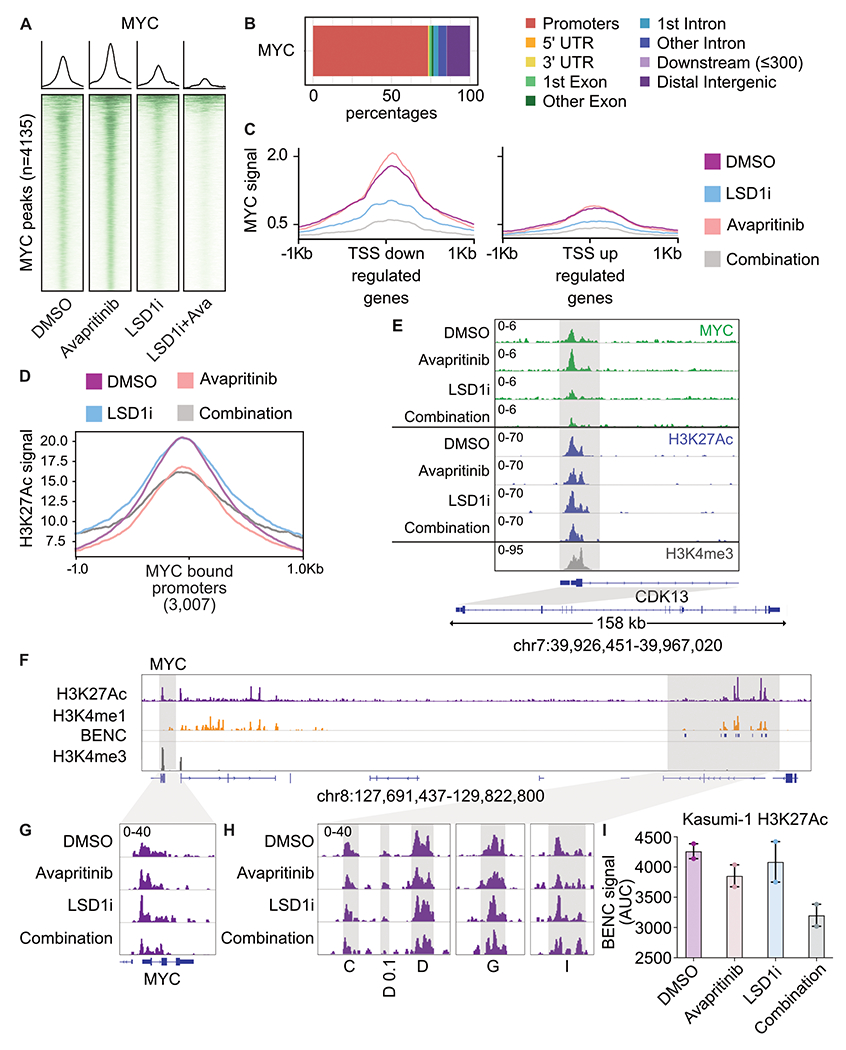
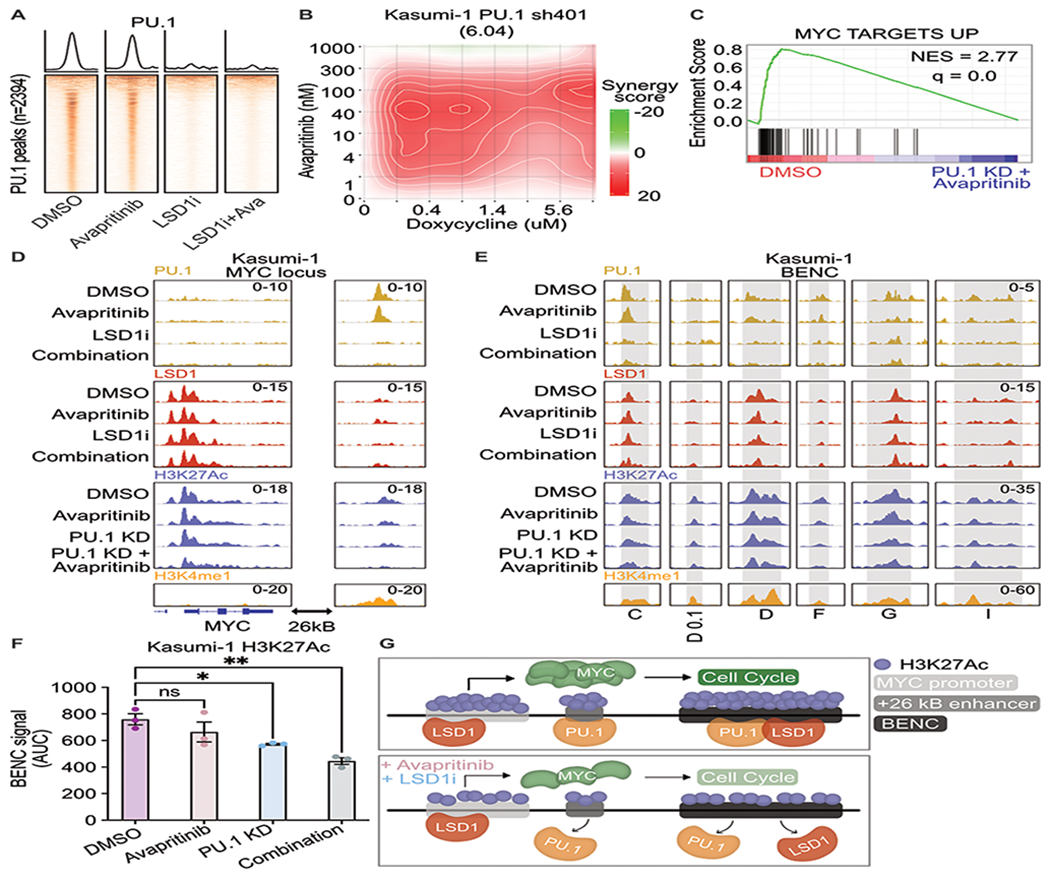
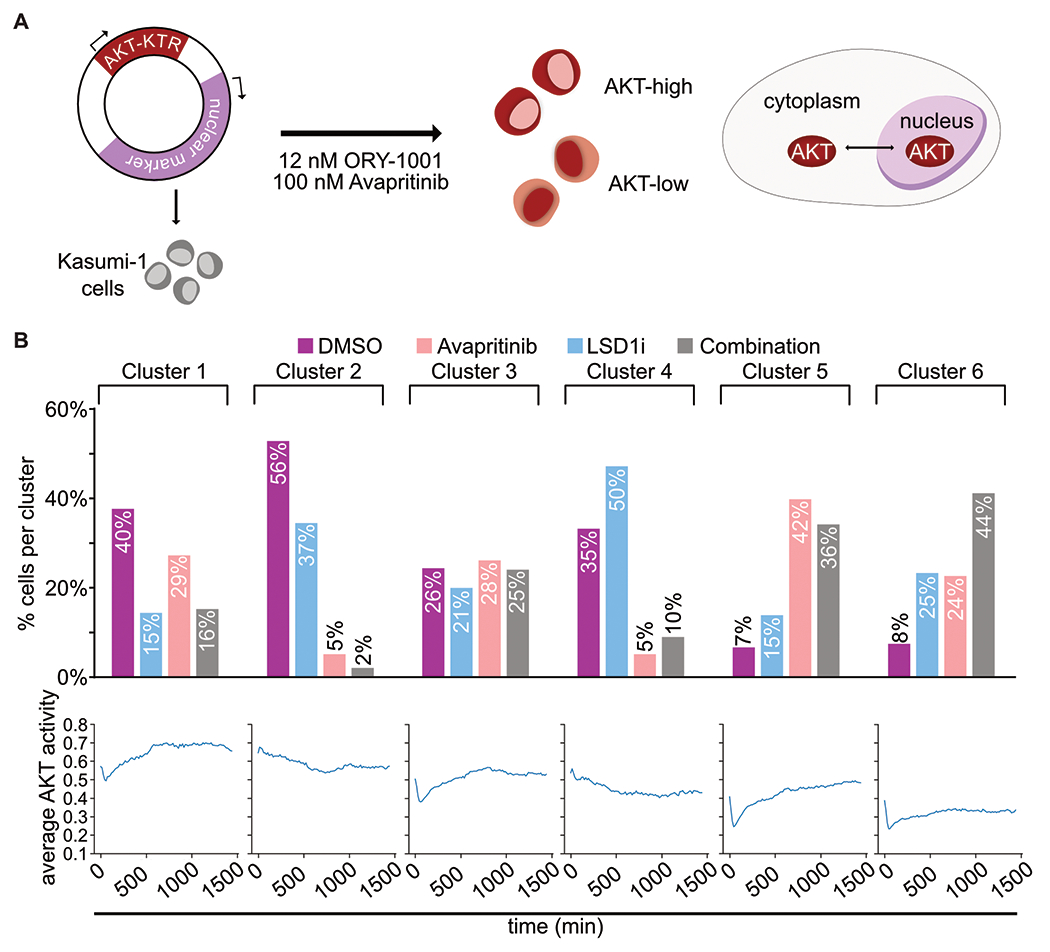
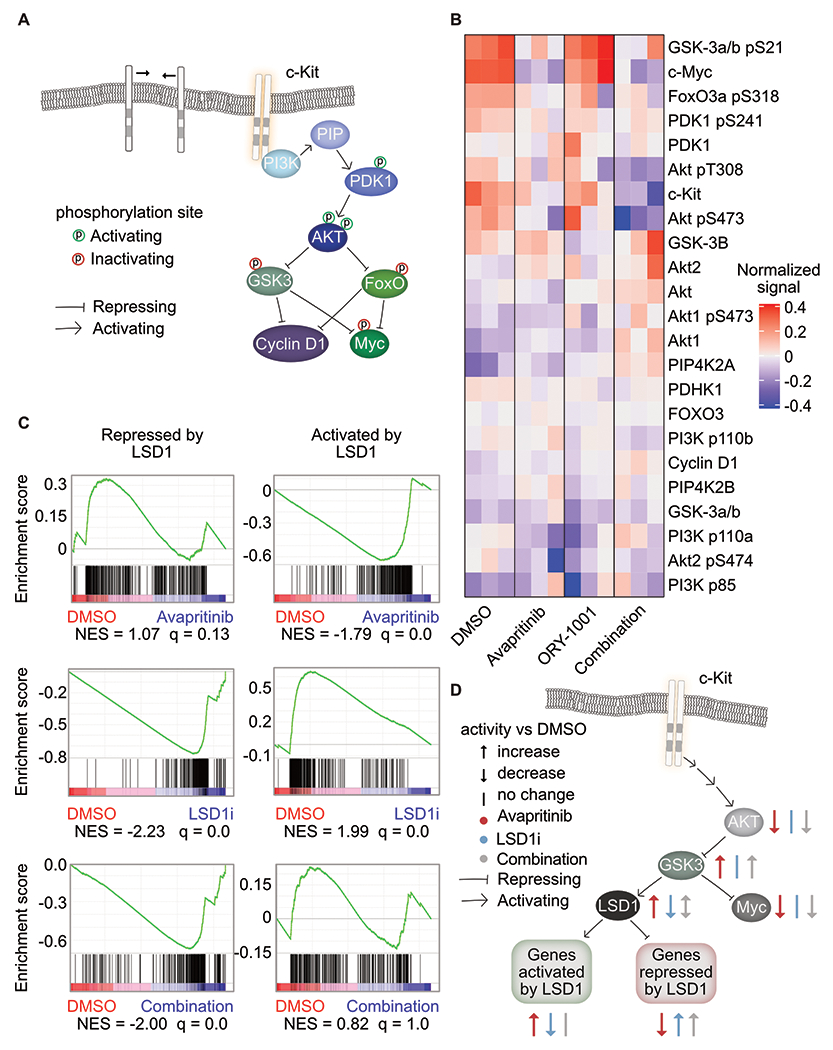
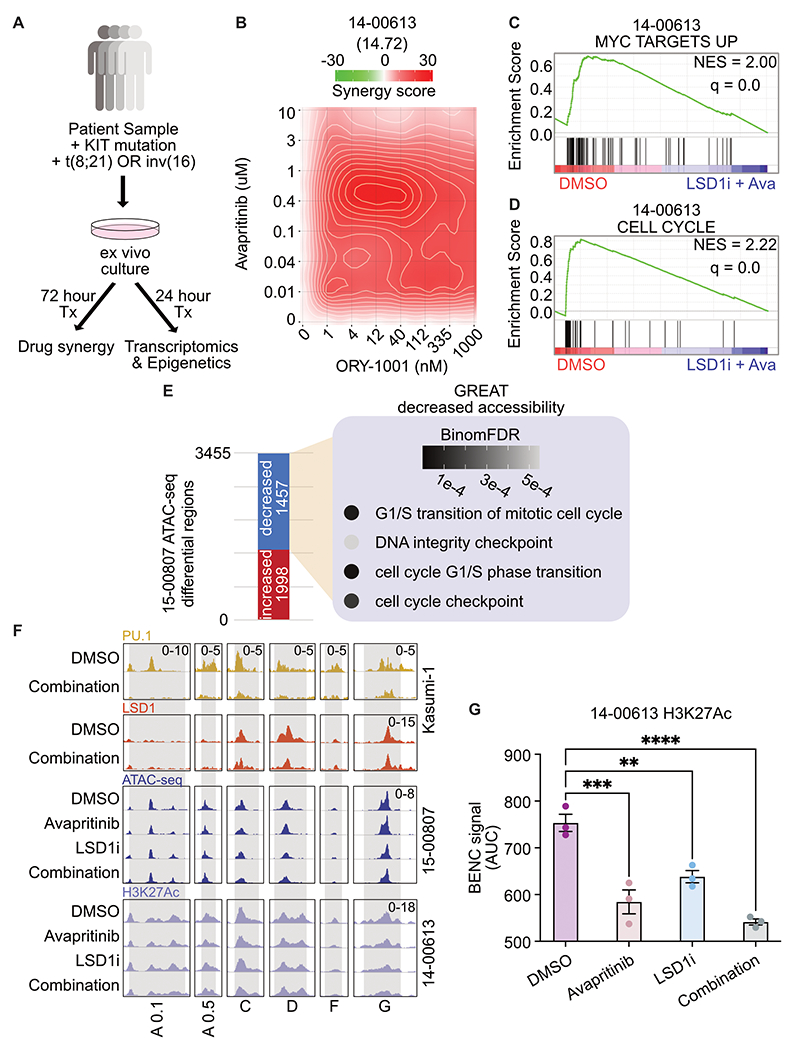
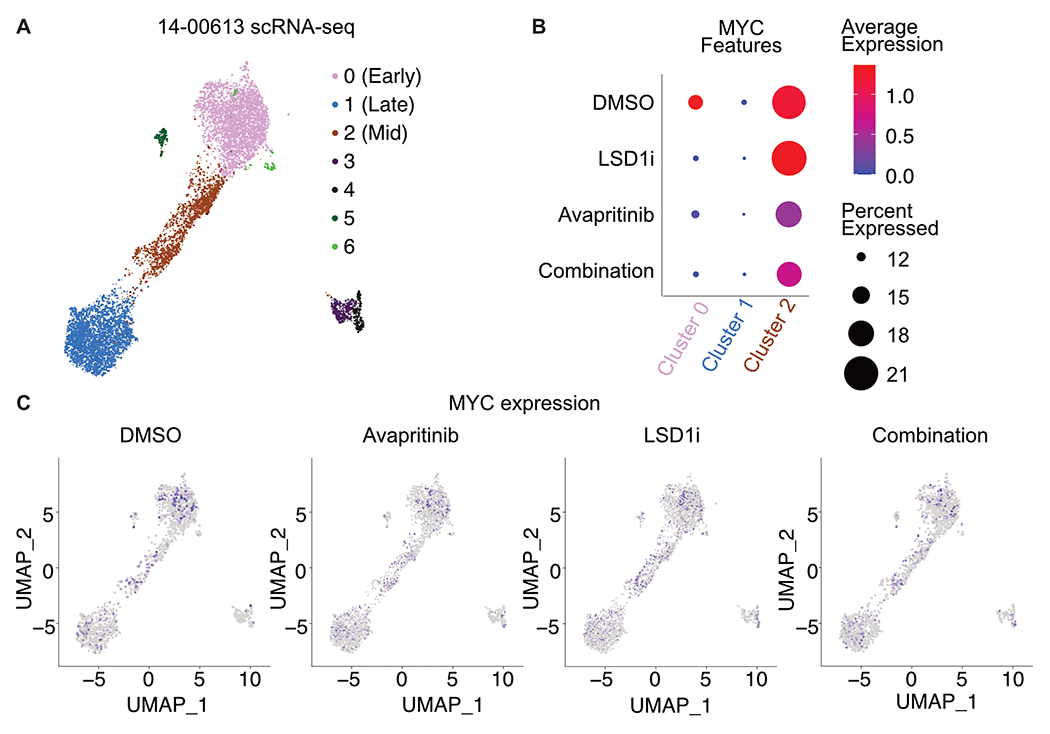
Responses to kinase-inhibitor therapy in AML are frequently short-lived due to the rapid development of resistance, limiting the clinical efficacy. Combination therapy may improve initial therapeutic responses by targeting pathways used by leukemia cells to escape monotherapy. Here we report that combined inhibition of KIT and lysine-specific demethylase 1 (LSD1) produces synergistic cell death in KIT-mutant AML cell lines and primary patient samples. This drug combination evicts both MYC and PU.1 from chromatin driving cell cycle exit. Using a live cell biosensor for AKT activity, we identify early adaptive changes in kinase signaling following KIT inhibition that are reversed with the addition of LSD1 inhibitor via modulation of the GSK3a/b axis. Multi-omic analyses, including scRNA-seq, ATAC-seq and CUT&Tag, confirm these mechanisms in primary KIT-mutant AML. Collectively, this work provides rational for a clinical trial to assess the efficacy of KIT and LSD1 inhibition in patients with KIT-mutant AML.


Figures

Figure 1.
Figure 1.. Synergistic cytotoxicity of dual KIT and LSD1 inhibition in a KIT-mutant AML cell line through activation of PU.1 and repression of MYC target genes
A. LSD1 mRNA expression in KIT-mutant samples from the BeatAML cohort compared with CD34+ normal controls; Mann-Whitney test (n=19 CD34+ samples and 17 KIT-mutant AML samples), Error bars representing SEM, * p < 0.05. B. Drug matrix of Kasumi-1 cells treated for 72 h with avapritinib and ORY-1001 with synergy assessed by zero interaction potency (ZIP) score(44). ZIP score displayed in parentheses. C. Drug matrix of SKNO-1 cells treated for 72 h with avapritinib and ORY-1001 with synergy assessed by ZIP score. ZIP score displayed in parentheses. D. IC50 of avapritinib with different concentrations of ORY-1001 in Kasumi-1 cells treated for 72 h; one-way ANOVA with Holm-Sidak correction (n=3/group). Error bars representing SEM, *p < 0.05. E. Colony assay using healthy CD34+ cells in, treated for 14 days with avapritinib (12 nM) and/or ORY-1001 (12 nM); two-way ANOVA with Holm-Sidak correction (n=3/group). Error bars representing SEM, *p < 0.05. F. Viability assessment of K562, MOLM13, and CMK cells treated for 72 h with avapritinib and ORY-1001 (n=3/group). Error bars representing SEM. G. Heatmap of differentially expressed genes from RNA-seq performed on Kasumi-1 cells treated with avapritinib (12 nM) and/or GSK-LSD1 (12 nM) for 12 h (n=3/group). Genes with significant differential expression are displayed by K-means clustering. H, I. Gene ontology analysis of clusters 2/3 and 5/6 from F, respectively.
Figure 2.
Figure 2.. Repression of MYC bound promoters of cell cycle related programs.
A. Kasumi-1 cells were treated for 24 h with avapritinib (12 nM) and/or GSK-LSD1 (12 nM; LSD1i) then subject to CUT&RUN (n=2/group). Heatmaps of global signal for MYC at high confidence consensus peaks (peak apex ± 1 kb). B. Annotation of consensus MYC peaks. C. MYC signal at TSSs of down or up regulated genes defined by RNA-seq. D. H3K27Ac signal at all MYC bound promoters in Kasumi-1 cells after 24 h of treatment with avapritinib (12 nM) and/or GSK-LSD1 (12 nM; LSD1i). E. Gene ontology term enrichment for MYC bound promoters. F. Histone mark visualization with Integrative Genomics Viewer (IGV) at the MYC and blood enhancer cluster (BENC) locus (n=2/group). BENC modules were identified with Kasumi-1 H3K4me1 signal that overlaps with the previously published modules(24). G. Histone acetylation in Kasumi-1 cells at the MYC locus. H. Histone acetylation at active BENC modules. Active BENC modules were defined by presence of H3K27Ac signal. Modules without acetylation were excluded. I. AUC of acetylation signal at active BENC modules.
Figure 3.
Figure 3.. Loss of PU.1 binding at MYC enhancer resulting in loss of MYC enhancer and promoter activation.
A. Kasumi cells treated for 24 h with avapritinib (12 nM) and/or GSK-LSD1 (12 nM; LSD1i) then subject to CUT&RUN for PU.1 (n=2/group). Heatmaps of global signal for PU.1 at high confidence consensus PU.1 peaks (peak apex ± 1 kb). B. Drug matrix of avapritinib and doxycycline on Kasumi-1 PU.1 sh401 cells treated for 72 h. Synergy assessed by ZIP scores. ZIP score reported in parentheses. C. Depleted gene sets from bulk RNA-seq on PU.1 sh401, induced with doxycycline (1 μg/mL) 48 h before treatment with avapritinib (50 nM) for 24 h. NES = normalized enrichment score (q < 0.05). GSEA p value calculated by empirical permutation test and FDR adjusted. D, E. Kasumi-1 cells treated for 24 h with avapritinib (50 nM) and/or doxycycline (1 μg/mL) to induce PU.1 knockdown were used to perform CUT&Tag for H3K27Ac (n=3/group). H3K4me1, PU.1, and LSD1 signal from above datasets in Kasumi-1 cells. Visualization of +26 Kb MYC and active modules of the blood super-enhancer cluster (BENC). BENC modules are defined Kasumi-1 H3K4me1 signal that intersects with the previously published coordinates for the BENC(24). The presence of H3K27Ac signal was used to define active modules. F. Quantification of cumulative AUC of H3K27Ac signal at active BENC modules; one-way ANOVA with Holms-Sidak correction. Error bars representing SEM. * p < 0.05, **p < 0.01 G. Model describing loss of PU.1 binding after dual LSD1 and KIT inhibition at MYC +26 kB enhancer and BENC. PU.1 no longer activates MYC promoter resulting in decreased MYC protein, leading to decreased expression of MYC target genes including those involved with cell proliferation.
Figure 4.
Figure 4.. KIT and LSD1 inhibition attenuate AKT signaling
A. Experimental strategy to continuously assess AKT activity over time with AKT-KTR-mScarlet fluorescent biosensor. ERK activity was evaluated in the same way with ERK-KTR-Clover. B. Kasumi-1 cells were treated with avapritinib (100 nM) and/or ORY-1001 (12 nM). Subcellular localization of the fluorescent biosensors was captured with live-cell imaging. Cells were clustered based on AKT activity over time, then separated based on treatment. Bar graph displays percentage of cells from each treatment group within each cluster. Line graph displays average AKT activity over time for each cluster.
Figure 5.
Figure 5.. Coordinated PI3K/AKT signaling response to dual KIT and LSD1 inhibition
A. Depiction of PI3K/AKT signaling pathway(–31). B. RPPA of Kasumi-1 cells treated for 1 h with avapritinib (100 nM) and/or ORY-1001 (12 nM). Heatmap of the normalized signal from PI3K/AKT pathway members (n=3/group). C. GSEA using gene sets curated by bulk RNA-seq of Kasumi-1 cells treated for 12 h with GSK-LSD1 (12 nM). Genes repressed by LSD1 have significantly increased expression after LSD1 inhibition. Genes activated by LSD1 have significantly decreased expression after LSD1 inhibition. NES = normalized enrichment score (q < 0.05). GSEA p value calculated by empirical permutation test and FDR adjusted. D. Inhibition of KIT or LSD1 lead to opposing effect on LSD1 activity via the PI3K/AKT pathway. Dual inhibition results in repression of MYC and activation of genes natively repressed by LSD1.
Figure 6.
Figure 6.. KIT and LSD1 inhibition synergistically target KIT-mutant AML patient samples resulting in decreased MYC and cell cycle programs
A. Experimental strategy for KIT-mutant patient samples. Frozen viable samples were cultured ex vivo and treated for 24 h before bulk RNA-seq and ATAC-seq. For synergy analysis, samples were drug treated for 72 h before assessing drug synergy. B. Drug matrix of patient sample 14-00613 treated for 72 h with avapritinib and ORY-1001 with synergy assessed by ZIP score. ZIP score reported in parentheses. C, D. Select depleted gene sets from bulk RNA-seq on 14-00613 treated with avapritinib (50 nM) and ORY-1001 (12 nM) or DMSO for 24 h. NES = normalized enrichment score (q < 0.05). GSEA p value calculated by empirical permutation test and FDR adjusted. E. Differential analysis of bulk ATAC-seq on 15-00807 treated with avapritinib (50 nM) and ORY-1001 (50 nM) compared to DMSO. Enrichment of GO terms for regions with significantly decreased accessibility. F. Visualization of Kasumi-1 PU.1 and LSD1 from above datasets, 15-00807 bulk ATAC-seq, and 14-00613 H3K27Ac at active BENC modules(24) (n=3/group). BENC modules defined by previously identified loci that overlap with H3K4me1 signal in Kasumi-1 cells. Active modules were designated based on presence of H3K27Ac signal. H3K27Ac CUT&Tag was performed on 14-00613 following 24 hr treatment with avapritinib (350 nM) and/or ORY-1001 (12 nM). G. Quantification of 14-00613 H3K27Ac signal at active BENC modules by comparing AUC; one-way ANOVA with Holm-Sidak correction. Error bars representing SEM. **p < 0.01, *** p < 0.001, ****p < 0.0001
Figure 7.
Figure 7.. Varied degree of MYC loss along the differentiation trajectory post LSD1 and KIT inhibition
A. Single cell RNA-seq on patient sample 14-00613 treated with ORY-1001 (12 nM) and/or avapritinib (12 nM) for 24 h. UMAP clustering of single cell gene expression. Clustering was performed on an integrated object that included cells treated with DMSO, avapritinib, ORY-1001, or the combination. B. Dot plot portraying the average gene expression and percentage of cells with MYC detected per UMAP cluster in A. C. MYC single cell gene expression in DMSO, ORY-1001 (LSD1i), avapritinib, and the combination from single cell analysis in A.

References

    1. Salamero O, Montesinos P, Willekens C, Pérez-Simón JA, Pigneux A, Récher C et al. First-in-Human Phase I Study of Iadademstat (ORY-1001): A First-in-Class Lysine-Specific Histone Demethylase 1A Inhibitor, in Relapsed or Refractory Acute Myeloid Leukemia. J Clin Oncol 2020; 38: 4260–4273. - PMC - PubMed
    1. Odenike O, Wolff JE, Borthakur G, Aldoss IT, Rizzieri D, Prebet T et al. Results from the first-in-human study of mivebresib (ABBV-075), a pan-inhibitor of bromodomain and extra terminal proteins, in patients with relapsed/refractory acute myeloid leukemia. J Clin Oncol 2019; 37: 7030–7030.
    1. Dombret H, Preudhomme C, Berthon C, Raffoux E, Thomas X, Vey N et al. A Phase 1 Study of the BET-Bromodomain Inhibitor OTX015 in Patients with Advanced Acute Leukemia. Blood 2014; 124: 117–117.
    1. Braun TP, Coblentz C, Smith BM, Coleman DJ, Schonrock Z, Carratt SA et al. Combined inhibition of JAK/STAT pathway and lysine-specific demethylase 1 as a therapeutic strategy in CSF3R/CEBPA mutant acute myeloid leukemia. Proc Natl Acad Sci 2020; 117: 13670–13679. - PMC - PubMed
    1. Bewersdorf JP, Shallis R, Stahl M, Zeidan AM. Epigenetic therapy combinations in acute myeloid leukemia: what are the options? Ther Adv Hematol 2019; 10: 2040620718816698. - PMC - PubMed

Publication types

Substances