. 2022 Jun;24(6):885-895.
doi: 10.1038/s41556-022-00912-0. Epub 2022 May 19.

Proton-gated anion transport governs macropinosome shrinkage

Affiliations

Proton-gated anion transport governs macropinosome shrinkage

Mariia Zeziulia et al. Nat Cell Biol. 2022 Jun.

Abstract

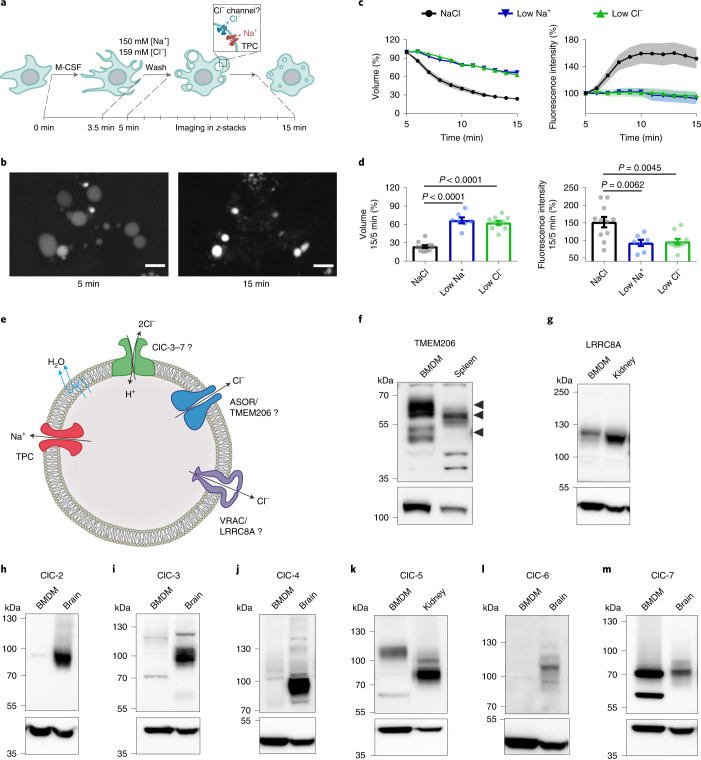
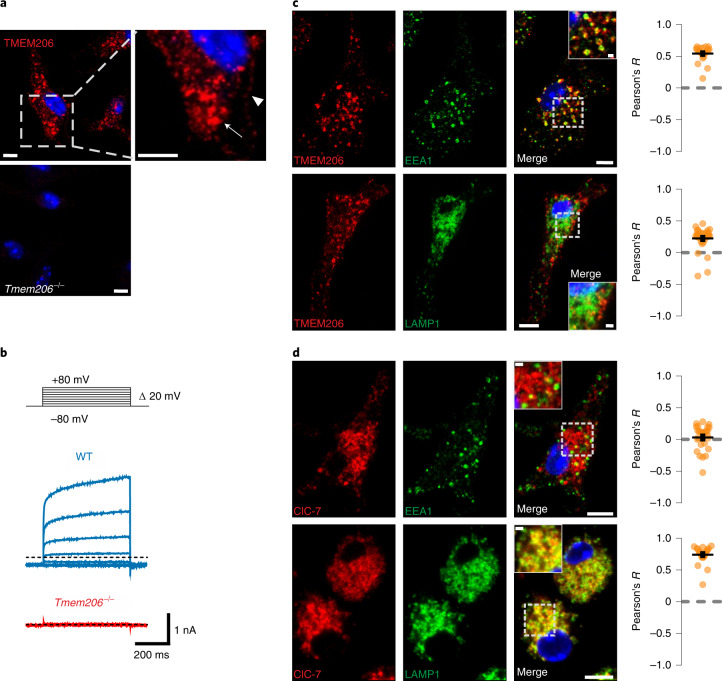
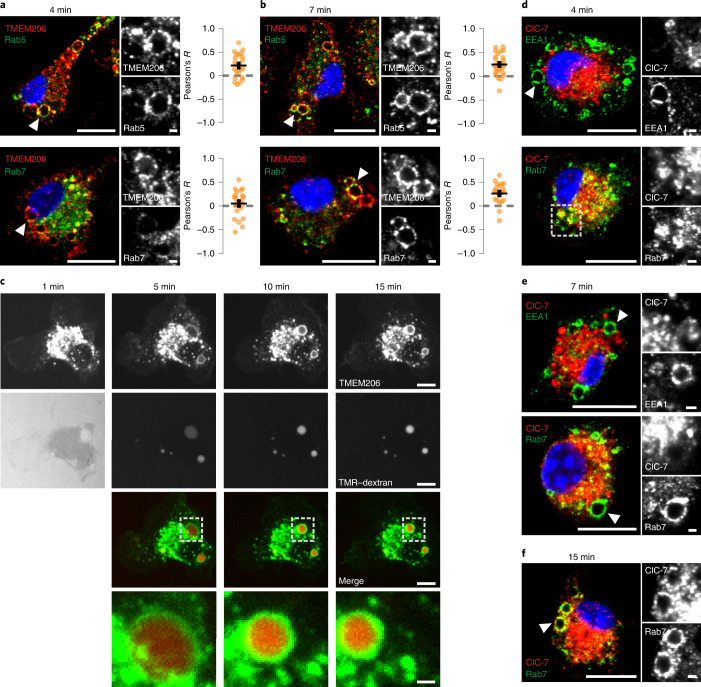
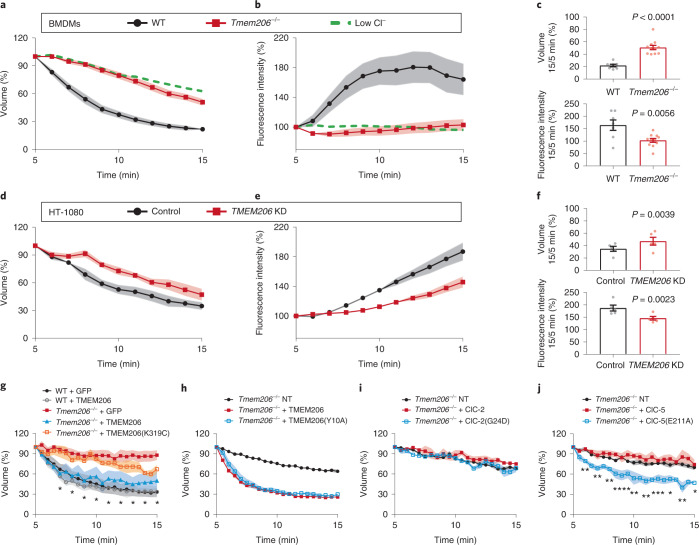
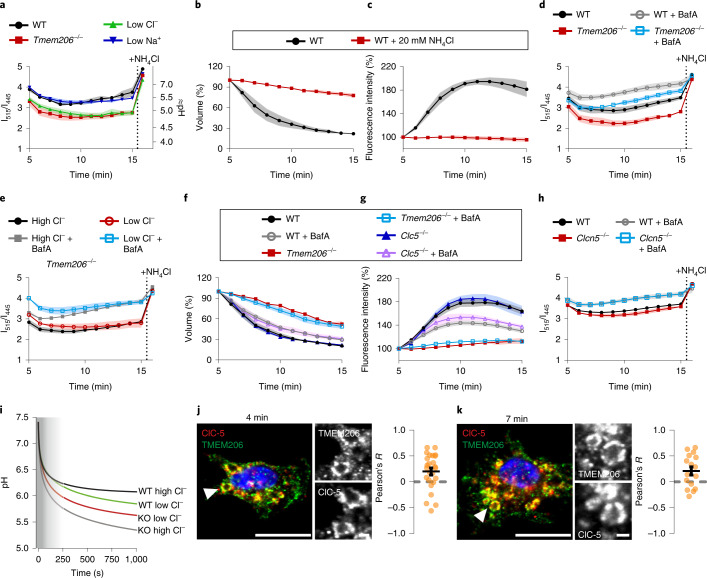
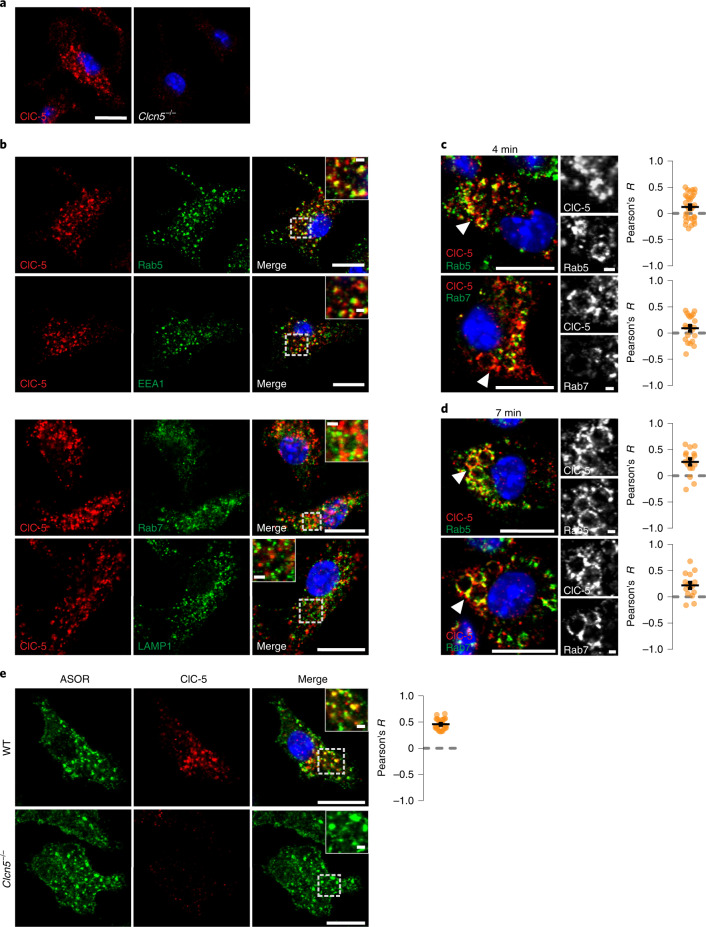
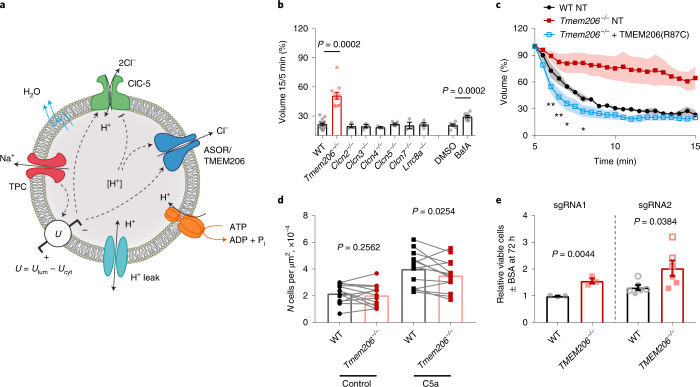
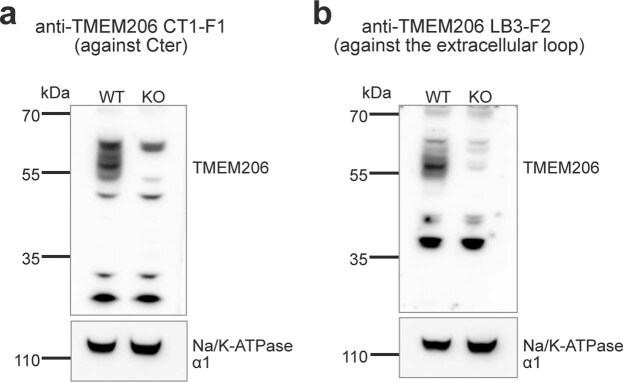
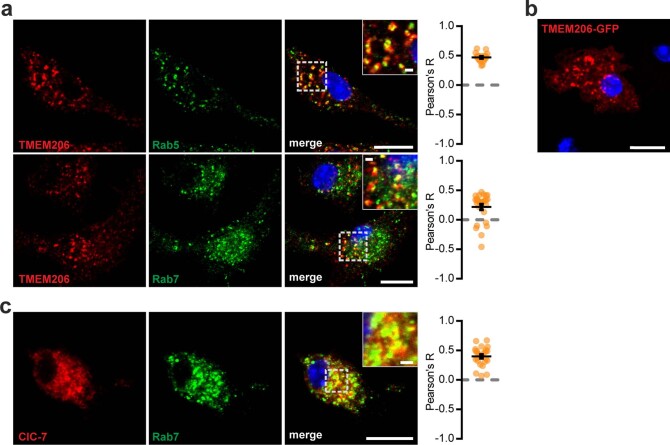
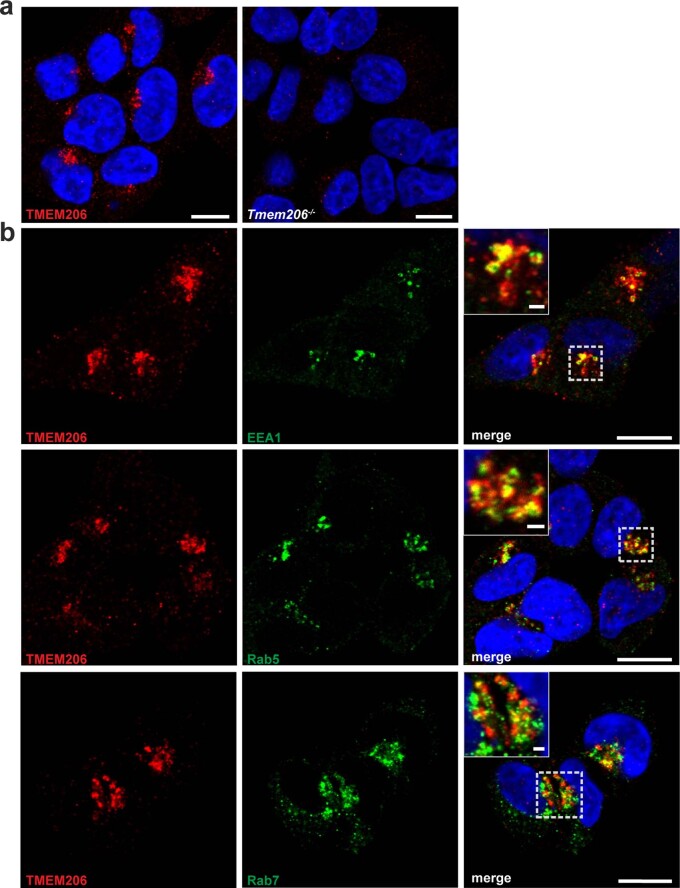
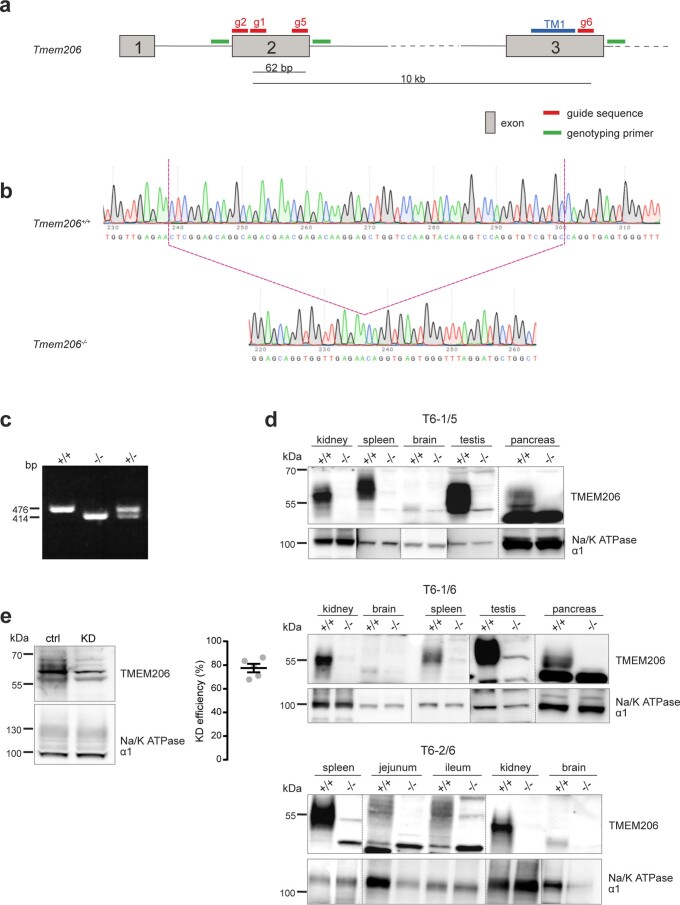
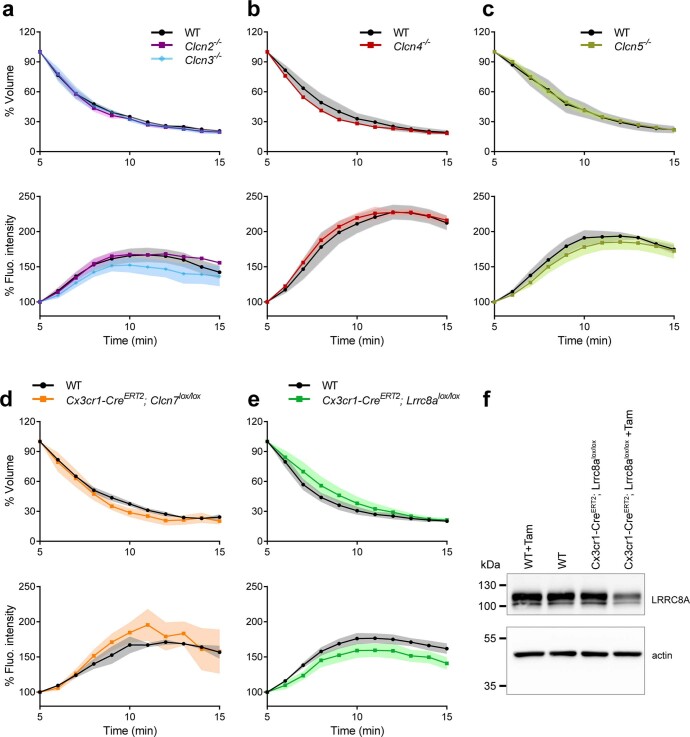
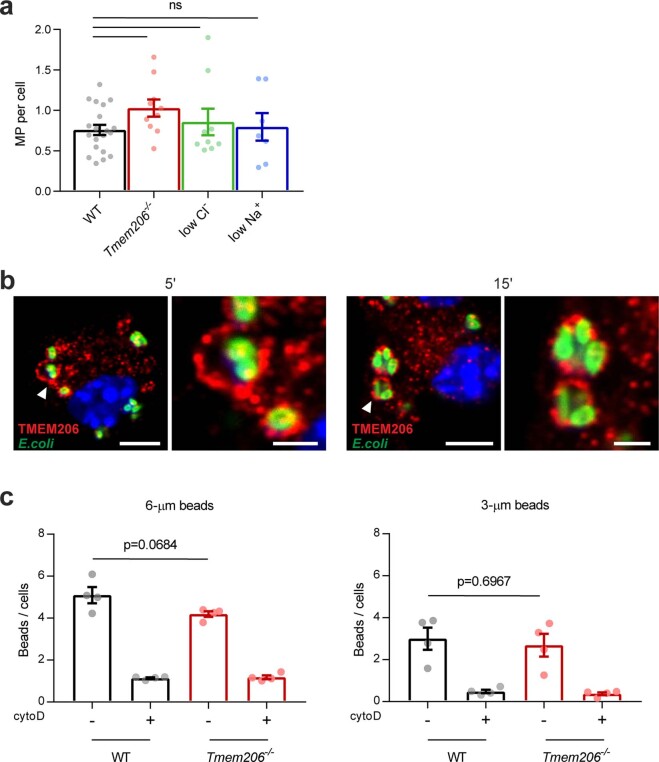
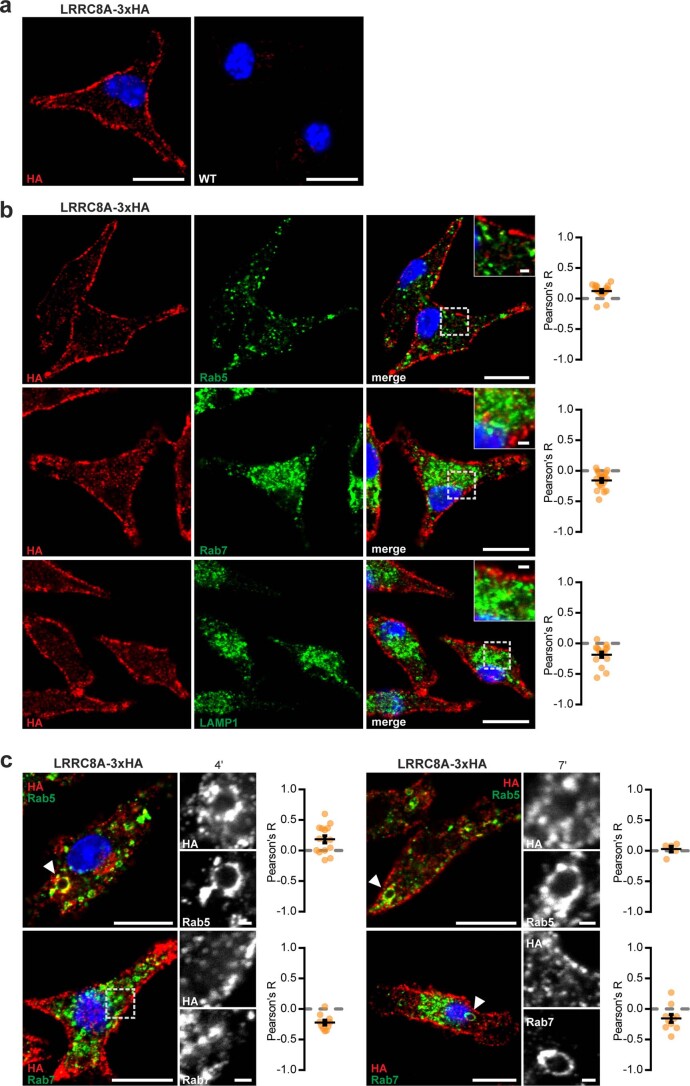
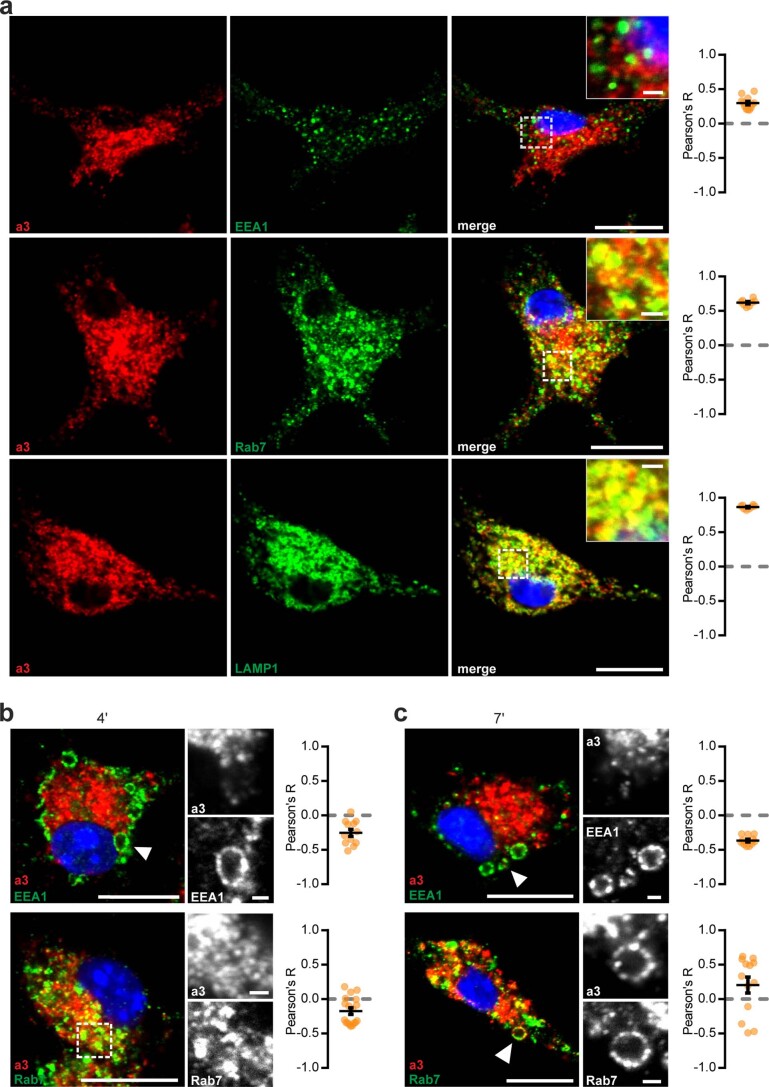
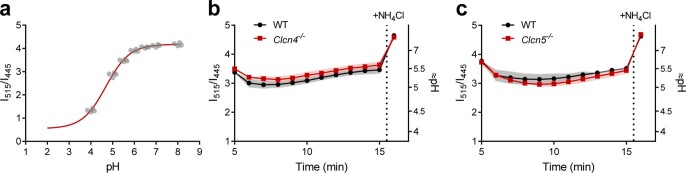
Intracellular organelles change their size during trafficking and maturation. This requires the transport of ions and water across their membranes. Macropinocytosis, a ubiquitous form of endocytosis of particular importance for immune and cancer cells, generates large vacuoles that can be followed optically. Shrinkage of macrophage macropinosomes depends on TPC-mediated Na+ efflux and Cl- exit through unknown channels. Relieving osmotic pressure facilitates vesicle budding, positioning osmotic shrinkage upstream of vesicular sorting and trafficking. Here we identify the missing macrophage Cl- channel as the proton-activated Cl- channel ASOR/TMEM206. ASOR activation requires Na+-mediated depolarization and luminal acidification by redundant transporters including H+-ATPases and CLC 2Cl-/H+ exchangers. As corroborated by mathematical modelling, feedback loops requiring the steep voltage and pH dependencies of ASOR and CLCs render vacuole resolution resilient towards transporter copy numbers. TMEM206 disruption increased albumin-dependent survival of cancer cells. Our work suggests a function for the voltage and pH dependence of ASOR and CLCs, provides a comprehensive model for ion-transport-dependent vacuole maturation and reveals biological roles of ASOR.


Conflict of interest statement

The authors declare no competing interests.

Figures

Fig. 1
Fig. 1. Ions and candidate ion transporters in MP shrinkage.
a, Scheme of experimental approach. b, Fluorescence images of MPs formed in presence of 70 kDa TMR–dextran, 5 and 15 min after M-CSF addition. Scale bars, 5 µm. c, Removal of luminal Na+ or Cl impairs MP resolution, measured by vesicle volume (left) or TMR-dextran fluorescence (right). n = 11, N = 743 (WT); n = 7, N = 533 (low Na+, near 0 mM); n = 10, N = 869 (low Cl, 9 mM). n is number of animals, N is number of MPs. Plot of mean ± standard error of the mean (s.e.m.) (shown as bands), averaging means from individual mice. d, Mean MP volume 15 min after M-CSF normalized to volume at 5 min as function of luminal ion concentrations. Data points, mean values from individual mice. Error bars, s.e.m. One-way ANOVA with Tukey’s multiple comparison shown with regard to NaCl. e, Ion transporter candidates. fm, Western blot expression analysis of TMEM206 (specific bands indicated by arrows) (f), LRRC8A (g), ClC-2 (h), ClC-3 (i), ClC-4 (j), ClC-5 (k), ClC-6 (l) and ClC-7 (m) in mouse BMDMs, compared with organs highly expressing the respective proteins. α1 Na/K-ATPase (f) and actin (gm) were used as loading control. n = 3 for each western blot. Source numerical data and unprocessed blots are available in source data. Source data
Fig. 2
Fig. 2. Endogenous expression of TMEM206 and ClC-7 in mouse primary macrophages.
a, Immunofluorescence analysis for TMEM206 in BMDMs. The channel resides on intracellular vesicles (arrow) but also at the plasma membrane (arrowhead). Tmem206−/− cells prove antibody specificity. Scale bars, 5 µm. b, Representative traces of acid-activated (pHo 4.8) anion currents in WT, but not Tmem206−/− BMDMs, obtained with whole-cell patch-clamp recordings. Voltage step protocol shown on top. N = 8 cells per genotype. c, TMEM206 co-localizes with early endosomal EEA1, but not with lysosome marker LAMP1. Pearson’s R calculated from 21 cells (EEA1) and 33 cells (LAMP1) from two independent experiments. d, ClC-7 is present in lysosomes (LAMP1) and does not co-localize with early endosome marker EEA1. Pearson’s R calculated from 27 cells (EEA1) and 23 cells (LAMP1) from two independent experiments. Mean ± s.e.m. Scale bars, 5 µm and 1 µm for enlargements. Source numerical data are available in source data. Source data
Fig. 3
Fig. 3. Expression of TMEM206 and ClC-7 on BMDM MPs.
a,b, TMEM206 on MPs 4 min (a) and 7 min (b) after M-CSF co-localize with rab5 (a and b) and rab7 (b) respectively. Pearson’s R calculated from 23 cells (Rab5, 4 min), 27 cells (Rab5, 7 min), 22 cells (Rab7, 4 min) and 21 cells (Rab7, 7 min) from at least two independent experiments. Scale bars, 10 µm and 1 µm for enlargements. c, Frames from live cell imaging of TMEM206-GFP transfected BMDMs at various timepoints after addition of M-CSF together with TMR–dextran (Supplementary Video 2). Scale bars, 5 µm and 1 µm for enlargements (bottom). df, ClC-7 is absent from MPs at 4 min (d) or 7 min (e) after M-CSF induction, but is on rab7-positive MPs after 15 min (f). Areas chosen for magnification indicated by white arrowheads on the left. Rab7 was absent from MPs at 4 min (d). Scale bars, 10 µm and 1 µm for enlargements. Source numerical data are available in source data. Source data
Fig. 4
Fig. 4. MP resolution impaired by Tmem206 ablation and rescued by Cl channels.
ac, Tmem206 disruption in BMDMs impairs MP resolution, n = 7, N = 419 (WT); n = 11, N = 922 (Tmem206/). Impact of Cl substitution on WT resolution (green dashed line, data from Fig. 1c) shown for comparison. Data included in WT control partially overlap with NaCl control in Fig. 1c. Two-tailed Mann–Whitney test (volume), unpaired two-tailed t-test (intensity). df, KD of TMEM206 in HT-1080 cancer cells impairs MP resolution, n = 5, N = 37 (control, transfected with non-targeting siRNA), N = 38 (Tmem206/). One-sample two-tailed t-test comparing ratio (KD and corresponding control) with hypothetical value of 1. g, TMEM206, but not dead-pore mutant TMEM206(K319C) (ref. ), rescues MP resolution of Tmem206/ BMDMs. n = 5, N = 37 (WT + GFP); n = 5, N = 10 (WT + TMEM206); n = 4 (Tmem206/ + GFP N = 11 or +TMEM206 N = 9); n = 5, N = 16 (Tmem206/ + TMEM206(K319C)); Kruskal−Wallis comparison with Dunn’s post-hoc test with regard to Tmem206/ + GFP done on cells for every minute, significance shown between Tmem206/ + GFP (N* = 8) and Tmem206/ + TMEM206 (N* = 8); Tmem206/ + TMEM206(K319C) (N* = 10) is not significantly different from Tmem206/ + GFP. h, Overexpression of WT and Y10A mutant TMEM206 in Tmem206/ macrophages similarly enhances MP shrinkage, n = 4, N = 98 (NT), N = 31 (Tmem206/ + TMEM206), N = 28 (Tmem206/ + TMEM206(Y10A)). i, Neither ClC-2 nor ‘open’ ClC-2(G24D) (ref. ) rescues resolution in Tmem206/ BMDMs. n = 4, N = 43 (NT); n = 4 (Tmem206/ + ClC-2 N = 13 or +ClC-2(G24D) N = 12). j, ClC-5(E211A) uncoupled mutant,, but not WT ClC-5, rescues Tmem206/ MP resolution. n = 3, N = 8 Tmem206/ + ClC-5, n = 4, N = 9 +ClC-5(E211A), n = 4, N = 40 NT); one-way ANOVA with Dunnett’s post-hoc test (with regard to NT) done on cells for every minute. Significance shown between Tmem206/ (NT) (N* = 20) and Tmem206/ + ClC-5(E211A) (N* = 8). *P ≤ 0.05, **P ≤ 0.01, ***P ≤ 0.001 and ****P ≤ 0.0001. All plots present mean ± s.e.m. (shown as bands). N* is number of cells. Source numerical data are available in source data. Source data
Fig. 5
Fig. 5. Roles of V-type ATPase and CLC 2Cl/H+ exchangers in luminal pH and resolution of MP.
a, Disruption of Tmem206 or low luminal Cl acidify MP lumina. n = 3, N = 81 (WT); n = 7, N = 142 (Tmem206/); n = 4, N = 150 (low Cl); n = 5, N = 198 (low Na+). b,c, Addition of 20 mM NH4Cl abolishes MP shrinkage, n = 4 (N = 419 WT, N = 749 WT + NH4Cl). d, Bafilomycin (BafA) alkalinizes MPs in both WT and Tmem206/ BMDMs. n = 4 (WT alone N = 175 or +BafA N = 188); n = 3, N = 117 (Tmem206/); n = 4, N = 194 (Tmem206/ + BafA). e, pH changes upon lowering luminal Cl from 159 mM to 9 mM in Tmem206−/− BMDMs indicate Cl/H+ exchange (n = 3; high Cl alone N = 287, +BafA N = 429, low Cl alone N = 298, +BafA N = 369). f,g, BafA decreases MP shrinkage in WT and Clcn5/, but not Tmem206/ BMDMs n = 7, N = 456 (WT); n = 8, N = 468 (WT + BafA); n = 3 (Tmem206/ alone N = 359 or +BafA N = 278); n = 5 (Clcn5/ alone N = 421 or + BafA N = 434). h, BafA alkalinizes WT and Clcn5/ MPs. n = 4 (WT alone N = 480 or +BafA N = 384); n = 6 (Clcn5/ alone N = 433 or +BafA N = 480). i, Reductionist mathematical model (Supplementary Note) semi-quantitatively explains results shown in a and e. Overlay from pH panels of Supplementary Note Fig. 3a,b. Shaded area, early timepoints that could not be determined experimentally. j,k, TMEM206 and ClC-5 are co-expressed on same MPs, at both 4 and 7 min after M-CSF. Small panels, magnified MPs indicated by arrowheads. Pearson’s R calculated from 25 cells (4 min), 16 cells (7 min) from three (4 min) and two (7 min) independent experiments. All plots present mean ± s.e.m. (shown as bands) averaging from individual mice. Scale bars, 10 µm and 1 µm for the magnification panels. In a, d, e and h, 20 mM NH4Cl was added to show dye responsiveness to alkalinization (bleaching control). Source numerical data are available in source data. Source data
Fig. 6
Fig. 6. ClC-5 co-localizes with TMEM206 in macrophages endosomes and MPs.
a, ClC-5 immunostaining in WT and Clcn5/ (control) BMDMs. b, ClC-5 was co-localized with endolysosomal markers rab5 and EEA1, partially with late endosomal marker rab7 but not with lysosomal LAMP1. c,d, ClC-5 is present on MPs labelled by rab5 and rab7 stainings, at 4 min (c) and 7 min (d) after M-CSF addition. Pearson’s R calculated from 31 cells (Rab5, 4 min), 17 cells (Rab5, 7 min), 21 cells (Rab7, 4 min) and 15 cells (Rab7, 7 min). e, TMEM206 (green) and ClC-5 (red) are present on the same vesicles in BMDMs. Absence of ClC-5 antibody labelling in Clcn5−/− BMDMs confirms the specificity of staining. Pearson’s R calculated from 29 cells from two (Rab5 and ClC-5/TMEM206) and one (Rab7) independent experiments. Mean ± s.e.m. Scale bars, 10 µm and 1 µm for the magnification panels. Source numerical data are available in source data. Source data
Fig. 7
Fig. 7. Physiological role of ASOR.
a, Model for roles of TPC, ClC-5, ASOR and V-ATPase in MP shrinkage. The voltage U is defined as difference between the luminal and cytoplasmic electrical potentials (U lum and Ucyt respectively). b, Effects of anion transporter disruption on MP shrinkage. n = 19 (WT); n = 11 (Tmem206/); n = 3 (Clcn2/, Clcn3/ and Clcn4/); n = 5 (Clcn5/); n = 3 (Clcn7/); n = 4 (Lrrc8a/), n = 7 (WT + DMSO); n = 8 (WT + BafA). Kruskal–Wallis (Dunn’s post hoc) test for all KO versus WT (includes WT controls to all corresponding KO in the same dataset) with Kruskal–Wallis test (Dunn’s normalization for multiple comparison). Unpaired two-tailed t-test for DMSO versus BafA. c, Transfection of TMEM206(R87C) in Tmem206/ BMDMs accelerated MP shrinkage compared with NT cells. One-way ANOVA with Dunnett’s post-hoc test comparing with WT NT. Significance shown for 14 (Tmem206/ + TMEM206(R87C)) and 9 (WT NT) cells from n = 3 mice each (N = 22 WT NT, N = 26 Tmem206/ NT, N = 17 Tmem206/ + TMEM206(R87C) MPs). *P ≤ 0.05, **P ≤ 0.01. d, Tmem206/ macrophages migrate slower than WT in a scratch assay in presence of C5a. Data obtained 12 h after scratch. n = 13, one sample two-tailed t-test comparing ratio (WT to corresponding KO) with hypothetical value of 1. Lines connect values obtained from WT and KO BMDMs that were prepared, handled and imaged in parallel. e, TMEM206 disruption enhances the positive effect of 3% BSA on viability of MIA PaCa-2 cancer cells in amino-acid-depleted medium measured after 72 h. n = 3, cells generated with two sgRNAs; two independent cell lines (open and filled symbols) for sgRNA2, unpaired two-tailed t-test. For all plots, mean ± s.e.m. is shown. Source numerical data are available in source data. Source data
Extended Data Fig. 1
Extended Data Fig. 1. Specificity of custom-made antibodies against TMEM206.
Western Blot of membrane preparations of WT and Tmem206 KO HEK cells to check for specificity of two custom-made rabbit anti-TMEM206 antibodies, one directed against the C-terminus of mouse TMEM206 (against the peptide sequence IKIRKRYLKRRGQATNHIS) (a) and another directed against the extracellular loop (against the peptide sequence VKTKEEDGREAVEFRQET) (b). Both antibodies had been affinity-purified with the cognate peptide. While both antibodies recognized several unspecific bands, bands at the correct size were missing in KO samples. CT1-F1 antibody was used for the immunodetection of TMEM206 in BMDMs and HEK cells after antigen retrieval and proved to be specific as evident from loss of signal in Tmem206 KO cells (Fig. 2a, Extended Data Fig. 3a). Na/K-ATPase α1 subunit was used as loading control. 30 µg of membrane preparation were loaded per lane for each sample. Source unprocessed blots are available in source data. Source data
Extended Data Fig. 2
Extended Data Fig. 2. Expression patterns of TMEM206 and ClC-7 in primary bone marrow-derived macrophages.
(a) Endogenous TMEM206 co-localizes with early endosomal rab5 and partially with late endosomal rab7. Pearson’s R calculated from 19 cells (Rab5), 27 cells (Rab7) from 2 independent experiments. (b) Expression of human TMEM206 C-terminally tagged with GFP in Tmem206/ primary macrophages gives similar expression pattern as endogenous TMEM206 protein. (c) ClC-7 co-localizes with late endosome marker rab7. Pearson’s R calculated from 26 cells from 2 independent experiments. Mean ± s.e.m. Scale bars: 10 µm, 1 µm for enlargements. Source numerical data are available in source data. Source data
Extended Data Fig. 3
Extended Data Fig. 3. TMEM206 is present in early endosomes in HEK cells.
(a) Immunofluorescence staining of endogenous TMEM206 in HEK WT cells. This staining is abolished in TMEM206 KO HEK cells. (b) Endogenous TMEM206 co-localizes with EEA1 and rab5, early endosomes markers, and partially with rab7, a marker of late endosomes. Scale bars: 10 µm, 1 µm for enlargements.
Extended Data Fig. 4
Extended Data Fig. 4. Generation of Tmem206−/− mouse lines and TMEM206 KD in HT-1080 cells.
(a) Strategy for disrupting Tmem206 in mice using CRISPR-Cas9 genome editing technique. gRNAs (in red) g1 and g5, both targeting exon 2, coding for the N terminus of TMEM206, were injected together and led to a 62 bp deletion. Similarly, g1 or g2, also targeting exon 2, were injected together with g6 targeting exon 3 after the sequence coding for the first transmembrane domain, leading to a deletion of ≈ 10 kbp. These injections led to the generation of three different Tmem206 KO mouse lines called T6-1/5 (injection of g1 and g5), T6-1/6 (injection of g1 and g6) and T6-2/6 (injection of g2 and g6). (b) Sequencing of one of the founders of the T6-1/5 line. (c) Genotyping PCR of WT homozygous (+/+), heterozygous (+/-) and KO homozygous (-/-) mice from the T6-1/5 line using the genotyping primers (a, in green) flanking the exon 2. (d) Western blot analysis of TMEM206 expression in different tissues from WT and KO mice confirmed that TMEM206 is deleted in all 3 different KO lines. Key experiments were done with BMDMs from these three different lines to exclude possible off-target effects of sgRNAs. 30 µg protein of membrane preparation were loaded per lane for each sample. TMEM206 proteins were detected using the custom-made antibodies targeted against the extracellular loop. Na/K-ATPase α1 subunit was used as loading control. For the WB done with animals from the T6-1/5 line, TMEM206 signals from different organs were obtained from different membranes but at the same exposure. This also holds true for the T6-1/6 line, except for the pancreas samples, which were obtained after shorter exposure time compared to the other organs. For the T6-2/6 line, all the signals come from the same membrane and exposure time. Na/K ATPase signals were obtained from different membranes and exposure time was different among the different organs (as organs express different amounts of Na/K ATPase) for the three lines. Lanes coming from different membrane or exposure time are delineated by dotted grey lines. Importantly, WT and KO samples (from the corresponding organs and mouse lines) always had the same exposure time to confirm the lack of TMEM206 expression in the KO animals. (e) TMEM206 knock-down (KD) efficiency in HT-1080 cells compared to cells transfected with non-targeting siRNA (ctrl), quantified in Fiji, 30 µg of protein per lane, n=5 (independent transfections). Na/K ATPase is a loading control. TMEM206 protein was detected using custom-made antibody against the extracellular loop. Mean ± s.e.m. Source numerical data and unprocessed blots are available in source data. Source data
Extended Data Fig. 5
Extended Data Fig. 5. Disruption of Clcn2, Clcn3, Clcn4, Clcn5, Clcn7 and Lrrc8a did not affect macropinosome resolution.
(a-e) For each genotype volume decrease (upper panels) and fluorescence intensity increase (lower panels) are not significantly different from WT (n=3 mice for Clcn2/ (N=294) and Clcn3/ (N=266), n=4, N=125 for WT); n=3 for Clcn4/ (N=270) and WT (N=235); n=5, N=822 for Clcn5/ and n=3, N=263 for WT; n=3 for Clcn7/ (N=19) and WT (N=74); n=4, N=311 for Lrrc8a/ and n=3, N=159 for WT. Clcn7−/− cells were selected by YFP expression. Plot of mean ± s.e.m. (shown as bands), averaging means from individual mice. (f) Western blot showing decreased expression of LRRC8A in Cx3cr1-CreERT2; Lrrc8alox/lox BMDMs after tamoxifen (Tam) induction (top panel). Actin (bottom panel) was used as loading control. 10 µg of total protein were loaded per sample. Source numerical data and unprocessed blots are available in source data. Source data
Extended Data Fig. 6
Extended Data Fig. 6. Initial formation of macropinosomes and phagosomes is not affected by Tmem206 knock-out.
(a) No effect of ion replacement or Tmem206 disruption on initial formation of macropinosomes. Each dot represents the mean number of detected macropinosomes per cell from BMDM preparation from one individual mouse, with at least 100 BMDMs evaluated per mouse. n=20 (WT); n=10 (Tmem206/); n=9 (low Cl, 9 mM); n=7 (low Na+, nominally 0 mM). No significant difference between any conditions (Kruskal-Wallis test with Dunn’s multiple comparison). p = 0.3264 (WT – Tmem206/), p > 0.9999 (WT – low Cl), p > 0.9999 (WT – low Na+). (b) BMDMs were incubated with killed fluorescent E. coli (green) and fixed after 5 and 15 min of incubation. TMEM206 was detected by immunostaining (red). Vesicles containing one or more bacteria were decorated with TMEM206-positive dots. Scale bars: 5 µm, 2 µm for enlargements. (c) Number of beads of 3- or 6-µm diameter phagocytosed by WT and Tmem206/ macrophages, incubated with or without cytochalasin D (10 µM), an actin inhibitor. Two sizes (3- and 6-µm diameter) of beads were tested since disruption of Trpml1 or BK channels has been reported to differentially affect only larger beads,. Similar to our observation for the formation of macropinosomes, disruption of Tmem206 lacked an effect on the uptake of either size class of beads. n=4 mice per condition. Unpaired two-tailed t test. Mean ± s.e.m. Source numerical data are available in source data. Source data
Extended Data Fig. 7
Extended Data Fig. 7. Localization of LRRC8A in BMDMs.
(a) Lrrc8a3xHA/3xHA mice that express a LRRC8 protein C-terminally tagged with 3 copies of the HA-epitope from the native genomic locus were used to determine the subcellular localization of the essential VRAC subunit LRRC8A. Anti-HA antibodies detected the protein in the plasma membrane of Lrrc8a3xHA/3xHA BMDMs but not in WT control macrophages. (b) LRRC8A is present at the plasma membrane of Lrrc8a3xHA/3xHA BMDMs. There is no significant co-localization with endolysosomal markers rab5 (early endosomes), rab7 (late endosomes) or LAMP1 (lysosomes). Pearson’s R calculated from 18 cells (Rab5), 20 cells (Rab7), 16 cells (LAMP1). (c) 4 min after M-CSF addition, LRRC8A can be detected in early macropinosomes (co-stained by rab5) in ≈5-10% of cells, but not in rab7-positive mature macropinosomes. All small panels represent magnified macropinosomes or regions of interest indicated by white arrowheads. Pearson’s R calculated from 15 cells (Rab5, 4min), 10 cells (Rab7, 4min), 5 cells (Rab5, 7min), 10 cells (Rab7, 7min). Mean ± s.e.m. Scale bars: 10 µm and 1 µm for the magnification panels. Source numerical data are available in source data. Source data
Extended Data Fig. 8
Extended Data Fig. 8. Localization of LRRC8D in BMDMs.
(a) Localization of LRRC8D used BMDMs from Lrrc8dtdTomato/tdTomato knock-in mice that were stained with an anti-RFP antibody. No fluorescence signal was detected in WT macrophages (negative control). (b) No significant co-localization of LRRC8D in BMDMs with early endosomal rab5, late endosomal rab7 or LAMP1 (lysosomes) was observed. Pearson’s R calculated from 17 cells (Rab5), 17 cells (LAMP1), 14 cells (Rab7). (c) LRRC8D could not be detected in macropinosomes (detected by rab5 and rab7 stainings), neither at 4 nor at 7 min after M-CSF stimulation. All small panels represent magnified macropinosomes or regions of interest indicated in left panels by white arrowheads. Pearson’s R calculated from 16 cells (Rab5, 4min), 11 cells (Rab7, 4min), 11 cells (Rab5, 7min), 9 cells (Rab7, 7min). (d) Localization of LRRC8A/LRRC8D heteromers in transfected cells. Untagged-LRRC8A and tdTomato-tagged LRRC8D were co-transfected (ratio 1:1) in HeLa WT cells to determine the subcellular localization of LRRC8A/LRRC8D heteromers. Note that LRRC8D needs LRRC8A to leave the endoplasmic reticulum and for its transport to the plasma membrane. In contrast to work by others, we detected LRRC8D almost exclusively at the plasma membrane but not in lysosomes (consistent with our results on BMDMs, Extended Data Figs. 7 and 8). 4 different cells expressing both proteins are shown. Mean ± s.e.m. Scale bars: 10 µm and 1 µm for enlargements. Source numerical data are available in source data. Source data
Extended Data Fig. 9
Extended Data Fig. 9. Localization of the a3 V-ATPase subunit in BMDMs.
(a) The V-ATPase a3 subunit shows significant co-localization with lysosomal/late endosomal LAMP1 and late endosomal rab7, but not with early endosomal rab5 in unstimulated BMDMs. Pearson’s R calculated from 12 cells (EEA1), 8 cells (Rab7), 8 cells (LAMP1). (b, c) Upon exposure to M-CSF, the a3 subunit was detected in rab7-positive macropinosomes after 7 min (c), but not after 4 min (b). It was not found in rab5-positive MPs. Pearson’s R calculated from 12 cells (EEA1, 4min), 18 cells (Rab7, 4min), 11 cells (EEA1, 7min), 13 cells (Rab7, 7min). All small panels represent enlarged images of macropinosomes or regions of interest indicated by white arrowheads. Mean ± s.e.m. Scale bars: 10 µm and 1 µm for enlargements. Source numerical data are available in source data. Source data
Extended Data Fig. 10
Extended Data Fig. 10. Luminal pH of macropinosomes.
(a) Calibration of 70 kDa Oregon Green dye with Boltzmann sigmoidal fit (red line), n=1 (BMDMs prepared from one animal), ≈ 150 cells per replicate (each dot is a new field of view, 4 fields in total that belong to 2 different imaging dishes). pH½ =4.7 calculated from calibration curve is similar to provided by manufacturer pKa=4.7. (b-c) Neither disruption of Clcn4 (b) nor of Clcn5 (c) significantly changed macropinosomal pH when measured from 5 min after M-CSF application onwards. n=3 for Clcn4/ (N=337) and corresponding WT (N=118); n=5, N=389 for Clcn5/ and n=2, N=141 for corresponding WT. Plot of mean ± s.e.m. (shown as bands), averaging means from individual mice. Source numerical data are available in source data. Source data

References

    1. Yoshida S, Pacitto R, Yao Y, Inoki K, Swanson JA. Growth factor signaling to mTORC1 by amino acid-laden macropinosomes. J. Cell Biol. 2015;211:159–172. doi: 10.1083/jcb.201504097. - DOI - PMC - PubMed
    1. King JS, Kay RR. The origins and evolution of macropinocytosis. Philos. Trans. R. Soc. Lond. 2019;374:20180158. doi: 10.1098/rstb.2018.0158. - DOI - PMC - PubMed
    1. Stow JL, Hung Y, Wall AA. Macropinocytosis: insights from immunology and cancer. Curr. Opin. Cell Biol. 2020;65:131–140. doi: 10.1016/j.ceb.2020.06.005. - DOI - PubMed
    1. Recouvreux MV, Commisso C. Macropinocytosis: a metabolic adaptation to nutrient stress in cancer. Front. Endocrinol. 2017;8:261. doi: 10.3389/fendo.2017.00261. - DOI - PMC - PubMed
    1. Freeman SA, et al. Lipid-gated monovalent ion fluxes regulate endocytic traffic and support immune surveillance. Science. 2020;367:301–305. doi: 10.1126/science.aaw9544. - DOI - PMC - PubMed

Publication types