. 2022 Jun;54(6):804-816.
doi: 10.1038/s41588-022-01069-0. Epub 2022 May 19.

Single-nucleus chromatin accessibility profiling highlights regulatory mechanisms of coronary artery disease risk

Affiliations

Single-nucleus chromatin accessibility profiling highlights regulatory mechanisms of coronary artery disease risk

Adam W Turner et al. Nat Genet. 2022 Jun.

Erratum in

Abstract

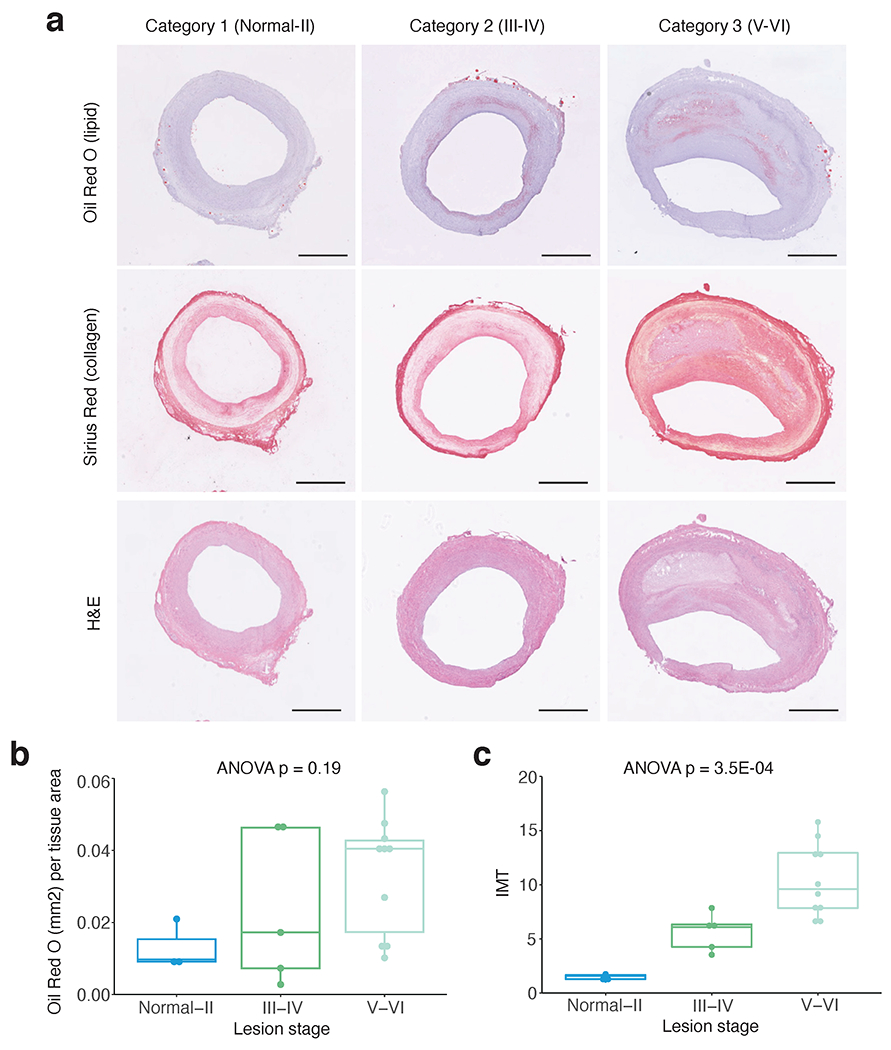
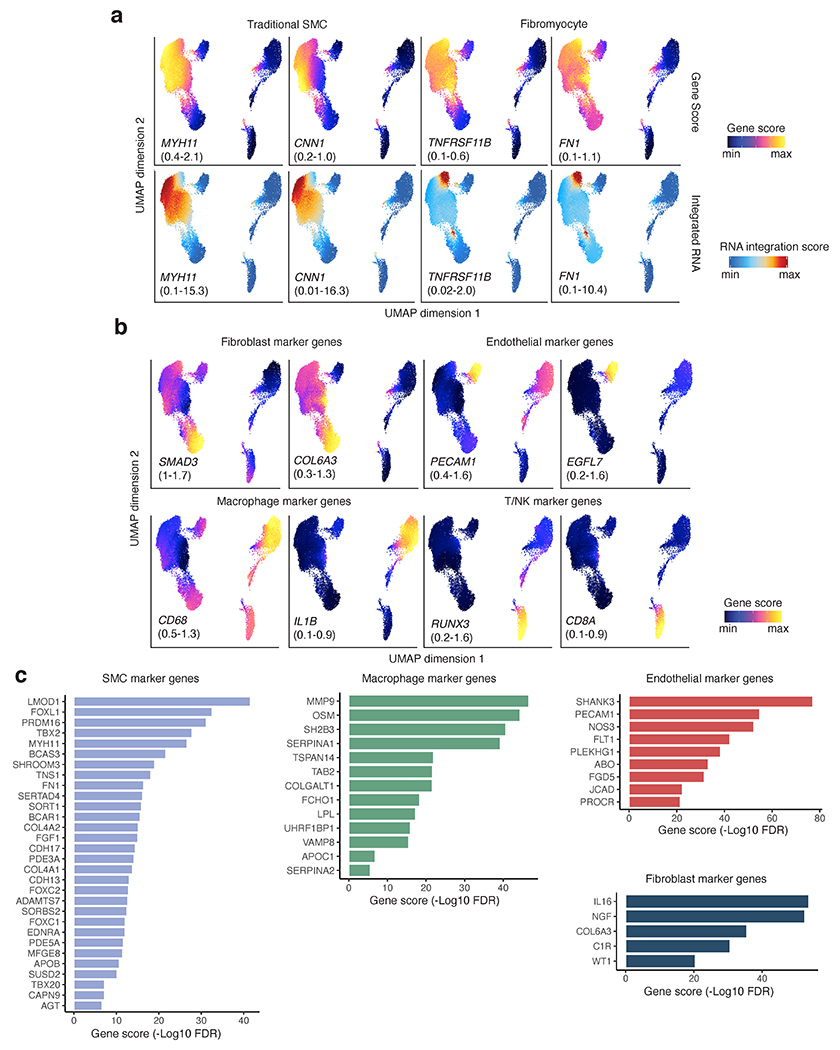
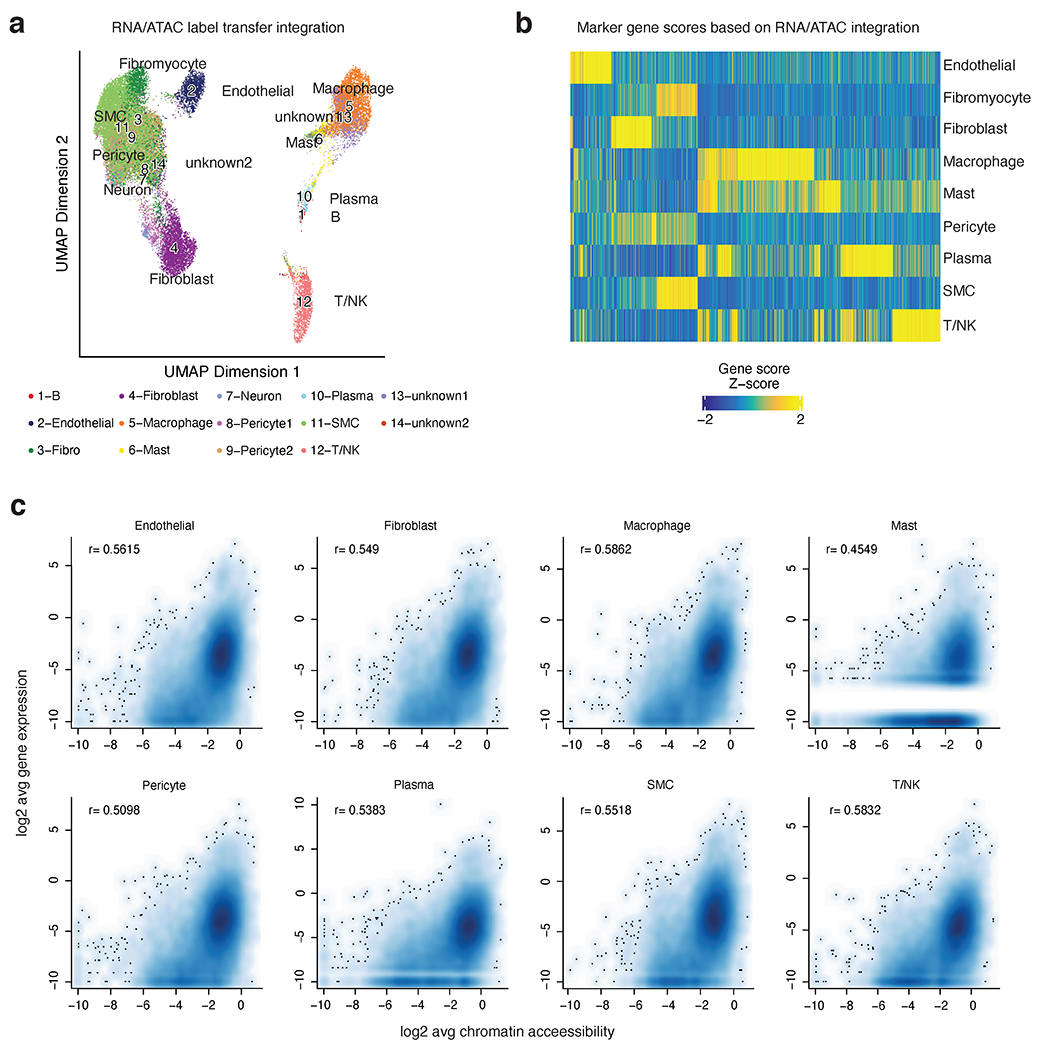
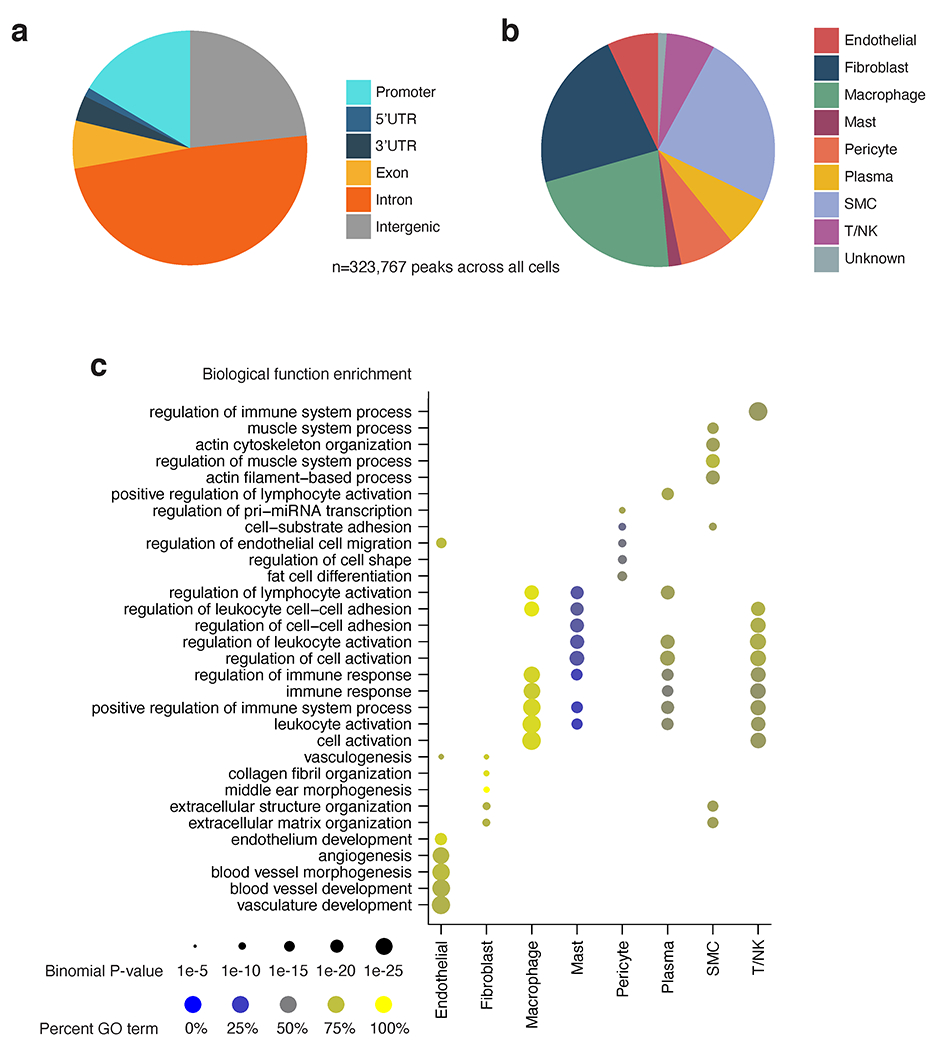
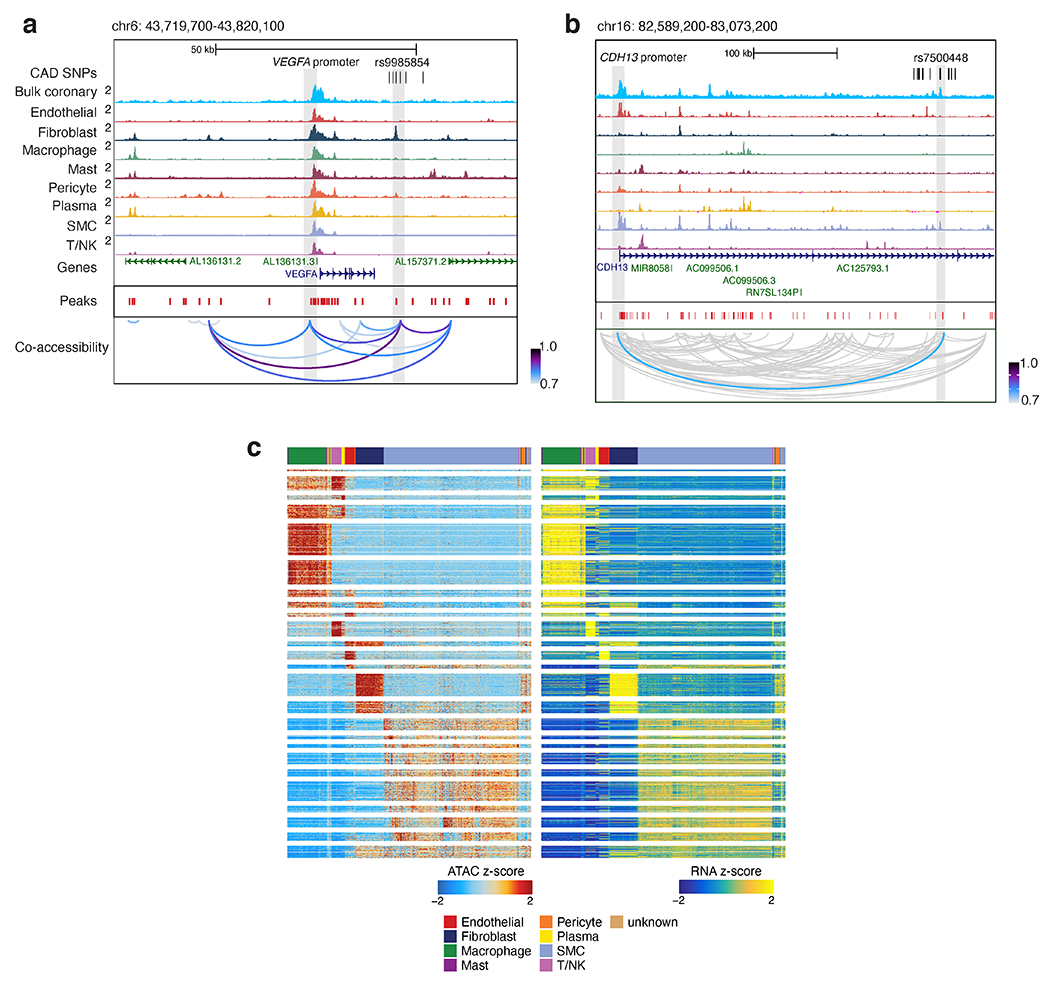
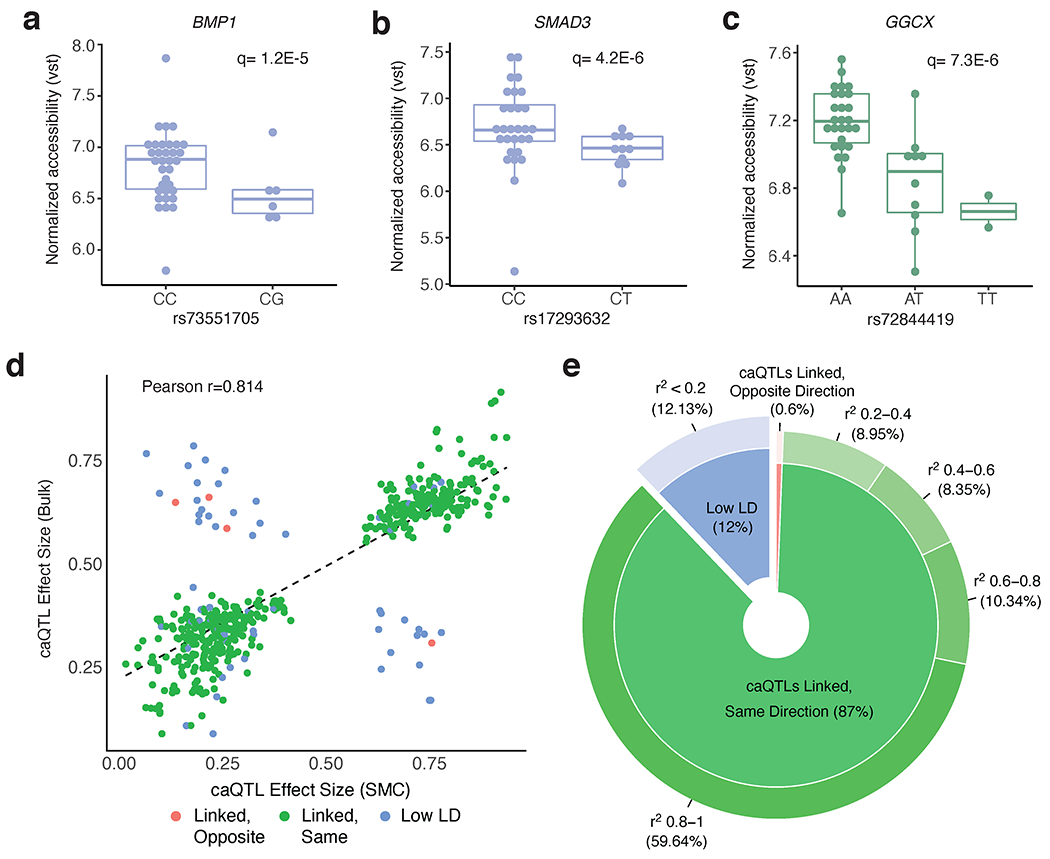
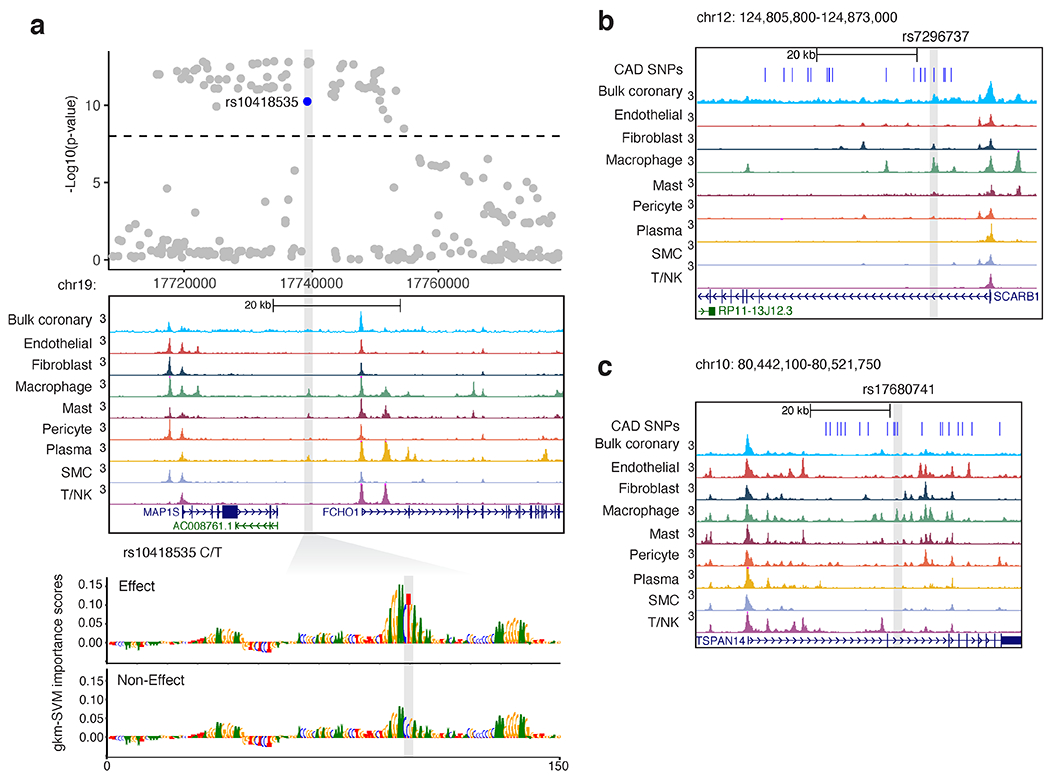
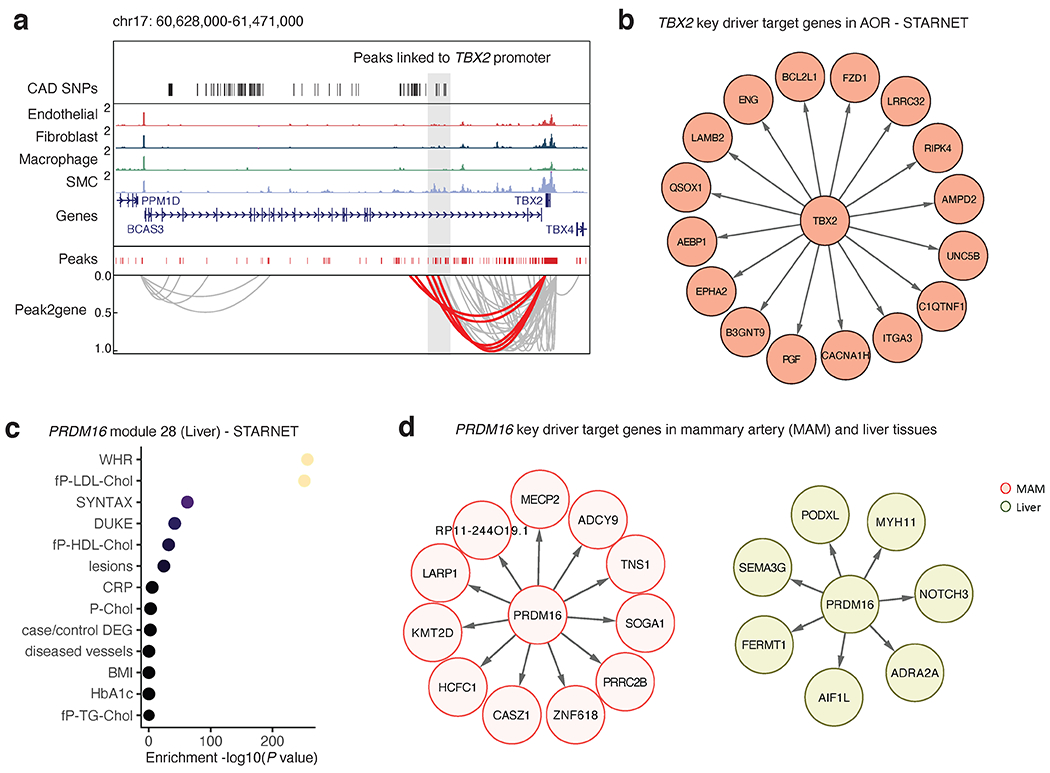
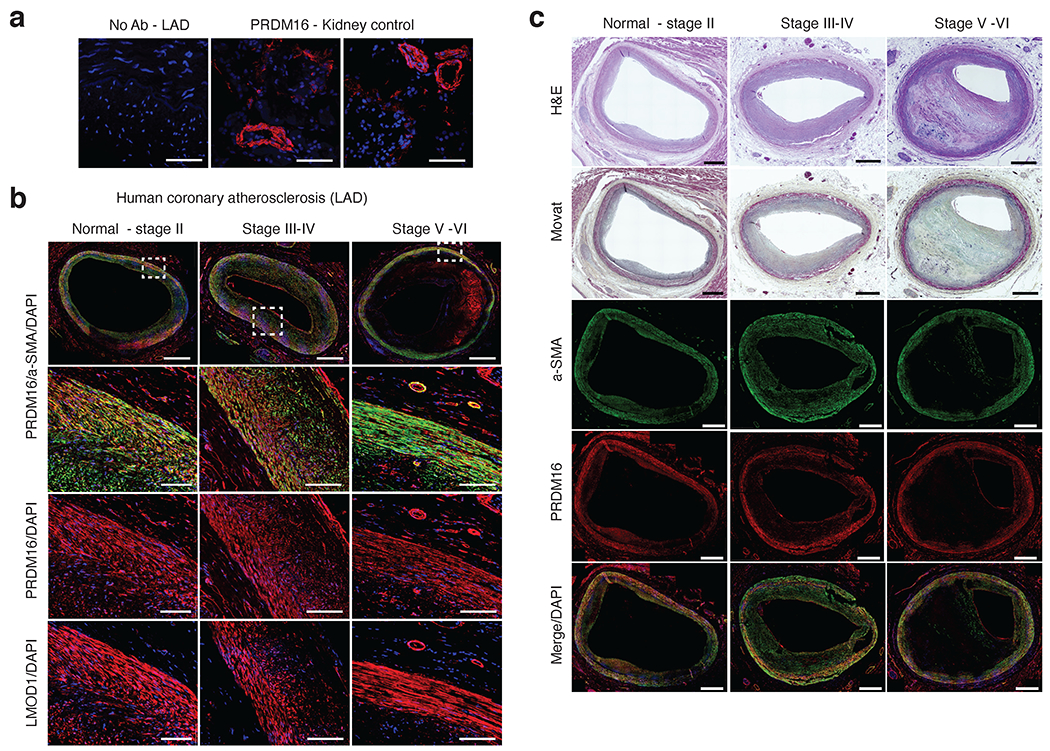
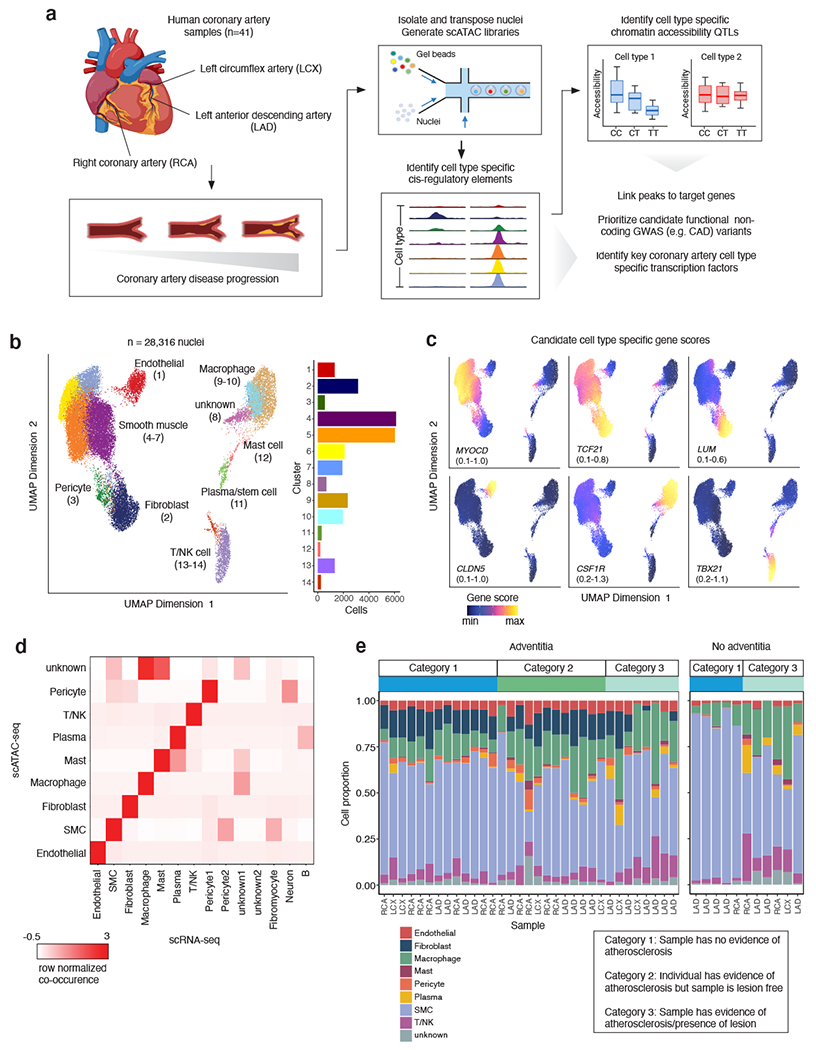
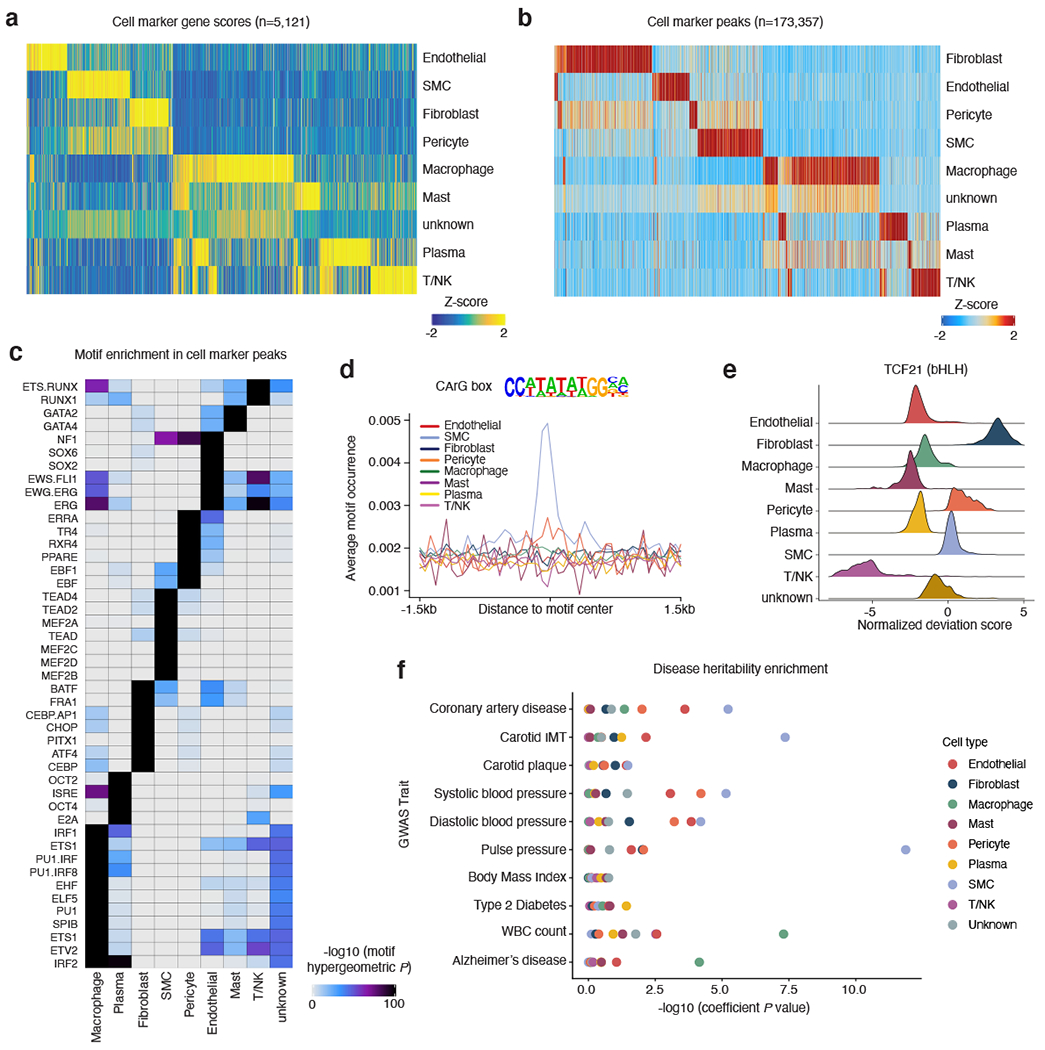
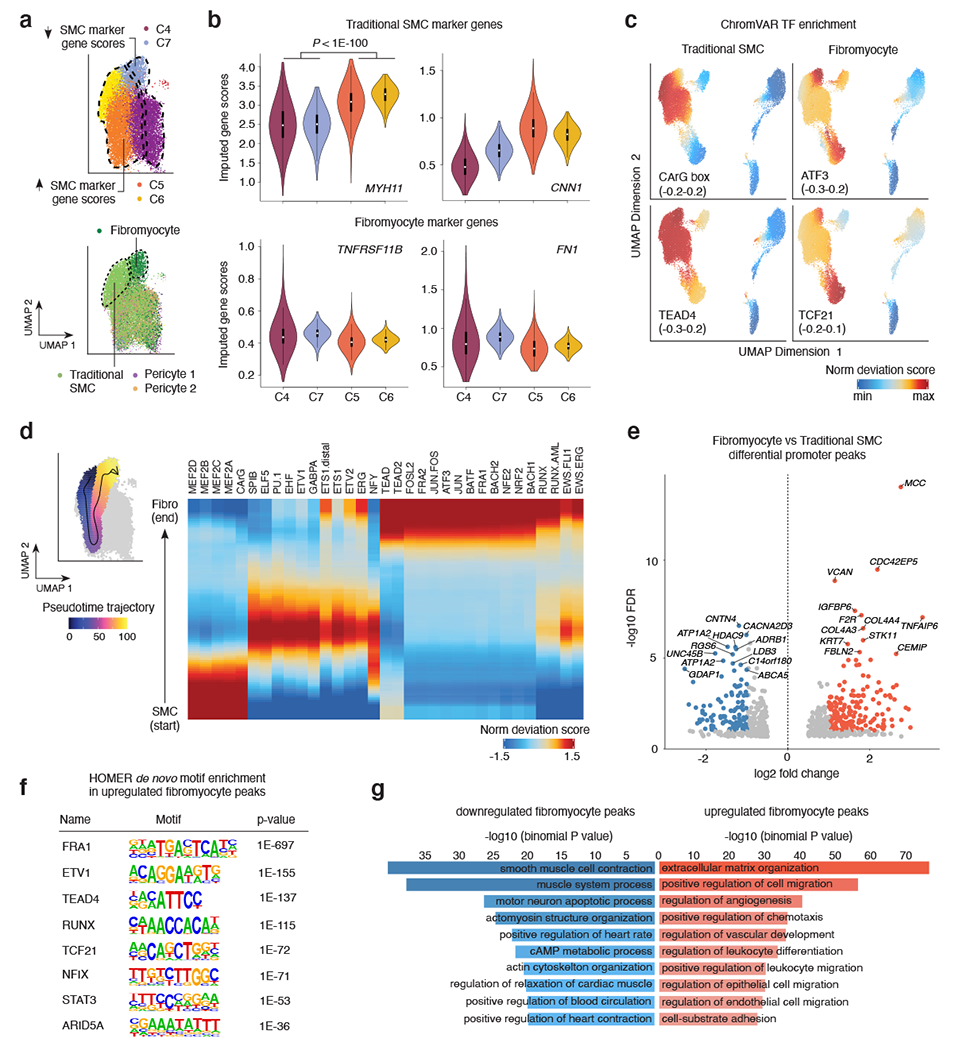
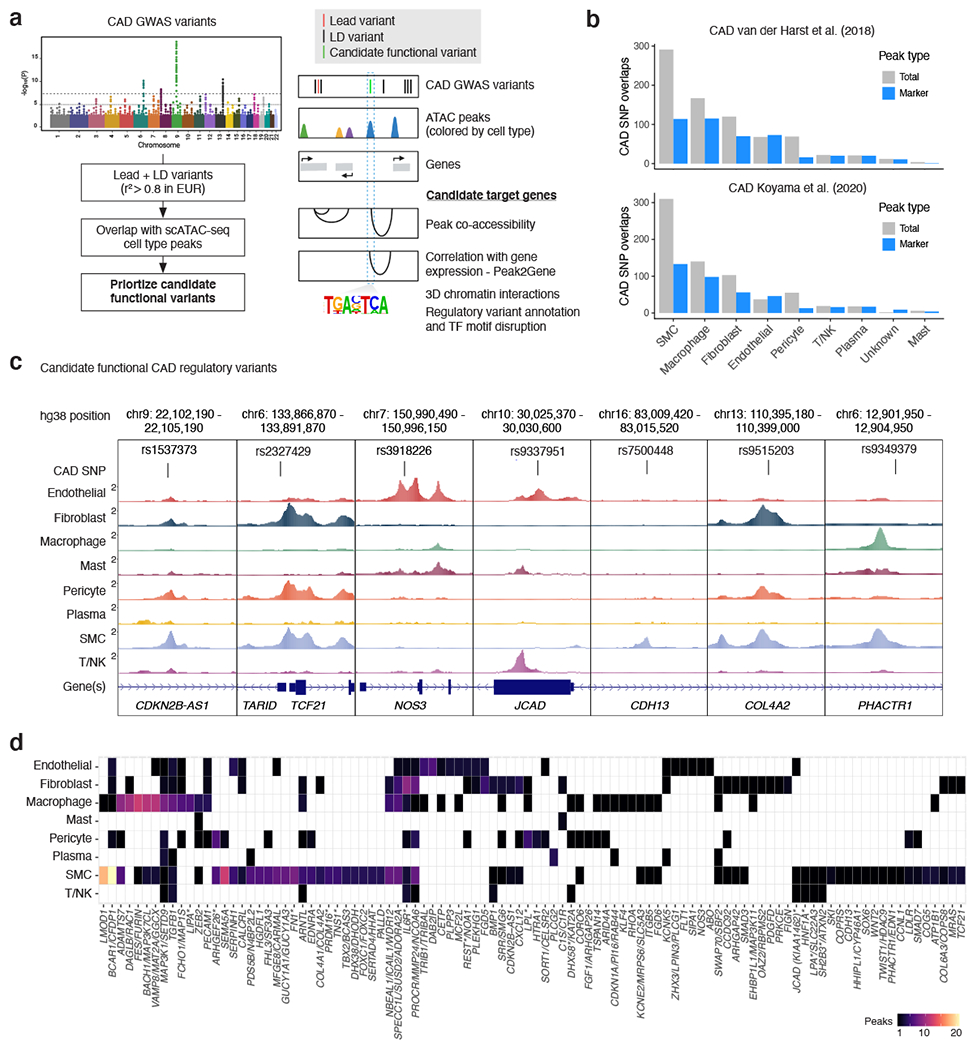
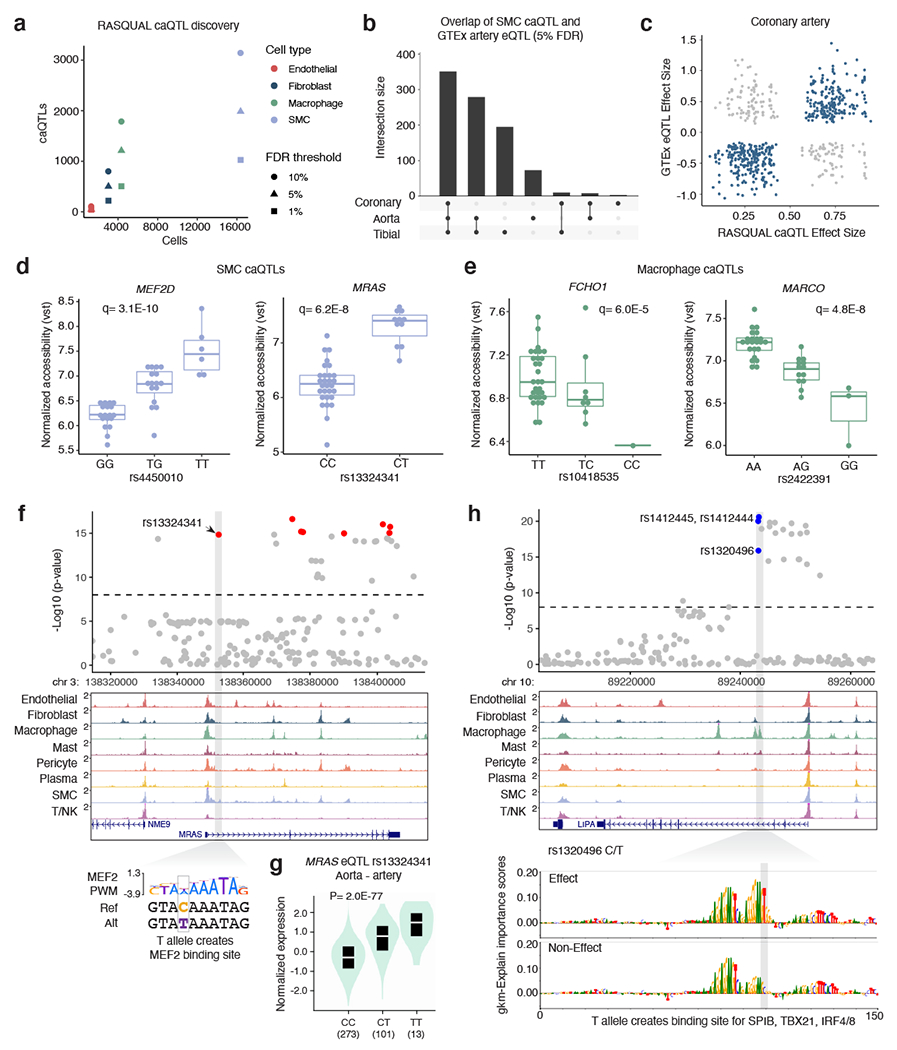
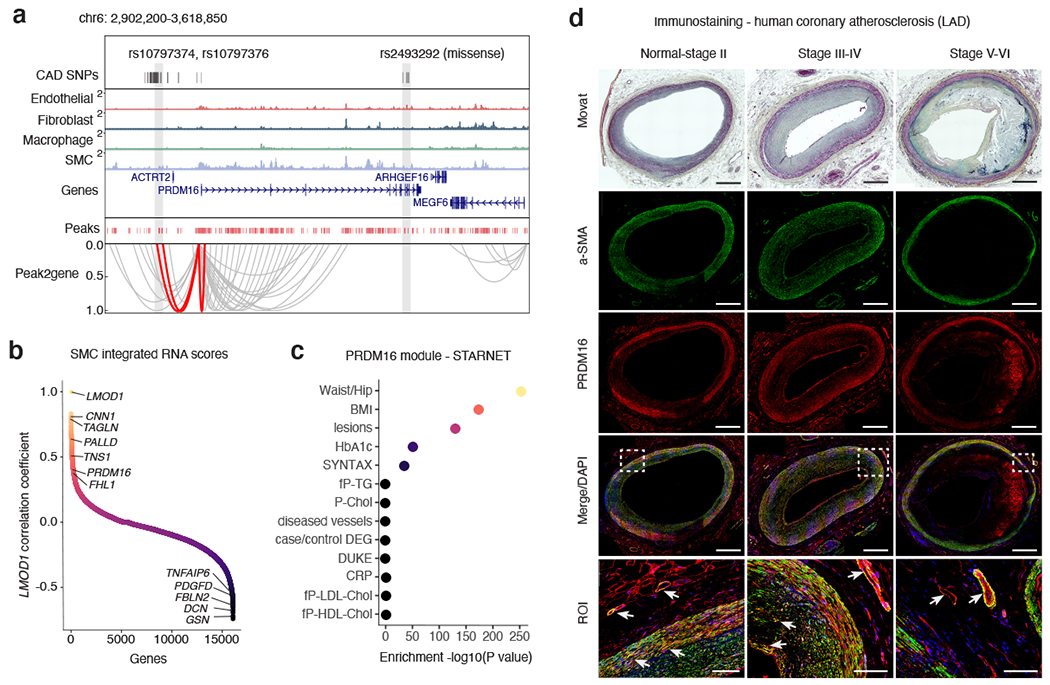
Coronary artery disease (CAD) is a complex inflammatory disease involving genetic influences across cell types. Genome-wide association studies have identified over 200 loci associated with CAD, where the majority of risk variants reside in noncoding DNA sequences impacting cis-regulatory elements. Here, we applied single-nucleus assay for transposase-accessible chromatin with sequencing to profile 28,316 nuclei across coronary artery segments from 41 patients with varying stages of CAD, which revealed 14 distinct cellular clusters. We mapped ~320,000 accessible sites across all cells, identified cell-type-specific elements and transcription factors, and prioritized functional CAD risk variants. We identified elements in smooth muscle cell transition states (for example, fibromyocytes) and functional variants predicted to alter smooth muscle cell- and macrophage-specific regulation of MRAS (3q22) and LIPA (10q23), respectively. We further nominated key driver transcription factors such as PRDM16 and TBX2. Together, this single-nucleus atlas provides a critical step towards interpreting regulatory mechanisms across the continuum of CAD risk.


Figures

Extended Data Fig. 1
Histological characterization of human coronary artery sections. (a) Representative histology staining of adjacent frozen human coronary artery sections at different disease categories used for snATAC profiling. Category 1 reflects normal to Stary atherosclerosis stage I/II lesions with adaptive intimal thickening and early lipid (Oil Red O (ORO)) and collagen (Sirius Red) accumulation in the subintimal layer. Category 2 reflects Stary stage III/IV early/intermediate atheroma lesions with increased lipid and collagen accumulation and proliferation (Hematoxylin & Eosin (H&E)). Category 3 reflects Stary stage V/VI advanced fibroatheroma or complex lesions with more severe lipid and collagen deposition as well as lipid core and thin media layer. (b) Whole slide quantitative results of ORO area (mm2) normalized to overall tissue area and (c) Sirius Red based quantitation of intima-media thickness (IMT) with maximum intima and average media width captured from >6 automatically defined measurements (Methods). (a-c) Similar results were observed from n=3, n=5, and n=10 independent donor samples per lesion stage, respectively. One-way ANOVA p-values after Tukey post-hoc test are shown for comparisons across lesion stages. Boxplots (b-c) represent the median and interquartile range (IQR) with upper (75%) and lower (25%) quartiles shown. Scale bars = 1 mm.
Extended Data Fig. 2
Coronary artery cell type marker genes from snATAC gene scores. (a) Representative UMAP plots of snATAC imputed gene activity scores and integrated RNA scores for SMC and fibromyocyte marker genes. (b) UMAP plots of imputed gene scores for additional cell type marker genes and CAD GWAS genes. (c) Top candidate genes at CAD GWAS loci with cell type enriched chromatin accessibility. Negative Log10 FDR enrichment values shown for CAD GWAS marker genes.
Extended Data Fig. 3
Integration of human coronary artery snATAC-seq data with human coronary artery scRNA-seq (from Wirka et al. Nat Med 2019). (a) UMAP showing projection of scRNA-seq cluster labels onto cells in the snATAC-seq dataset. Colors represent the assigned cellular identities from scRNA-seq label transfer. Detailed parameters of the snATAC-seq/scRNA-seq integration are provided in the Methods section. (b) Heatmap of marker gene scores after ArchR RNA/ATAC integration highlights 4,649 marker features. (c) Correlation of cell type specific scRNA and snATAC promoter accessibility (pseudo bulk reads from ATAC signal centered on TSS (+/− 3kb) for each gene). Log2 transformed data is represented as scatter plots and Pearson correlation coefficients are shown for each cell type. White lines represent missing gene counts from scRNA-seq dataset, which is most apparent in the low abundant Mast cells.
Extended Data Fig. 4
Coronary artery snATAC peak cell type and functional annotation. (a) Pie chart showing genomic annotations of the consensus set of coronary peaks across all cell types (n=323,767). Peaks were annotated using the ChIPseeker R/Bioconductor package (Yu et al. Bioinformatics 2015). (b) Pie chart of cell type annotation for peaks in the consensus peak set (n=323,767) according to ArchR (Granja et al. Nature Genetics 2021). Peaks were annotated with a cell type according to the group from which each peak originated according to ArchR’s iterative overlap procedure. (c) Functional enrichment analysis of cell type marker peaks using GREAT.
Extended Data Fig. 5
snATAC-seq co-accessibility and integration with scRNA-seq link putative regulatory elements to target promoters. (a) Genome browser tracks highlighting CAD-associated SNPs located within peaks linked to the VEGFA promoter peak through co-accessibility. Chromosome coordinates are hg38 genome build. (b) Genome browser tracks highlighting the intronic CAD SNP rs7500448 located in a smooth muscle cell peak in the CDH13 gene linked to the CDH13 promoter peak through co-accessibility. (c) Heatmap summary of ArchR Peak2Gene links (n=148,617) at 10 kb resolution where chromatin accessibility is highly correlated with target gene expression. Shown on the left are Z-scores for ATAC peak accessibility and on the right are Z-scores for RNA expression.
Extended Data Fig. 6
Additional CAD-associated variants that are coronary artery chromatin. accessibility QTLs (caQTLs). (a-b) Smooth muscle cell caQTL boxplots for variants at the BMP1 (rs73551705) and SMAD3 (rs17293632) CAD loci (n=40 unique individuals). (c) Macrophage caQTL boxplot for the rs72844419 variant at the GGCXCAD locus (n=39). Chromatin accessibility reads were normalized using variance stabilizing transformation (vst) in DESeq2. Boxplots represent the median and interquartile range (IQR), while the whisker represent up to 1.5 X IQR. (d-e) Comparison of effect size directions between smooth muscle cell caQTLs (5% FDR) and bulk coronary artery caQTLs (5% FDR), as visualized in scatter plot (d) and donut plot (e). For this analysis, 503 caQTL peaks are shared between both datasets (peaks with a corresponding significant caQTL variant). The rsID reported in the SMC caQTL results (n=40 individuals) was compared with the rsID reported in the bulk caQTL results (n=35 individuals). Two variants were considered to be in linkage disequilibrium (LD) if the r2 value between them was between 0.2 and 1 (in EUR population). If variants had an r2 value < 0.2 (in EUR population), the variants were considered to be in low LD (blue). For the caQTL effect size direction, we considered the RASQUAL Pi statistic. The RASQUAL Pi statistic can range from 0-1, where Pi < 0.5 reflects lower peak accessibility for the alternative allele and Pi > 0.5 reflects higher accessibility for the alternative allele. The effect sizes for linked variants go in the same direction (green) if the Pi values in SMCs and bulk coronary artery are both < 0.5 or both > 0.5. Linear regression line and Pearson correlation coefficient shown in (d).
Extended Data Fig. 7
Examples of candidate CAD functional variants within macrophage accessible chromatin. (a) CAD GWAS locus MAP1S/FCH01 on chromosome 19 depicting multiple genome-wide significant variants (above dashed line). Log normalized P-values determined by linear mixed models and adjusted for genome-wide multiple testing as described by van der Harst et al, Circulation 2018. Highlighted variant rs10418535 is located within a macrophage/immune cell ATAC peak as shown in the genome browser tracks. gkm-SVM importance scores show the predicted effects of the T allele to form a functional binding site, while the C allele (non-effect) is predicted to disrupt TF binding. (b) Genome browser view showing 95% credible CAD SNPs (blue), highlighting rs7296737 located within a strong macrophage marker peak in the first intron of SCARB1 on chr12. (c) Genome browser view highlighting top credible CAD SNP rs17680741 residing in macrophage marker peak in the second intron of TSPAN14 on chr10.
Extended Data Fig. 8
Co-accessibility and gene regulatory analyses prioritize transcriptional regulators TBX2 and PRDM16. (a) Genome browser track highlighting the association between CAD associated SNPs and SMC marker genes through co-accessibility (peak2gene) detected by snATAC-seq data (Methods). The red loops represent the association between TBX2 promoter and CAD associated SNPs. (b) Network visualization of TBX2 key driver target genes in STARNET atherosclerotic aortic root (AOR) tissue. (c) Clinical trait enrichment for PRDM16 module 28 in STARNET liver tissue. Pearson’s correlation p-values (gene-level) were aggregated for each co-expression module using a two-sided Fisher’s exact test. Case/control differential gene expression (DEG) enrichment was estimated by a hypergeometric test. (d) Network visualization of PRDM16 key driver target genes in STARNET mammary artery (MAM) and liver tissues.
Extended Data Fig. 9
Immunostaining of PRDM16 protein in coronary atherosclerosis sections. (a) Representative negative control (no primary antibody) immunofluoresence (IF) staining in human coronary artery - left anterior descending (LAD). Positive staining of rabbit anti-PRDM16 in vessels in control kidney tissues. Similar results were observed from n = 4 independent donor samples per tissue. Scale bar = 100 um. (b) Representative IF staining of PRDM16 and LMOD1 in atherosclerotic human coronary artery (LAD) segments from normal-Stage II, Stage III-IV, and Stage V-VI lesions based on Stary classification stages. Red = PRDM16 or LMOD1, Green = alpha smooth muscle actin (a-SMA) and blue = DAPI (nuclei). Scale bar = 1mm (whole slide) or 100 um (highlighted regions of interest). (c) Representative hematoxylin & eosin (H&E) and MOVAT histology staining of distinct human coronary artery segments with similar lesion stages as (b). Scale bar = 1mm. (b-c) Similar results were observed from n = 4 (Normal-stage II), n=6 (Stage III-IV), and n=6 (Stage V-VI) independent donor samples per group.
Figure 1.
Figure 1.. snATAC-seq profiling of 28,316 nuclei from human coronary arteries reveals cell type chromatin accessibility patterns across 41 individuals.
(a) snATAC-seq was performed on nuclei isolated from frozen human coronary artery samples taken from explanted hearts from 41 unique patients. Samples came from segments of either the left anterior descending coronary artery (LAD), left circumflex artery (LCX), or right coronary artery (RCA). After isolation using density gradient centrifugation, nuclei were transposed in bulk and mixed with barcoded gel beads and partitioning oil to generate gel beads in emulsions (GEMs). (b) Uniform manifold approximation and projection (UMAP) and clustering based on single-nucleus chromatin accessibility identifies 14 distinct coronary artery clusters. Each dot represents an individual cell colored by cluster assignment. (c) UMAP plot of Figure 1b colored by gene score for coronary artery cell type marker genes, including myocardin (MYOCD, smooth muscle cells), TCF21 (smooth muscle cells and fibroblasts), LUM (fibroblasts), CLDN5 (endothelial cells), CSF1R (macrophages), and TBX21 (T cells). (d) Heatmap representing the contingency table highlighting correspondence between snATAC-seq and scRNA-seq cell type assignments. (e) Distribution of cell types across all of the snATAC-seq samples, divided by whether or not the corresponding sample had an adventitial layer. Schematic in (a) was created using BioRender.
Figure 2.
Figure 2.. Human coronary artery cell types display distinct gene regulatory processes.
(a) Heatmap of coronary cell type marker genes (n=5,121) across each cell type calculated from snATAC-seq gene scores. Each column represents a unique marker gene. The color represents the normalized gene score of the marker genes in cell types. (b) Heatmap reflecting coronary cell type marker peaks that highlight cis-regulatory elements specific to only one or very limited cell types. Each column represents an individual marker peak. The color represents the normalized marker peak accessibility in cell types. (c) Heatmap of transcription factor motifs enriched in cell type marker peak sequences. The color represents the normalized motif enrichment score calculated in ArchR using HOMER with the hypergeometric test. (d) Representative motif occurrence plot for the CArG box motif. The CArG box motif, which binds myocardin and serum response factor, is highly enriched in smooth muscle cell accessible chromatin. (e) At the individual cell basis, accessible chromatin is highly enriched for the TCF21 motif in fibroblasts, smooth muscle cells, and pericytes. Transcription factor motif deviations (x-axis) were calculated for each cell using chromVAR. The TCF21 deviations for each cell were integrated based on the cell type (y-axis). (f) LD Score Regression (LDSC) reveals differing enrichment of GWAS SNPs for CAD, hypertension, and non-vascular phenotypes within coronary snATAC cell type peaks.
Figure 3.
Figure 3.. Sub-cluster analysis of smooth muscle cell accessible chromatin identifies fibromyocyte regulatory programs.
(a) snATAC UMAP for the 4 SMC clusters (C4-C7). The UMAP was colored by snATAC cluster (top) and by cell type labels assigned by scRNA-seq label transfer (bottom). Dashed lines demarcate boundary of cells with increased SMC marker gene scores (clusters C5 and C6), or decreased SMC marker gene scores (C4 and C7). Integrated snATAC/scRNA UMAP highlights both Fibromyocyte SMCs and traditional SMCs (demarcated by dashed lines and colors) within clusters 4-7. “Pericyte 1” and “Pericyte 2” labels from scRNA-seq were also mixed in clusters 4 and 5. (b) Quantification of imputed snATAC gene scores highlights higher chromatin accessibility at differentiated SMC marker genes MYH11 and CNN1 in clusters 5 and 6, and higher accessibility at modulated SMC/Fibromyocyte marker genes TNFRSF11B and FN1 in clusters 4 and 7. P-values were calculated using a one-sided Wilcoxon test. The exact P-values are as follows: MYH11: p=0; CNN1: p=0; TNFRSF11B: p=0; FN1: p=1.7e-260. The N values for nuclei in each cluster are as follows: C4: 6275; C7: 1971; C5: 6134; C6: 1988. (c) ChromVAR transcription factor motif enrichment for differentiated SMC CArG box in traditional SMC and enrichment for ATF3 and TCF21 motifs in modulated SMC/Fibromyocyte and Fibroblast clusters. The TEAD4 motif is enriched in both contractile and modulated SMCs. (d) Left, scatter plot overlay of SMC UMAP depicts the trajectory path from differentiated SMC to modulated SMC/Fibromyocyte sub-clusters (left). Motif enrichment heatmap shows the top enriched motifs across the trajectory pseudo-time (right). Values represent accessibility gene z-scores. (e) Volcano plot of differential peak analysis (subset to promoter peaks) comparing Fibromyocyte and traditional SMCs. Fibromyocyte and SMC annotated cells were defined based on RNA label transferring (Methods) and significant peaks determined by a Wilcoxon-test as implemented in ArchR. Peaks with significant differences at FDR <= 0.05 and Log2 fold change > 1 were colored light red (Fibromyocyte upregulated) and blue (Fibromyocyte downregulated). (f) Top enriched motifs within the total upregulated Fibromyocyte peaks (5,681) detected using HOMER de novo enrichment analysis with the hypergeometric distribution test. P-values shown are unadjusted for multiple comparisons. (g) Functional annotation of Fibromyocyte upregulated (light red) and downregulated (blue) peaks conducted using GREAT with the binomial distribution test. Top enriched biological processes functional terms are listed. P-values shown are unadjusted for multiple comparisons.
Figure 4.
Figure 4.. Single-nucleus chromatin accessibility further resolves mechanisms for functional CAD GWAS loci.
(a) To prioritize candidate CAD-associated GWAS variants we used a multi-tiered strategy, first by taking variants in moderate to high linkage disequilibrium (LD) with the reported lead variants (r2 >= 0.8). We next prioritized variants overlapping snATAC peaks and narrowed down the cell type(s) whereby these variants are potentially functioning. Finally we determined whether candidate variants are within transcription factor motifs and linked to target genes through co-accessibility and links to gene expression through scRNA-seq integration (Peak2Gene). (b) Overlap of LD-expanded (r2 >=0.8; EUR) CAD GWAS variants (+/− 50 bp) with coronary artery cell type peaks (both from the total peak set and marker peaks). LD-expanded SNPs were obtained from two recent CAD GWAS studies (van der Harst et al. 2018 and Koyama et al. 2020) that performed trans-ancestry meta-analysis. (c) Examples of the benefits of snATAC for pinpointing cell types whereby candidate CAD regulatory variants are acting. Highlighted are candidate functional variants at the 9p21 (CDKN2B-AS1/ANRIL), TARID/TCF21, NOS3, KIAA1462/JCAD, CDH13, COL4A2, and PHACTR1 loci. (d) Heatmap showing number of peaks per cell type overlapping CAD GWAS variants for 100 of the CAD loci (van der Harst et al. Circulation Research 2018). Full overlaps of CAD GWAS variants with snATAC peaks are provided in Supplementary Data 5. Schematic in (a) was created using BioRender.
Figure 5.
Figure 5.. Identification of genetic variants that regulate chromatin accessibility within coronary artery cell types.
(a) The number of chromatin accessibility quantitative trait loci (caQTLs) identified using RASQUAL (at 10%, 5%, and 1% FDR cutoffs) within a cell type is proportional to the number of annotated cells. The color represents the cell type and shape represents the FDR cutoff. (b) UpSet plot for smooth muscle cells caQTLs that are expression quantitative trait loci in GTEx arterial tissues. Bars represent the intersection size for overlap of eQTLs between coronary artery, aorta, and tibial artery. (c) Comparison of RASQUAL effect sizes with GTEx effect sizes (beta). (d) Boxplots highlighting smooth muscle cell (n=40) normalized accessibility for MEF2D and MRAS caQTL variants and (e) macrophage (n=39) normalized accessibility for FCHO1 and MARCO caQTL variants. Vst: variance stabilizing transformation. The q-values represent the lead caQTL SNP q-value (Benjamini-Hochberg correction) generated from the likelihood-ratio test for the respective peak in RASQUAL. Boxplots (d-e) represent the median and interquartile range (IQR), with upper (75%) and lower (25%) quartiles shown and each dot representing a separate individual. (f) Example genome browser tracks showing CAD-associated caQTL at the MRAS locus in a smooth muscle cell specific peak. The T allele for rs13324341 creates a MEF2 putative binding site. (g) In GTEx artery (aorta shown here, n=387 unique individuals) the T allele for rs13324341 is highly associated with increased MRAS mRNA levels. The cis-eQTL p-value is shown from the GTEx pipeline that performs linear regression between genotype and normalized gene expression levels. Boxplot (black) within the violin plot includes median (white line) and IQR from 25% to 75%. (h) Example of prioritization of functional CAD variants using lsgkm machine learning based prediction. The rs13202496 variant at the LIPA locus (chromosome 10) resides in a strong macrophage peak. The T allele is predicted to create a putative SPIB binding site and increased chromatin accessibility. Feature importance score tracks for effect and non-effect alleles are visualized by gkmExplain (Methods).
Figure 6.
Figure 6.. PRDM16 is a CAD-associated key driver transcriptional regulator in SMCs.
(a) Genome browser track highlighting the association between CAD associated SNPs and SMC marker genes through co-accessibility (peak2gene) detected by snATAC-seq data (Methods). The red loops represent the association between PRDM16 promoter and CAD associated SNPs. (b) Correlation coefficients of snATAC/scRNA integration scores gene expression levels between LMOD1 and genome-wide coding genes in SMCs. Genes were ranked by Pearson’s correlation coefficient with LMOD1. Representative positive and negative correlated SMC gene names are labeled. (c) Clinical trait enrichment for PRDM16 containing module in subclinical mammary artery in STARNET gene regulatory network datasets. Pearson’s correlation p-values (gene-level) were aggregated for each co-expression module using a two-sided Fisher’s exact test. Case/control differential gene expression (DEG) enrichment was estimated by a hypergeometric test. (d) Movat pentachrome staining and PRDM16 (red) and alpha-smooth muscle actin (a-SMA) (green) immunofluorescence staining of atherosclerotic human coronary artery segments - left anterior descending (LAD) from normal-Stage I, Stage III-IV, and Stage V-VI lesions based on Stary classification stages. Whole slide images captured from 20x confocal microscopy stitched tiles. PRDM16/a-SMA co-staining (see arrows) depicted in yellow from merged images. DAPI (blue) marks nuclei. n = 4 per group. Scale bar = 1 mm, except for region of interest (ROI): scale bar = 100 μm.

Similar articles

Cited by

  • Multi-ancestry genome-wide study identifies effector genes and druggable pathways for coronary artery calcification.
    Kavousi M, Bos MM, Barnes HJ, Lino Cardenas CL, Wong D, Lu H, Hodonsky CJ, Landsmeer LPL, Turner AW, Kho M, Hasbani NR, de Vries PS, Bowden DW, Chopade S, Deelen J, Benavente ED, Guo X, Hofer E, Hwang SJ, Lutz SM, Lyytikäinen LP, Slenders L, Smith AV, Stanislawski MA, van Setten J, Wong Q, Yanek LR, Becker DM, Beekman M, Budoff MJ, Feitosa MF, Finan C, Hilliard AT, Kardia SLR, Kovacic JC, Kral BG, Langefeld CD, Launer LJ, Malik S, Hoesein FAAM, Mokry M, Schmidt R, Smith JA, Taylor KD, Terry JG, van der Grond J, van Meurs J, Vliegenthart R, Xu J, Young KA, Zilhão NR, Zweiker R, Assimes TL, Becker LC, Bos D, Carr JJ, Cupples LA, de Kleijn DPV, de Winther M, den Ruijter HM, Fornage M, Freedman BI, Gudnason V, Hingorani AD, Hokanson JE, Ikram MA, Išgum I, Jacobs DR Jr, Kähönen M, Lange LA, Lehtimäki T, Pasterkamp G, Raitakari OT, Schmidt H, Slagboom PE, Uitterlinden AG, Vernooij MW, Bis JC, Franceschini N, Psaty BM, Post WS, Rotter JI, Björkegren JLM, O'Donnell CJ, Bielak LF, Peyser PA, Malhotra R, van der Laan SW, Miller CL. Kavousi M, et al. Nat Genet. 2023 Oct;55(10):1651-1664. doi: 10.1038/s41588-023-01518-4. Epub 2023 Sep 28. Nat Genet. 2023. PMID: 37770635 Free PMC article.
  • Secreted Protein Profiling of Human Aortic Smooth Muscle Cells Identifies Vascular Disease Associations.
    Aherrahrou R, Baig F, Theofilatos K, Lue D, Beele A, Örd T, Kaikkonen MU, Aherrahrou Z, Cheng Q, Ghosh SKB, Karnewar S, Karnewar V, Finn AV, Owens GK, Joner M, Mayr M, Civelek M. Aherrahrou R, et al. Arterioscler Thromb Vasc Biol. 2024 Apr;44(4):898-914. doi: 10.1161/ATVBAHA.123.320274. Epub 2024 Feb 8. Arterioscler Thromb Vasc Biol. 2024. PMID: 38328934 Free PMC article.
  • PRDM16 controls smooth muscle cell fate in atherosclerosis.
    Tan JME, Cheng L, Calhoun RP, Weller AH, Drareni K, Fong S, Barbara E, Lim HW, Xue C, Winter H, Auguste G, Miller CL, Reilly MP, Maegdefessel L, Lutgens E, Seale P. Tan JME, et al. bioRxiv [Preprint]. 2025 Feb 23:2025.02.19.639186. doi: 10.1101/2025.02.19.639186. bioRxiv. 2025. PMID: 40027729 Free PMC article. Preprint.
  • Single-cell RNA sequencing reveals sex differences in the subcellular composition and associated gene-regulatory network activity of human carotid plaques.
    Sukhavasi K, Mocci G, Ma L, Hodonsky CJ, Diez Benevante E, Muhl L, Liu J, Gustafsson S, Buyandelger B, Koplev S, Lendahl U, Vanlandewijck M, Singha P, Örd T, Beter M, Selvarajan I, Laakkonen JP, Väli M, den Ruijter HM, Civelek M, Hao K, Ruusalepp A, Betsholtz C, Järve H, Kovacic JC, Miller CL, Romanoski C, Kaikkonen MU, Björkegren JLM. Sukhavasi K, et al. Nat Cardiovasc Res. 2025 Apr;4(4):412-432. doi: 10.1038/s44161-025-00628-y. Epub 2025 Apr 10. Nat Cardiovasc Res. 2025. PMID: 40211055 Free PMC article.
  • INKILN is a Novel Long Noncoding RNA Promoting Vascular Smooth Muscle Inflammation via Scaffolding MKL1 and USP10.
    Zhang W, Zhao J, Deng L, Ishimwe N, Pauli J, Wu W, Shan S, Kempf W, Ballantyne MD, Kim D, Lyu Q, Bennett M, Rodor J, Turner AW, Lu YW, Gao P, Choi M, Warthi G, Kim HW, Barroso MM, Bryant WB, Miller CL, Weintraub NL, Maegdefessel L, Miano JM, Baker AH, Long X. Zhang W, et al. Circulation. 2023 Jul 4;148(1):47-67. doi: 10.1161/CIRCULATIONAHA.123.063760. Epub 2023 May 18. Circulation. 2023. PMID: 37199168 Free PMC article.

References

    1. Libby P Inflammation in atherosclerosis. Nature 420, 868–874 (2002). - PubMed
    1. Souilhol C, Harmsen MC, Evans PC & Krenning G Endothelial-mesenchymal transition in atherosclerosis. Cardiovasc. Res 114, 565–577 (2018). - PubMed
    1. Stary HC et al. A definition of advanced types of atherosclerotic lesions and a histological classification of atherosclerosis. A report from the Committee on Vascular Lesions of the Council on Arteriosclerosis, American Heart Association. Circulation 92, 1355–1374 (1995). - PubMed
    1. Winkels H et al. Atlas of the Immune Cell Repertoire in Mouse Atherosclerosis Defined by Single-Cell RNA-Sequencing and Mass Cytometry. Circ. Res 122, 1675–1688 (2018). - PMC - PubMed
    1. Cochain C et al. Single-Cell RNA-Seq Reveals the Transcriptional Landscape and Heterogeneity of Aortic Macrophages in Murine Atherosclerosis. Circ. Res 122, 1661–1674 (2018). - PubMed

Methods references

    1. Stuart T et al. Comprehensive Integration of Single-Cell Data. Cell 177, 1888–1902.e21 (2019). - PMC - PubMed
    1. Korsunsky I et al. Fast, sensitive and accurate integration of single-cell data with Harmony. Nat. Methods 16, 1289–1296 (2019). - PMC - PubMed
    1. McLean CY et al. GREAT improves functional interpretation of cis-regulatory regions. Nat. Biotechnol 28, 495–501 (2010). - PMC - PubMed
    1. Phanstiel DH, Boyle AP, Araya CL & Snyder MP Sushi.R: flexible, quantitative and integrative genomic visualizations for publication-quality multi-panel figures. Bioinformatics 30, 2808–2810 (2014). - PMC - PubMed
    1. Franceschini N et al. GWAS and colocalization analyses implicate carotid intima-media thickness and carotid plaque loci in cardiovascular outcomes. Nat. Commun 9, 5141 (2018). - PMC - PubMed

Publication types

MeSH terms