. 2023 Apr;201(4):1846-1863.
doi: 10.1007/s12011-022-03286-4. Epub 2022 May 19.

Candesartan Protects Against Cadmium-Induced Hepatorenal Syndrome by Affecting Nrf2, NF-κB, Bax/Bcl-2/Cyt-C, and Ang II/Ang 1-7 Signals

Affiliations

Candesartan Protects Against Cadmium-Induced Hepatorenal Syndrome by Affecting Nrf2, NF-κB, Bax/Bcl-2/Cyt-C, and Ang II/Ang 1-7 Signals

Esam O Kamel et al. Biol Trace Elem Res. 2023 Apr.

Retraction in

Abstract

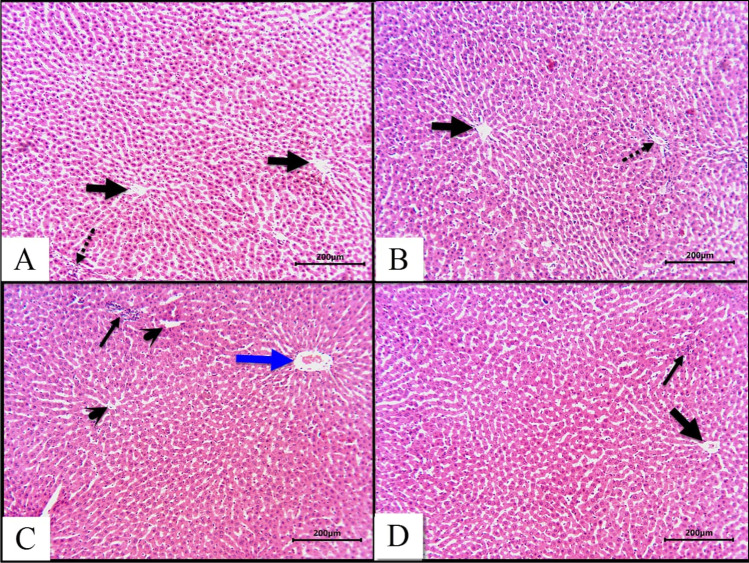
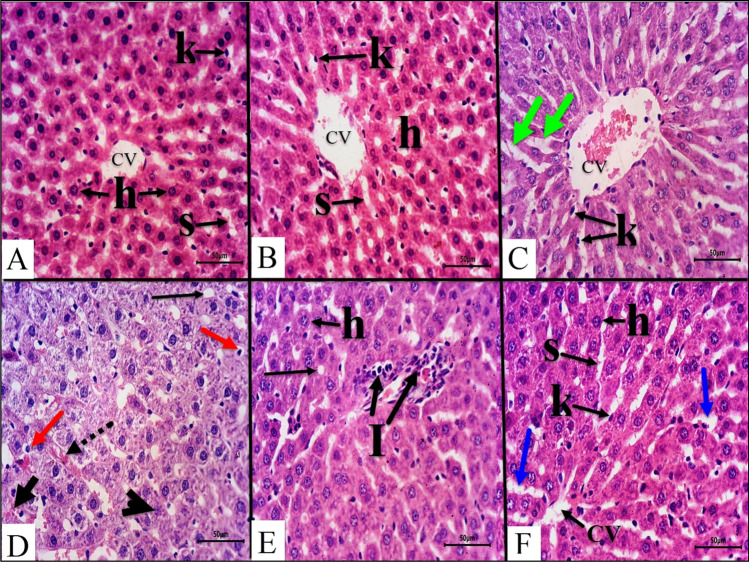
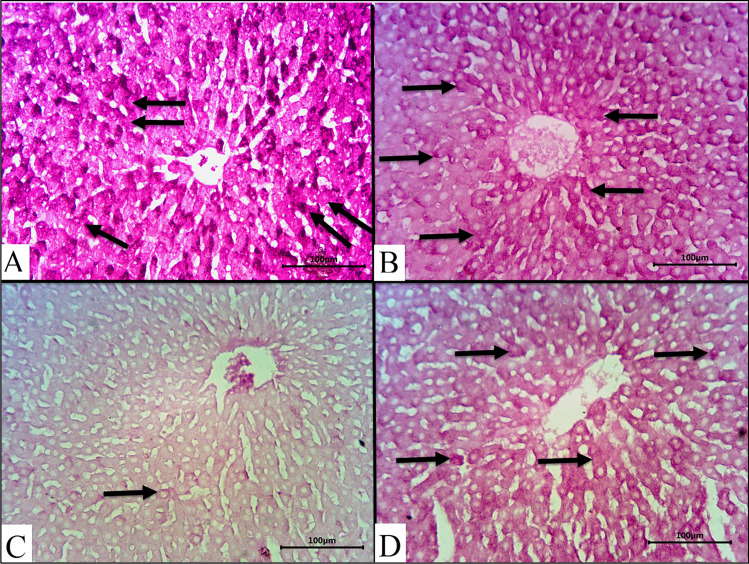
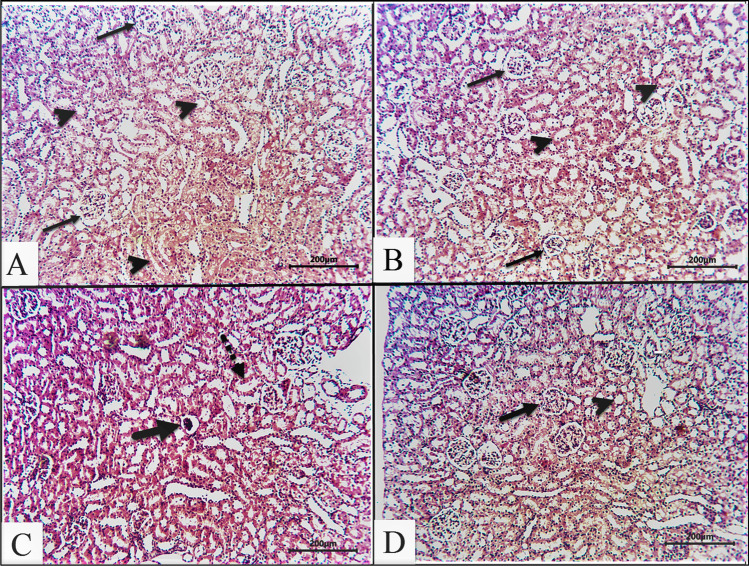
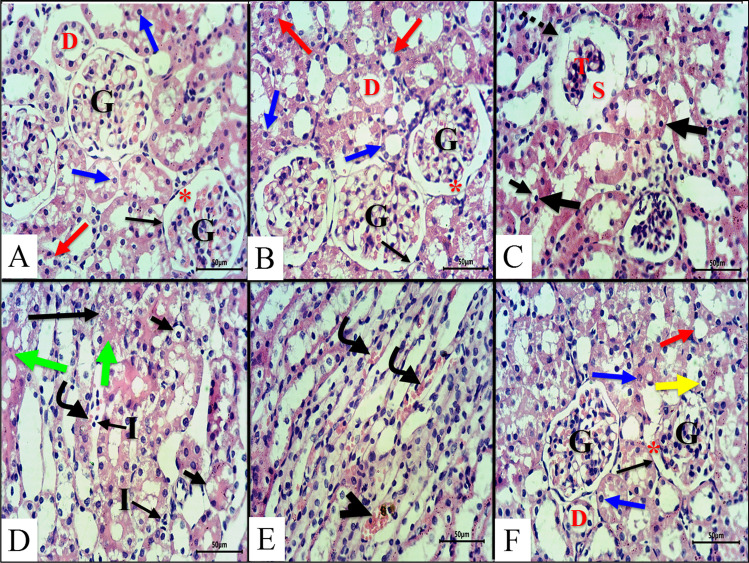
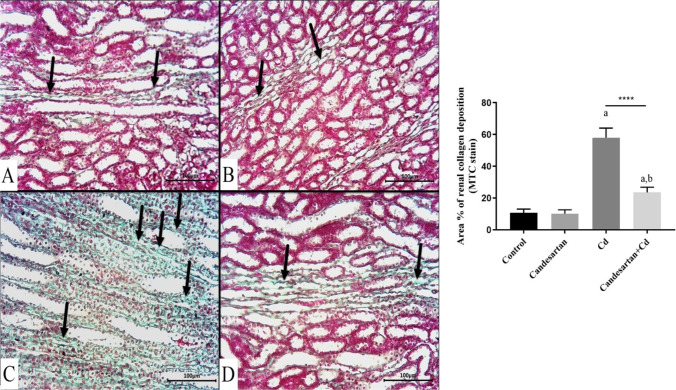
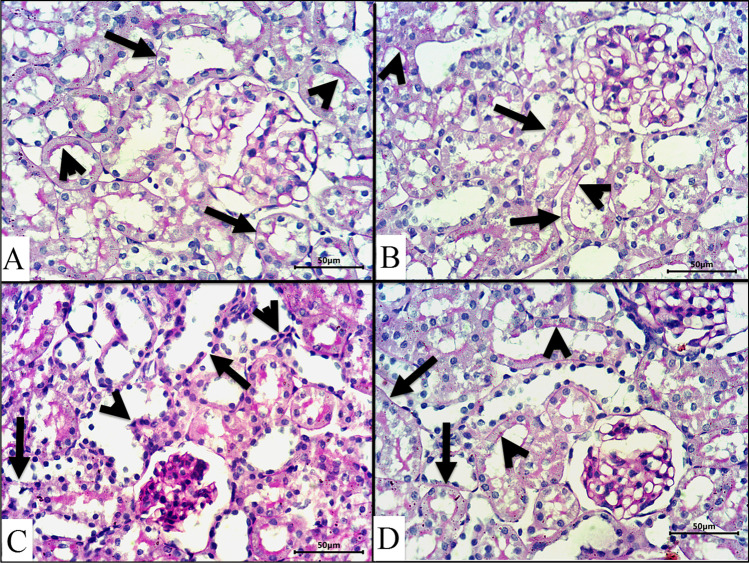
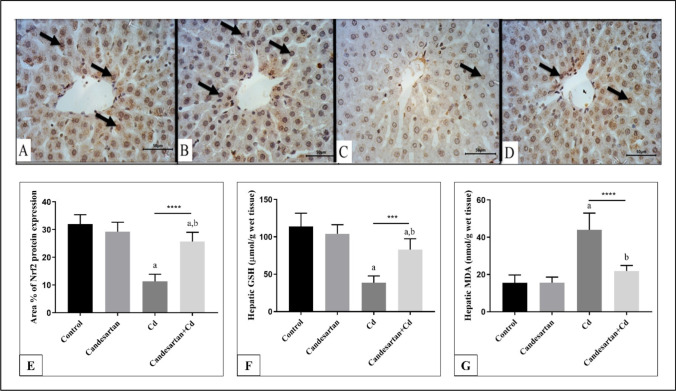
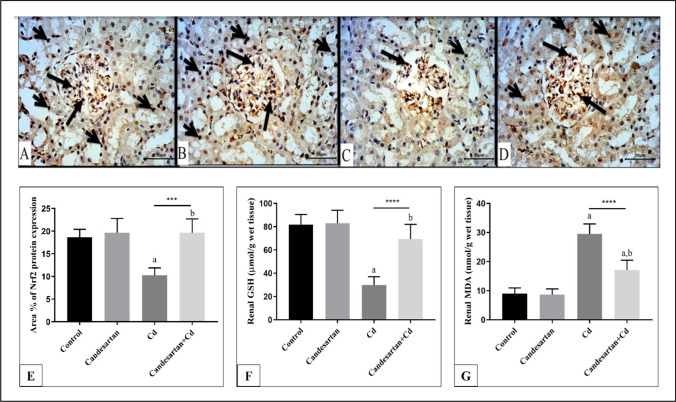
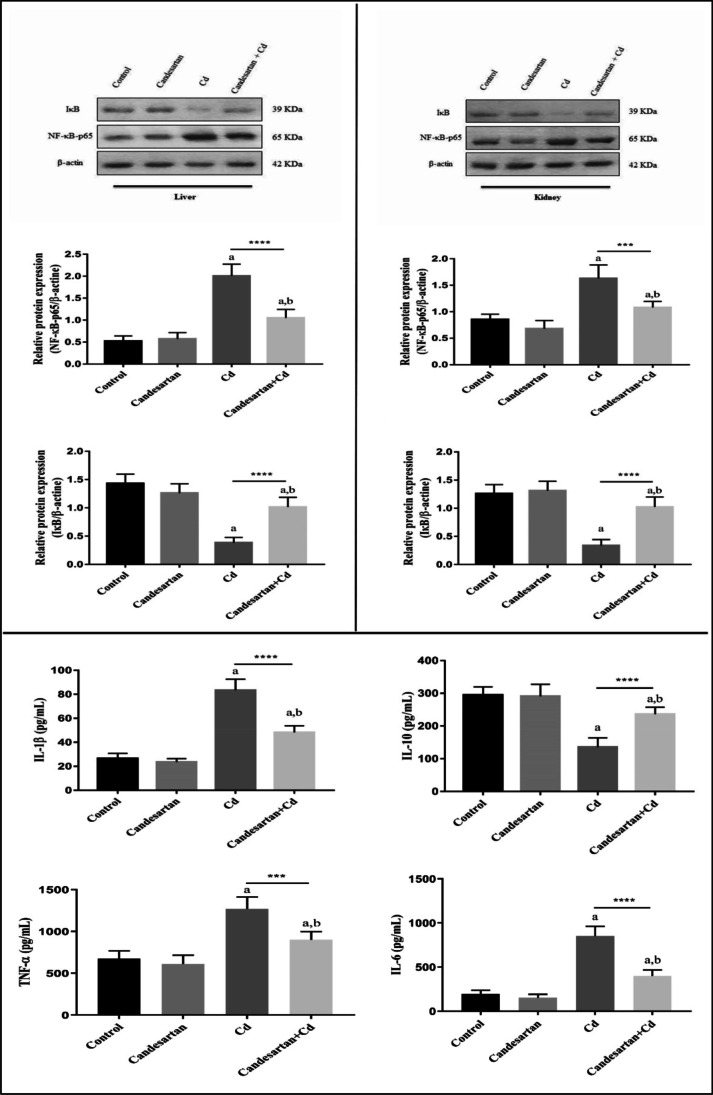
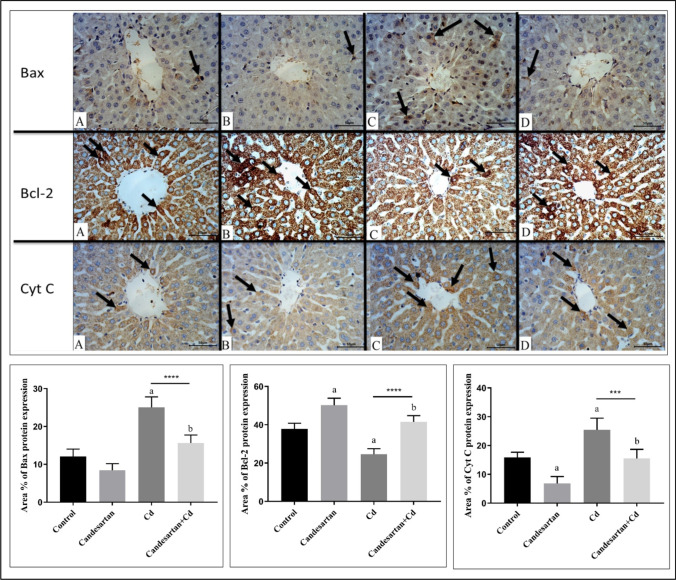
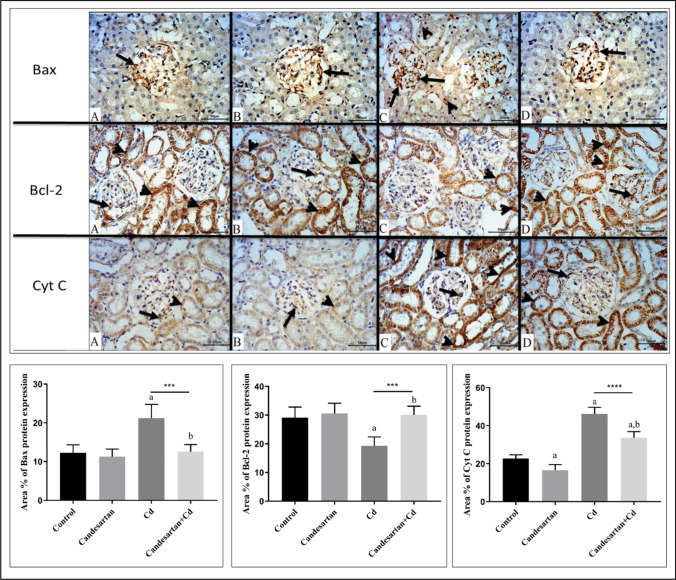
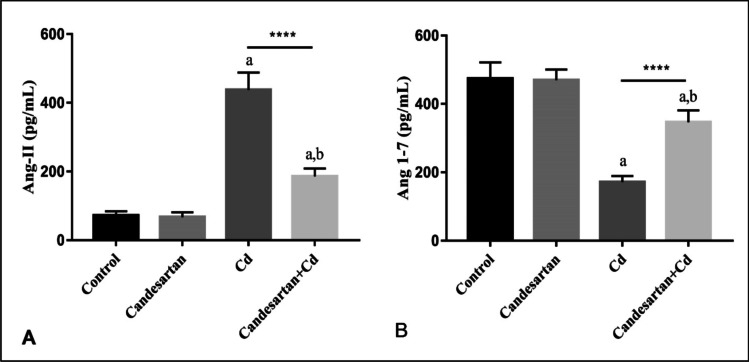
Cadmium (Cd) is a serious pollutant in the environment. Candesartan is an angiotensin II (Ang II) receptor antagonist with promising diverse health benefits. The current study is planned to investigate the hepatorenal protective effects of candesartan against Cd-induced hepatic and renal intoxication. Our results demonstrated that candesartan effectively attenuated Cd-induced hepatorenal intoxication, as evidenced by improving hepatic and renal function biomarkers. Besides, candesartan reversed hepatic and renal histopathological abrasions induced by Cd toxicity. Candesartan antioxidant effect was mediated by Nrf2 activation. Also, candesartan suppressed hepatorenal inflammation by modulating NF-κB/IκB. Moreover, candesartan attenuated Cd hepatorenal apoptosis by upregulating Bcl-2 and downregulating Bax and Cyt-C proteins. Interestingly, these effects are suggested to be an outcome of modulating of Ang II/Ang 1-7 signal. Overall, our findings revealed that candesartan could attenuate Cd-induced hepatorenal intoxication through modulation of Nrf2, NF-κB/IκB, Bax/Bcl-2/Cyt-c, and Ang II/Ang 1-7 signaling pathways.

Keywords: Ang II/Ang 1–7; Bax/Bcl-2/Cyt-C; Cadmium; Candesartan; NF-κB; Nrf2.


Conflict of interest statement

The authors declare no competing interests.

Figures

Fig. 1
Fig. 1
Photomicrographs of hematoxylin & eosin–stained liver sections. Representative sections from control (A) and candesartan-treated (B) rats show normal hepatic morphological structure. The hepatic lobules have centrally located central veins (thick black arrows), normally looked hepatocytes forming hepatic cords separated by hepatic sinusoids. The portal area (dotted arrows) is located peripherally. In Cd-treated rats (C), the central vein (blue arrow) is apparently dilated and congested, many hepatic sinusoids (short arrows) are dilated, and area of inflammatory cell infiltration (thin arrow) is noticed. Liver section from Cd group treated with candesartan (D) showing normally located central vein (thick black arrow) and small area of few inflammatory cell infiltration (thin arrow). Scale bar = 200 µm
Fig. 2
Fig. 2
Highly magnified photomicrographs of hematoxylin & eosin–stained liver sections. Sections from control (A) and candesartan-treated (B) rats show normal hepatic structure. The hepatic cords are radiating from the central vein (CV) and are formed of hepatocytes (h) with acidophilic cytoplasm and vesicular rounded nuclei. The hepatic sinusoids (S) and Kupffer cells (k) look normal. Sections from Cd-treated rats (CE) showing in C, dilated congested central vein (CV) dilated hepatic sinusoids (green arrows) and many Kupffer cells (k). In D, the hepatic sinusoids are dilated and congested (dotted arrow) and areas of petechial hemorrhage (short arrow) can be seen. The hepatocytes lose their normal architecture where they have vacuolated cytoplasm (thin arrow) pyknotic nuclei (red arrows) and completely destructed nuclei (arrowhead). In E, the hepatocytes have rounded nuclei (h) but many hepatocytes with vacuolated cytoplasm (thin arrow) can be observed. An area of marked inflammatory cell infiltration (I) can be seen. Treating the Cd rats with candesartan (F) restored most of the liver structural morphology; hepatocytes (h) with rounded vesicular nuclei, Kupffer cells (k) and normally looking central vein (CV) and hepatic sinusoids (S). Few hepatic sinusoids are still dilated (blue arrows). Scale bar = 50 µm
Fig. 3
Fig. 3
Photomicrographs of Masson’s trichrome–stained liver sections for demonstrating collagen fibers presented by green color. Representative sections from control (A) and candesartan-treated (B) rats show minimal collagen fibers around the central vein (arrowhead) and in between the liver cells (arrows). Section from Cd-treated rats (C) shows increased deposition of collagen fibers around central vein (arrowhead) and in between hepatocytes (arrows). In rats treated with Cd and candesartan (D), the distribution of collagen fibers nearly restored to the normal. Scale bar = 100 µm. Quantification was done using ImageJ software and the results were expressed as mean ± S.E. (n = 8). Analysis of data was statically performed using one-way ANOVA. aP < 0.05 vs. control group. bP < 0.05 vs. Cd control group
Fig. 4
Fig. 4
Photomicrographs of PAS-stained liver sections to demonstrate glycogen storing in hepatocytes. Representative sections from control (A) and candesartan-treated (B) rats show strong PAS reaction for glycogen inclusions in the cytoplasm of hepatocytes (arrows). Cd administration (C) shows depletion of the intensity of PAS reaction for glycogen in the cytoplasm of hepatocytes (arrows). Administration of candesartan after Cd toxicity (D) restored the PAS reaction near the normal (arrows). Scale bar = 100 µm
Fig. 5
Fig. 5
Photomicrographs of hematoxylin & eosin–stained kidney sections. Representative sections from control (A) and candesartan-treated (B) rats show normal renal corpuscles (thin arrows) and tubules (arrow heads). Section from Cd-treated (C) rats shows glomerular atrophy (thick arrow) and widening of many renal tubules (dotted arrow). Administration of candesartan after Cd toxicity (D) improved the renal morphology near the normal. Scale bar = 200 µm
Fig. 6
Fig. 6
Highly magnified photomicrographs of the renal cortex stained with hematoxylin & eosin. Sections from control (A) and candesartan-treated (B) rats demonstrating normally looked renal corpuscles formed of glomerular tuft (G) that is separated from the Bowman’s capsule (thin arrow) by urinary space (star). The proximal convoluted tubules have narrow lumen (red arrows) while the distal tubules have wider lumen (D) and the nuclei of the lining epithelium of both types of tubules are rounded (blue arrows). CE Kidney sections from Cd-treated rats showing in C, degeneration and atrophy of glomerular tuft (T) and wide urinary space (S) with Bowman’s capsule disruption (dotted arrow). The renal tubules show pyknotic nuclei (thick arrows in C) vacuolation of the cytoplasm of some lining cells (short arrows in C and D), complete disintegration of the cytoplasm of other cells (long arrow in D), and deposition of acidophilic material in the tubular lumen (green arrow). Few scattered inflammatory cells (I in D) are found in the renal interstitium with many areas of petechial hemorrhage (curved arrows in D and E) and congested blood vessels (arrowhead in E). Kidney tissue from Cd + candesartan rats (F) reported an improvement in renal corpuscles and tubules, but few tubular cells have vacuolated cytoplasm and darkly stained nucleus (yellow arrow). Scale bar = 50 µm
Fig. 7
Fig. 7
Photomicrographs of Masson’s trichrome–stained kidney sections for demonstrating collagen fibers presented by green color. Representative sections from control (A) and candesartan-treated (B) rats show minimal collagen fibers in between the kidney tubules (arrows). Section from Cd-treated rats (C) shows increased deposition of collagen fibers around the tubules (arrows). In contrast, rats treated with Cd and candesartan (D) show a decrease in deposition of collagen fibers (arrows) around kidney tubules in comparison to Cd-treated rats. Scale bar = 100 µm. Quantification was done using ImageJ software and the results were expressed as mean ± S.E. (n = 8). Analysis of data was statically performed using one-way ANOVA. aP < 0.05 vs. control group. bP < 0.05 vs. Cd control group
Fig. 8
Fig. 8
Micrographs of PAS-stained renal cortical sections. Representative sections from control (A) and candesartan-treated (B) animals show kidney tubules resting on continuous basement membrane (arrows) and having intact brush border (arrow heads). Section from Cd-treated rats (C) shows a breakdown of the basement membrane (arrows) and brush border loss (arrow heads). Section from Cd + candesartan rats (D) show restoration of both basement membrane (arrows) and brush border (arrow heads) compared to the Cd-treated animals. Scale bar = 100 µm
Fig. 9
Fig. 9
Effect of candesartan on Cd-induced hepatic oxidative injury. Cd-intoxicated rats exhibited a marked elevation in MDA content, while the content of reduced GSH significantly decreased in rats’ livers. Conversely, candesartan administration remarkably decreased hepatic content of MDA, while it raised the GSH contents when compared to Cd-intoxicated rats. Immunohistochemical localization of Nrf2 in hepatic tissue is examined and the positive expression is represented by the brown color (arrows). Representative figures from control (A), candesartan-treated (B), Cd-treated (C), and Cd + candesartan-treated (D) animals. Sections from control (A) as well as candesartan-treated (B) rats show intense expression of Nrf2 in hepatocytes. In Cd-treated rats (C), the Nrf2 immunostaining is depleted in hepatic tissue, while treating the Cd-treated rats with candesartan (D) markedly improved the Nrf2 depletion in hepatocytes. Scale bar = 50 μm. Quantification was done using ImageJ software and the results were expressed as mean ± S.E. (n = 8). Analysis of data was statically performed using one-way ANOVA. aP < 0.05 vs. control group. bP < 0.05 vs. Cd control group
Fig. 10
Fig. 10
Effect of candesartan on Cd-induced renal oxidative injury. Cd-intoxicated rats exhibited a marked elevation in renal MD content, while the content of renal reduced GSH significantly decreased. Conversely, candesartan administration remarkably decreased renal content of MDA, while it raised the GSH contents when compared to Cd-intoxicated rats. Immunohistochemical localization of Nrf2 expression in kidney tissues presented by brown color. Kidney sections from control (A) and candesartan-treated (B) rats show strong expression of Nrf2 immunostaining in renal tubules (arrowheads) and weak glomeruli (arrows). In contrast, Cd-treated rats (C) show a decrease in Nrf2 expression in renal tubules (arrowheads) and glomeruli (arrows). On the other hand, treating the Cd rats with candesartan (D) increased the expression of Nrf2 in renal tubules (arrowheads) and glomeruli (arrows). Scale bars = 50 μm. Quantification was done using ImageJ software and the results were expressed as mean ± S.E. (n = 8). Analysis of data was statically performed using one-way ANOVA. aP < 0.05 vs. control group. bP < 0.05 vs. Cd control group
Fig. 11
Fig. 11
Effect of candesartan on Cd-induced hepatic and renal inflammation. Hepatic and renal levels of NF-κB and IκB were assessed by Western blotting, while the levels of IL-1β and IL-10 were determined by ELISA. Cd injection resulted in downregulation in IκB levels as well as IL-10 levels and upregulation in the NF-κB and IL-1β. Candesartan counteracted these effects effectively in comparison with Cd-intoxicated rats. The results were expressed as mean ± S.E. (n = 8). Analysis of data was statically performed using one-way ANOVA. aP < 0.05 vs. control group. bP < 0.05 vs. Cd control group
Fig. 12
Fig. 12
Effect of candesartan on Cd-induced hepatic apoptosis. Hepatic levels of Bax, Bcl-2, and Cyt-C were assessed by IHC. Immunohistochemical localization of Bax expression in hepatic tissues presented by brown color. Representative sections from control (A), candesartan-treated (B), Cd-treated (C), and Cd + candesartan-treated (D) animals. Sections from control (A) as well as candesartan-treated (B) rats show weak Bax expression in hepatocytes (arrows). In contrast, Cd-treated rats (C) show increased expression of Bax immunostaining in hepatocytes (arrows) compared to control rats. On treating the Cd rats with candesartan (D), the hepatocytes show weak expression of Bax immunostaining (arrows). Scale bars = 50 μm. Immunohistochemical expression Bcl-2 in hepatic tissues. Representative figures from control (A), candesartan-treated (B), Cd-treated (C), and Cd + candesartan-treated (D) animals. Intense expression of Bcl-2 is shown in the hepatocytes (arrows) of control (A) and candesartan-treated (B) rats. C shows decrease in Bcl-2 immunostaining (arrows) in Cd-treated animals. In contrast, arrows in D show intense Bcl-2 immunostaining in the hepatocytes of Cd + candesartan-treated rats compared to Cd-treated rats. Scale bar = 50 µm. Immunohistochemical localization of Cyt-C expression in liver tissues presented by brown color. Representative sections from control (A), candesartan-treated (B), Cd-treated (C), and Cd + candesartan-treated (D) animals. Sections from control (A) and candesartan-treated (B) rats show minimal expression of Cyt-C immunostaining in hepatocytes (arrows). In contrast, Cd-treated rats (C) show intense expression of Cyt-C immunostaining (arrows). On treating the Cd rats with candesartan (D), the expression of Cyt-C immunostaining is reversed (arrows) compared to Cd-treated rats. Scale bars = 50 μm. Quantification was done using ImageJ software and the results were expressed as mean ± S.E. (n = 8). Analysis of data was statically performed using one-way ANOVA. aP < 0.05 vs. control group. bP < 0.05 vs. Cd control group
Fig. 13
Fig. 13
Effect of candesartan on Cd-induced renal apoptosis. Renal levels of Bax, Bcl-2, and Cyt-C were assessed by IHC. Immunohistochemical localization of Bax expression in kidney tissues presented by brown color. Representative figures from control (A), candesartan-treated (B), Cd-treated (C), and Cd + candesartan-treated (D) animals. Kidney sections from control (A) and candesartan-treated (B) rats show negative Bax expression in renal tubules and weak Bax immunostaining in renal glomeruli (arrows). In contrast, Cd-treated rats (C) show minimal Bax expression in renal tubules (arrowheads) and slight increase of expression in glomeruli (arrows). On treating the Cd rats with candesartan (D), the renal tubules show negative Bax immunostaining (arrowheads), and the glomerular expression of Bax is decreased (arrows). Immunohistochemical localization of Bcl-2 expression in kidney tissues presented by brown color. Kidney sections from control (A) and candesartan-treated (B) rats show strong expression of Bcl-2 immunostaining in renal tubules (arrowheads) and weak immunostaining in glomeruli (arrows). In contrast, Cd-treated rats (C) show decrease of Bcl-2 expression in renal tubules (arrowheads) and negative Bcl-2 expression in glomeruli. On the other hand, treating the Cd rats with candesartan (D) increased the expression of Bcl-2 in renal tubules (arrowheads) and glomeruli (arrows). Immunohistochemical localization of Cyt-C expression in kidney tissues presented by brown color. Representative sections from control (A), candesartan-treated (B), Cd-treated (C), and Cd + candesartan-treated (D) animals. Kidney sections from control (A) and candesartan-treated (B) rats show weak expression of Cyt-C immunostaining in renal tubules (arrowheads) and glomeruli (arrows). In contrast, Cd-treated rats (C) show intense Cyt-C expression in renal tubules (arrowheads) and weak expression in glomeruli (arrows). On treating the Cd rats with candesartan (D), the expression of Cyt-C immunostaining is slightly decreased in renal tubules (arrowheads) and glomeruli (arrows). Scale bars = 50 μm. Quantification was done using ImageJ software and the results were expressed as mean ± S.E. (n = 8). Analysis of data was statically performed using one-way ANOVA. aP < 0.05 vs. control group. bP < 0.05 vs. Cd control group
Fig. 14
Fig. 14
Effect of candesartan on Ang II and Ang 1–7 in Cd-intoxicated rats. Cd intoxication caused an increase in the Ang II level, while the level of Ang 1–7 markedly decreased when compared to normal animals. Conversely, candesartan administration resulted in marked downregulation of Ang II while it restored the Ang 1–7 potently with respect Cd-intoxicated rats. The results were expressed as mean ± S.E. (n = 8). Analysis of data was statically performed using one-way ANOVA. aP < 0.05 vs. control group. bP < 0.05 vs. Cd control group

Similar articles

Cited by

References

    1. Genchi G, Sinicropi MS, Lauria G, Carocci A, Catalano A (2020) The effects of cadmium toxicity. Int J Environ Res Public Health. 17(11). 10.3390/ijerph17113782 - PMC - PubMed
    1. Satarug S, Garrett SH, Sens MA, Sens DA (2010) Cadmium, environmental exposure, and health outcomes. Environ Health Perspect 118(2):182–190. 10.1289/ehp.0901234 10.1289/ehp.0901234 - DOI - PMC - PubMed
    1. Buchet JP, Lauwerys R, Roels H, Bernard A, Bruaux P, Claeys F et al (1990) Renal effects of cadmium body burden of the general population. Lancet (London England) 336(8717):699–702. 10.1016/0140-6736(90)92201-r 10.1016/0140-6736(90)92201-r - DOI - PubMed
    1. Stohs SJ, Bagchi D (1995) Oxidative mechanisms in the toxicity of metal ions. Free Radical Biol Med 18(2):321–336. 10.1016/0891-5849(94)00159-h 10.1016/0891-5849(94)00159-h - DOI - PubMed
    1. Rani A, Kumar A, Lal A, Pant M (2014) Cellular mechanisms of cadmium-induced toxicity: a review. Int J Environ Health Res 24(4):378–399. 10.1080/09603123.2013.835032 10.1080/09603123.2013.835032 - DOI - PubMed

Publication types