. 2022 May 19;41(1):178.
doi: 10.1186/s13046-022-02384-4.

The DNA/RNA helicase DHX9 contributes to the transcriptional program of the androgen receptor in prostate cancer

Affiliations

The DNA/RNA helicase DHX9 contributes to the transcriptional program of the androgen receptor in prostate cancer

Lidia Chellini et al. J Exp Clin Cancer Res. .

Abstract

Background: Prostate cancer (PC) is the most commonly diagnosed male malignancy and an important cause of mortality. Androgen deprivation therapy is the first line treatment but, unfortunately, a large part of patients evolves to a castration-resistant stage, for which no effective cure is currently available. The DNA/RNA helicase DHX9 is emerging as an important regulator of cellular processes that are often deregulated in cancer.

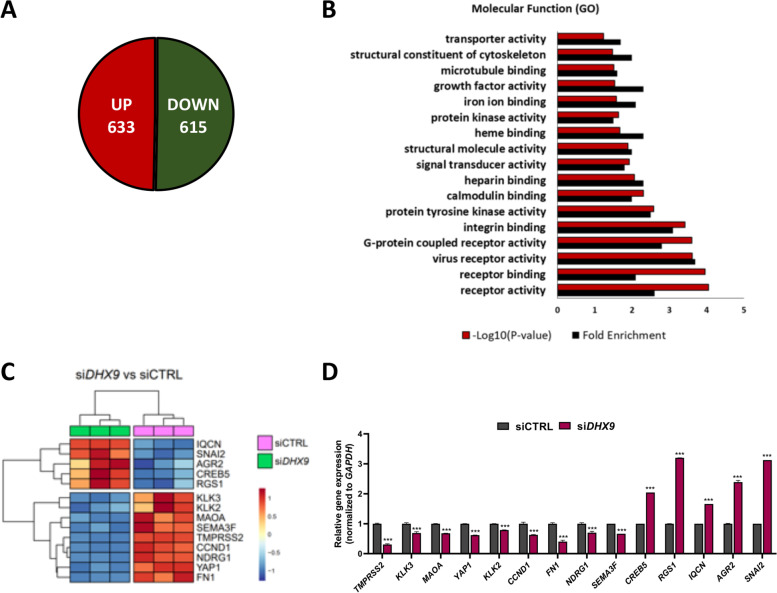
Methods: To investigate whether DHX9 modulates PC cell transcriptome we performed RNA-sequencing analyses upon DHX9 silencing in the androgen-responsive cell line LNCaP. Bioinformatics and functional analyses were carried out to elucidate the mechanism of gene expression regulation by DHX9. Data from The Cancer Genome Atlas were mined to evaluate the potential role of DHX9 in PC.

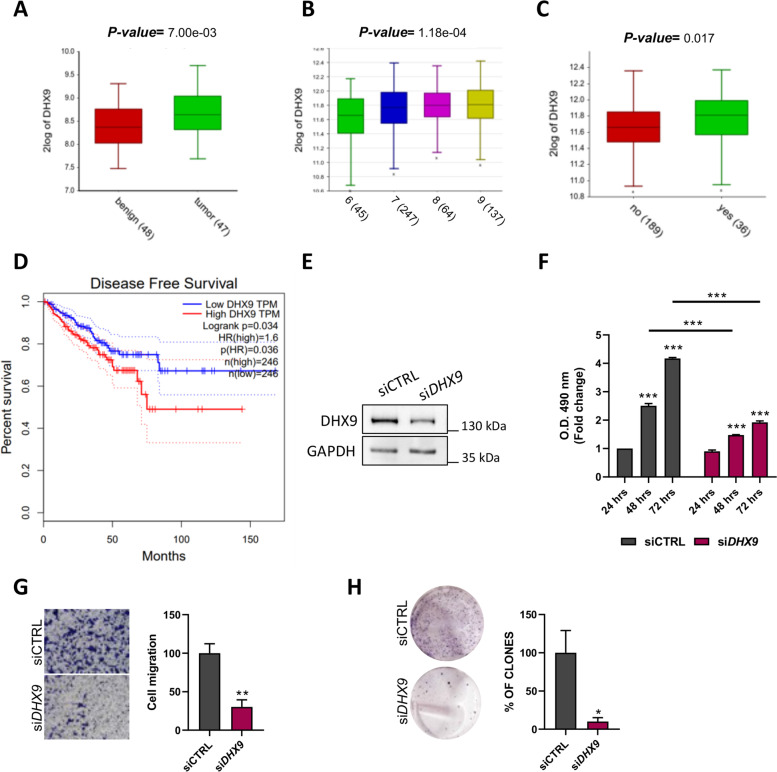
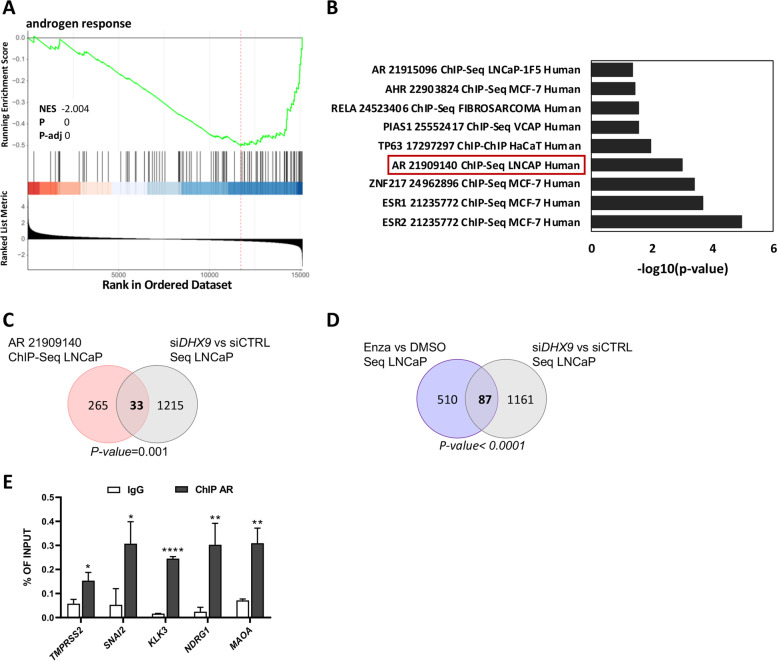
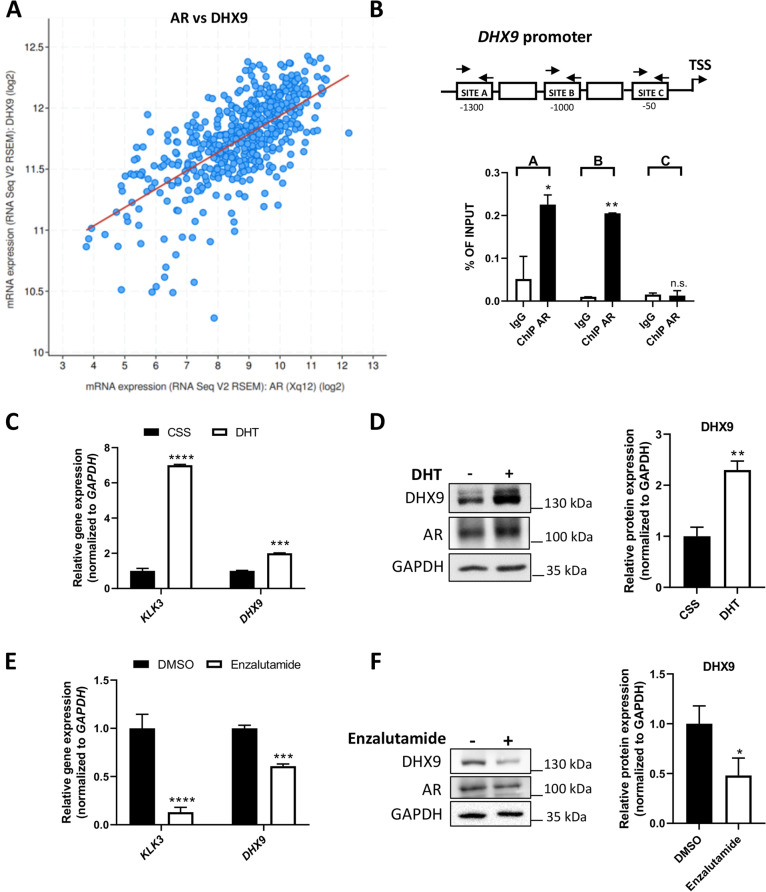
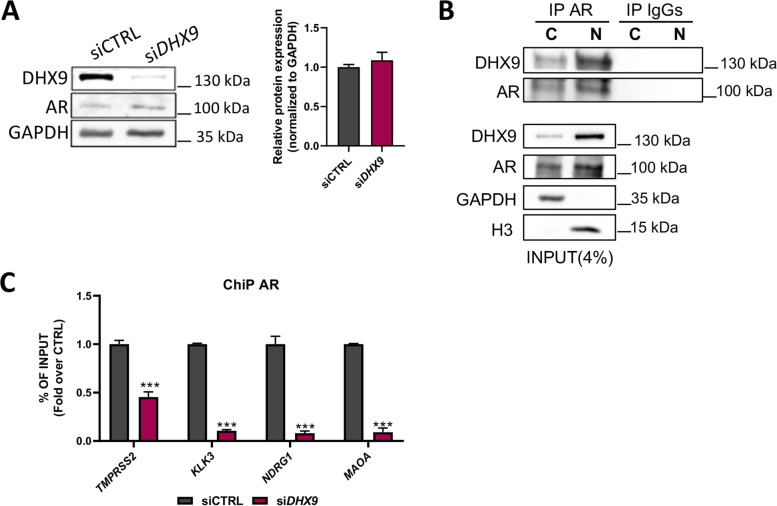
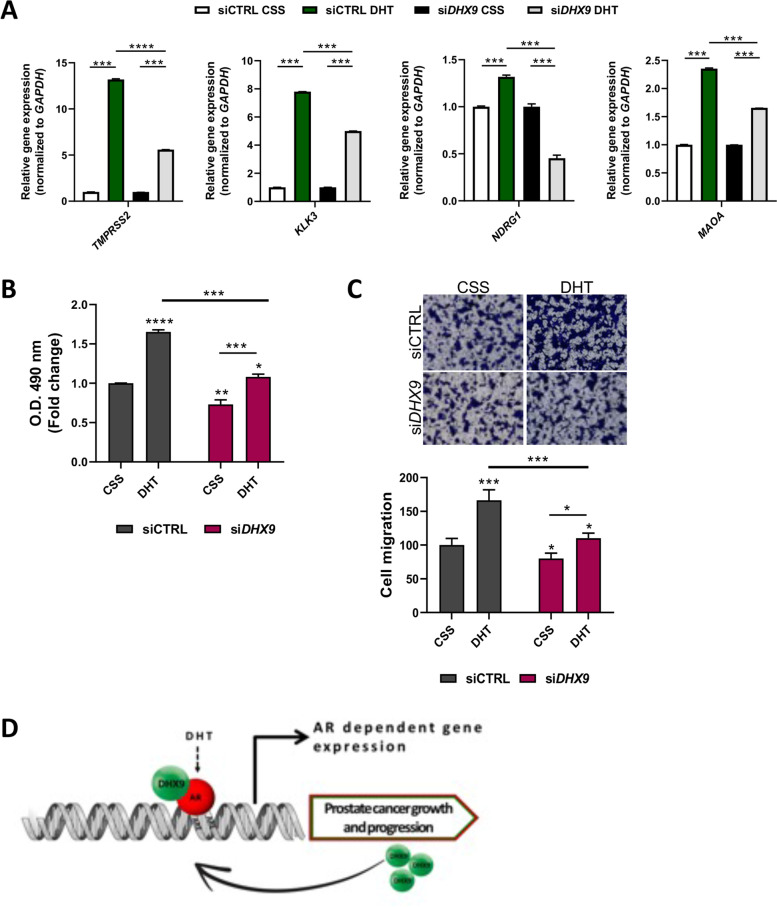
Results: We found that up-regulation of DHX9 correlates with advanced stage and is associated with poor prognosis of PC patients. High-throughput RNA-sequencing analysis revealed that depletion of DHX9 in androgen-sensitive LNCaP cells affects expression of hundreds of genes, which significantly overlap with known targets of the Androgen Receptor (AR). Notably, AR binds to the DHX9 promoter and induces its expression, while Enzalutamide-mediated inhibition of AR activity represses DHX9 expression. Moreover, DHX9 interacts with AR in LNCaP cells and its depletion significantly reduced the recruitment of AR to the promoter region of target genes and the ability of AR to promote their expression in response to 5α-dihydrotestosterone. Consistently, silencing of DXH9 negatively affected androgen-induced PC cell proliferation and migration.

Conclusions: Collectively, our data uncover a new role of DHX9 in the control of the AR transcriptional program and establish the existence of an oncogenic DHX9/AR axis, which may represent a new druggable target to counteract PC progression.


Conflict of interest statement

The authors declare that they have no competing interests.

Figures

Fig. 1
Fig. 1
DHX9 is associated with poor prognosis in PC patients. A Expression profiling of DHX9 mRNAs in human normal and tumor specimens from Gene Expression Omnibus profile dataset (GSE29079). Statistical analysis was performed by Student’s t test and significance is indicated in the plot. B Boxplot represents DHX9 expression in PC patients grouped according to the different Gleason score (TCGA dataset: Tumor Prostate Adenocarcinoma-TCGA-rsem-tcgars). C Expression profiling of DHX9 mRNAs in human tumor specimens from stable and progressive disease, with complete or partial remission, from TCGA dataset (Tumor Prostate Adenocarcinoma-TCGA-rsem-tcgars) plotted for biochemical recurrence. Statistical analysis was performed by Student’s t test and significance is indicated in the plot. D Kaplan-Meier curve of Disease-Free Survival rate of PC patients analysed for DHX9 expression (492 patients, TCGA dataset). The blue line shows patients with low DHX9 expression, the red line shows patients with high DHX9 expression. Significance is indicated in the plot. LNCaP cells were transfected with a control siRNA (siCTRL) or a siRNA specific for DHX9 (siDHX9) and analyzed by WB after 48 hrs (E) and (F) MTS assay after 24, 48, and 72 hours. Values are the mean ± SD of three independent experiments, each performed in triplicate, considering the siCTRL at 24 hrs as 1. (G) siCTRL and siDHX9 LNCaP cells were transfected and cultured for 48 hrs as in (E) and migration assay was performed. The crystal violet–stained migrating cells were photographed (left) and counted (right). Values are the mean ± SD of three independent experiments, considering the siCTRL as 100. Magnification, × 10. H Colony assay was performed in LNCaP cells transfected with either control (siCTRL) or DHX9 siRNA (siDHX9). Histogram represents the percentage of colonies, reported as the mean ± SD of three experiments, considering the siCTRL as 100. Statistical analysis in (F) was performed by two-way ANOVA and in (G) and (H) was performed by Student’s t test, p values: *, p ≤ 0.05; **, p ≤ 0.01; ***, p ≤ 0.001
Fig. 2
Fig. 2
DHX9 depletion affects gene expression in LNCaP cells. A Schematic representation of the distribution of up and down regulated genes upon DHX9 silencing. B Gene Ontology (performed using DAVID) of terms regulated at gene expression levels by analyzing DEGs after DHX9 silencing. Histograms represent the Fold Enrichment score and the -log10 (p-values). C Heatmap summarizing the outcome of the RNA sequencing for the genes selected for RT-qPCR validations. D Validation of DEGs regulated by DHX9 silencing was performed by RT-qPCR analyses, using the indicated primers. Values are the mean ± SD of three independent experiments, considering the siCTRL as 1. Statistical analyses were performed by Student’s t test, p values: ***, p ≤ 0.001
Fig. 3
Fig. 3
DEGs upon DHX9 silencing are enriched in AR targets. A Gene Set Enrichment analysis (GSEA) of androgen response gene signature in siDHX9 versus siCTRL LNCaP cells. Androgen response resulted as the second most significant category after mTORC signaling (Suppl. Table S3). Bars represent individual genes in a ranked data set list. NES, normalized enrichment score. B Gene set enrichment analysis (performed via EnrichR) of DEGs after siDHX9. The overlap between the two analysis is shown in the Venn diagram (p-value = 0.001) in (C). D DEGs after DHX9 silencing were overlapped with DEGs in response to Enzalutamide treatment (p-value < 0.0001). E qPCR analyses of ChIP experiments performed in LNCaP cells using AR antibody and anti-IgG rabbit Abs (IgG). Associated DNA was expressed as % of input. Values are the mean ± SD of three independent experiments. Statistical analysis was performed by Student’s t test, p values: *, p ≤ 0.05; **, p ≤ 0.01; ****, p ≤ 0.0001
Fig. 4
Fig. 4
AR binds to the DHX9 promoter and modulates its expression. A The plot shows the Pearson correlation between AR and DHX9 expression in 499 patients with PC (TCGA, Firehose legacy project). B qPCR analyses of ChIP experiments performed in LNCaP cells using AR antibody and anti-IgG rabbit Abs (IgG). Associated DNA was expressed as % of input. The sequences tested for the AR binding on the DHX9 promoter are indicated. LNCaP cells were cultured in CSS for 48 hrs, stimulated with DHT (10 nM) for 24 hrs and the expression of DHX9 was measured by qPCR (C) or WB analysis (D). Quantification of mRNA and protein level are shown in the bar graphs as the mean ± SD of three independent experiments, considering the control sample (CSS) as 1. LNCaP cells were treated with Enzalutamide for 24 hours (1 μM) and DHX9 expression was measured by qPCR (E) or WB analysis (F). Histogram represents the mean ± SD of three independent experiments, considering the DMSO sample as 1. Statistical analyses were performed by Student’s t test, p values: *, p ≤ 0.05; **, p ≤ 0.01; ***, p ≤ 0.001; ****, p ≤ 0.0001
Fig. 5
Fig. 5
DHX9 interacts with AR and is required for the AR recruitment on the promoter of its target genes. A LNCaP cells were transfected with either control siRNA (siCTRL) or a siRNA specific for DHX9 (siDHX9) for 48 hrs. DHX9 and AR expression was measured by WB analysis. Histogram represents the relative AR protein expression versus siCTRL, normalized to GAPDH expression. B Cytosolic (C) and nuclear (N) LNCaP extracts were immunoprecipitated with AR antibody (IP AR). IP and input were subjected to WB to analyse the expression of DHX9 and AR. GAPDH and H3 were used as cytosolic and nuclear markers. C LNCaP cells were transfected with a control siRNA (siCTRL) or a siRNA specific for DHX9 (siDHX9) for 48 hours and ChIP experiments were performed using AR antibody. Associated DNA was measured by qPCR and histogram represents the fold over CTRL, expressed as % of input. Statistical analysis was performed by Student’s t test, p values: ***, p ≤ 0.001
Fig. 6
Fig. 6
DHX9 contributes to the androgen-mediated AR program. A LNCaP cells were transfected with a control siRNA (siCTRL) or a siRNA specific for DHX9 (siDHX9), cultured for 48 hrs in CSS, and treated or not with DHT (10 nM). qPCR was performed to analysed the expression level of the indicated genes. Histogram represents the mean ± SD of three independent experiments, expressed as fold change, considering the CSS samples as 1. B LNCaP cells were transfected, cultured as in (A) and analyzed by MTS assay after 48 hrs. Values are the mean ± SD of two independent experiments, each performed in triplicate, considering the siCTRL CSS samples as 1. C LNCaP cells were transfected and cultured for 48 hours as in (A) and migration assay was performed. The crystal violet–stained migrating cells were photographed (upper) and counted (bottom). Values are the mean ± SD of three independent experiments, considering the CSS samples as 100. Magnification, × 10. Statistical analysis in (A), (B) and (C) were performed by Student’s t test, p values: *, p ≤ 0.05; **, p ≤ 0.01; ***, p ≤ 0.001; ****, p ≤ 0.0001. D Proposed model of the DHX9/AR crosstalk

Similar articles

Cited by

References

    1. Rebello RJ, Oing C, Knudsen KE, Loeb S, Johnson DC, Reiter RE, et al. Prostate Cancer Nat Rev Dis Primers. 2021;7(1):9. doi: 10.1038/s41572-020-00243-0. - DOI - PubMed
    1. Sartor O, de Bono JS. Metastatic Prostate Cancer. N Engl J Med. 2018;378(17):1653–1654. doi: 10.1056/NEJMc1803343. - DOI - PubMed
    1. Feng Q, He B. Androgen receptor signaling in the development of castration-resistant prostate cancer. Front Oncol. 2019;9:858. doi: 10.3389/fonc.2019.00858. - DOI - PMC - PubMed
    1. Tan MH, Li J, Xu HE, Melcher K, Yong EL. Androgen receptor: structure, role in prostate cancer and drug discovery. Acta Pharmacol Sin. 2015;36(1):3–23. doi: 10.1038/aps.2014.18. - DOI - PMC - PubMed
    1. Wang G, Zhao D, Spring DJ, DePinho RA. Genetics and biology of prostate cancer. Genes Dev. 2018;32(17–18):1105–1140. doi: 10.1101/gad.315739.118. - DOI - PMC - PubMed

MeSH terms