Review
. 2022 May 19;20(1):236.
doi: 10.1186/s12951-022-01451-4.

Bioimaging guided pharmaceutical evaluations of nanomedicines for clinical translations

Affiliations
Review

Bioimaging guided pharmaceutical evaluations of nanomedicines for clinical translations

Ruslan G Tuguntaev et al. J Nanobiotechnology. .

Abstract

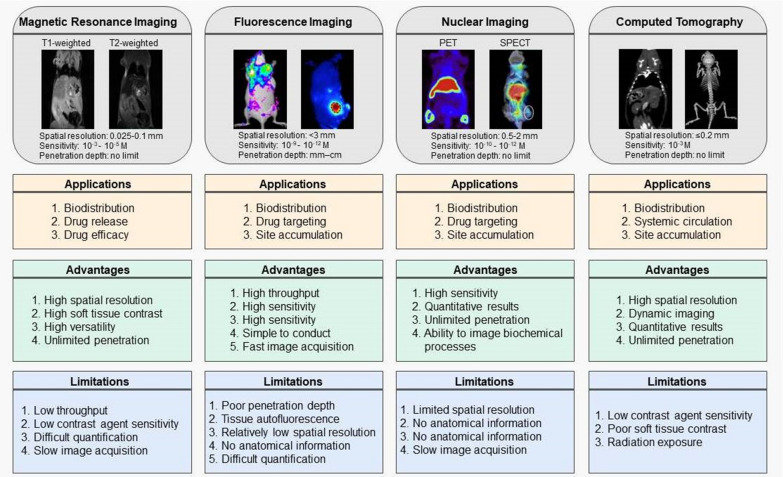
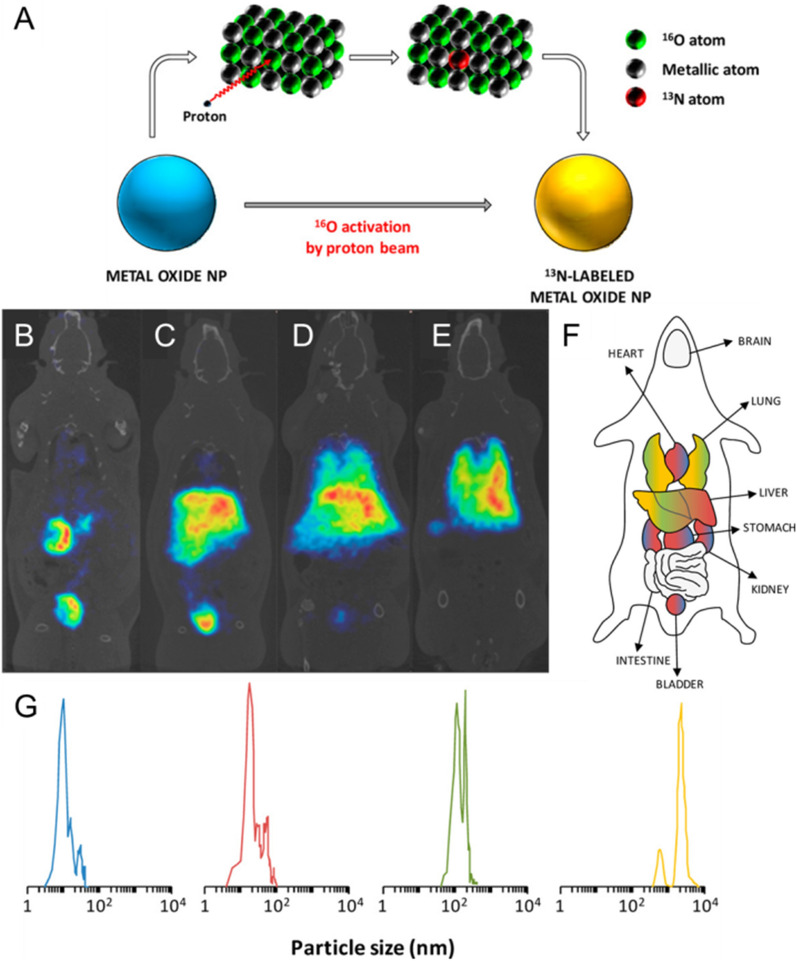
Nanomedicines (NMs) have emerged as an efficient approach for developing novel treatment strategies against a variety of diseases. Over the past few decades, NM formulations have received great attention, and a large number of studies have been performed in this field. Despite this, only about 60 nano-formulations have received industrial acceptance and are currently available for clinical use. Their in vivo pharmaceutical behavior is considered one of the main challenges and hurdles for the effective clinical translation of NMs, because it is difficult to monitor the pharmaceutic fate of NMs in the biological environment using conventional pharmaceutical evaluations. In this context, non-invasive imaging modalities offer attractive solutions, providing the direct monitoring and quantification of the pharmacokinetic and pharmacodynamic behavior of labeled NMs in a real-time manner. Imaging evaluations have great potential for revealing the relationship between the physicochemical properties of NMs and their pharmaceutical profiles in living subjects. In this review, we introduced imaging techniques that can be used for in vivo NM evaluations. We also provided an overview of various studies on the influence of key parameters on the in vivo pharmaceutical behavior of NMs that had been visualized in a non-invasive and real-time manner.

Keywords: Biomedical imaging; Nanomedicine; Pharmaceutical evaluations; Physicochemical characteristics.


Conflict of interest statement

The authors declare that they have no competing interests.

Figures

Fig. 1
Fig. 1
Non-invasive imaging modalities can provide real-time monitoring of NMs fate in vivo and facilitate their clinical translation. Created with BioRender
Fig. 2
Fig. 2
Clinical translation status of NMs. A Timeline of the development of major NMs. B clinically approved NMs categorized by particle type. C categorization of current clinical trials of NMs based on indications. D сhronological NMs approvals categorized by particle type
Fig. 3
Fig. 3
An overview of specific applications, advantages, and limitations of imaging modalities applied in NMs research. Adapted with permission from [–34]. Copyright 2014, 2015, 2019, 2021, American Chemical Society; 2019, 2020, Springer Nature; 2015, Elsevier
Fig. 4
Fig. 4
Size-dependent biodistribution of NMs. A activation of Al2O3 NPs by proton irradiation through the 16O(p,α)13 N nuclear reaction. Metal oxide NPs are activated with protons that convert 16O atoms to 13 N atoms by collision. B-E) PET visualization of 13 N-labeled Al2O3 NPs signal at t60: NS10nmNPs B, NS40nmNPs C, NS150nmNPs D, and NS10µmNPs E. F particle size-dependent organ accumulation. G distribution of particle size evaluated by TEM (NS10nm,NS40nm,NS150nm) or DLS (NS10µm). Reproduced with permission from [153]. Copyright 2013, American Chemical Society
Fig. 5
Fig. 5
Size-dependent intratumoral accumulation of NMs. A Left: schematic illustration of ZCIS QDs and hydrodynamic diameters distribution of ZCIS NMs-25 and ZCIS NMs-80. Right: in vivo multispectral optical tomography (MSOT) images of tumors (indicated with white arrows) in mice obtained at different time points after i.v. injection of ZCIS NMs-25 and ZCIS NMs-80. B In vivo MRI images of the tumor bearing mice obtained at 48 h p.i. (arrows indicate tumors). C MSOT signal increase in the tumor at various times p.i. Reproduced with permission from [159]. Copyright 2016, American Chemical Society
Fig. 6
Fig. 6
Size-dependent intratumoral behavior of NMs. A schematic illustration of the disassembly of BiS@HSA/DTX mNRs and DTX release upon laser exposure. B TEM images and schematic pictures (insets) of BiS@HSA/DTX mNRs before (left) and after (right) laser irradiation (808 nm, 1 W/cm2, 10 min). C PA visualization of tumors in mice with or without laser irradiation at 12 h p.i. D fluorescence images of tumor-bearing mice obtained at various time points with or without laser exposure. Reproduced with permission from [161]. Copyright 2018, American Chemical Society
Fig. 7
Fig. 7
Size-dependent intratumoral persistence of NMs. A schematic representation of laser-induced aggregation of dNMs. B TEM image of ICG/TPZ@HSA dNMs (scale bar: 50 nm). C TEM images of dNMs at different time points upon laser irradiation. D PA visualization of dNMs in 4T1 tumor-bearing mice following i.v. administration with. E PA visualization of dNMs in 4T1 tumor-bearing mice following i.v. administration without laser irradiation at different time points. Reproduced with permission from [167]. Copyright 2018, Wiley-VCH
Fig. 8
Fig. 8
Shape-dependent biodistribution of NMs. Biodistribution of filomicelles in A549 tumor xenograft mice: A upper panel: whole body bioluminescent images of luciferase-transfected A549 tumor xenograft mice (inset: photograph of tumor); lower panel NIR fluorescence image of A549 tumor xenograft mouse that shows the diffuse fluorescence of NIRF-labeled filomicelles in circulation. Transport and distribution in tumors in vivo for nanospheres versus nanorods of the same hydrodynamic diameter. B schematic illustration of nanospheres and nanorods. C Transvascular transport rates and D distribution in orthotopic E0771 mammary tumors in vivo for nanospheres versus nanorods of the same hydrodynamic diameter (33–35 nm); E NPs penetration in tumors. Co-registered in vivo luminescence and X-ray images of the tumor-bearing mice at 1 h (left panel) and 24 h (right panel) p.i. of the various types of 198Au-incorporated nanostructures: F nanospheres, G nanodisks, H nanorods, and I cubic nanocages. Reproduced with permission from [179, 181, 182]. Copyright 2009, 2014, American Chemical Society; 2011, Wiley-VCH
Fig. 9
Fig. 9
Surface charge-dependent biodistribution of NMs. A schematic of illustration of fluorescently labelled liposomes and quantification in zebrafish. B liposomes distribution in kdrl:GFP transgenic embryos, 1 h p.i. C in vivo imaging of liposomes in circulation (measured in the lumen of the dorsal aorta, and liposome association with different blood vessel types. CHT-EC: caudal hematopoietic tissue endothelial cells, DLAV: dorsal longitudinal anastomotic vessel. ISV: intersegmental vessel. D liposomes distribution at tissue level. Quantification of liposome levels: E in circulation based on mean rhodamine fluorescence intensity in the lumen of the dorsal aorta. F associated with venous vs. arterial endothelial cells based on rhodamine fluorescence intensity associated with caudal vein (CV) vs. DA at 8 h p.i. G outside of the vasculature between the DLAV and DA at 8 h p.i. H associated with the vessel wall based on rhodamine fluorescence intensity associated with all endothelial cells relative to rhodamine fluorescence intensity in circulation at 1 h p.i. Reproduced with permission from [205]. Copyright 2018, American Chemical Society
Fig. 10
Fig. 10
Surface charge-dependent circulation of NMs. A schematic representation of photoswitching of the surface charge of a liposome. B real time multi-photon imaging of liposome distribution with or without UV exposure. At later times, large aggregations of liposomes (white arrows) were detected passing through the plane of view in circulation. c mean fluorescence intensity within the lumen of dorsal aorta (white square, − UV and + UV 15 min). Fluorescence intensity of liposomes immediately reduced upon UV exposure. Large circulating aggregates of liposomes caused high intensity spikes of fluorescence registered after 5 min of UV irradiation. Reproduced with permission from [211]. Copyright 2020, Springer Nature
Fig. 11
Fig. 11
PEG length-dependent biodistribution of NMs. A in vivo visualization of various surface-modified SiNPs biodistribution at various times (a - abdomen imaging, b - back imaging). Arrows indicate kidney (K), liver (L), and urinary bladder (Ub) location. Reproduced with permission from. B time-dependent in vivo imaging of ITK705-amino QDs coated with methoxy-terminated PEG of different chain length: P1 = 2.75 kDa, P3 = 7.0 kDa, P5 = 22 kDa. Reproduced with permission from. C time course of fluorescence images of mice treated with PEGylated Ag2S@PNCSV40. D blood circulation curves of uncoated and PEGylated Ag2S@PNCSV40 in mice. Reproduced with permission from [–216]. Copyright 2008, 2009, 2015, American Chemical Society
Fig. 12
Fig. 12
PEG length-dependent circulation of NMs. A schematic illustration of DTTB@PEG NMs preparation. B real-time intrinsic NIR-II visualization of whole-body vascular network on nude mice recorded 60 min p.i. C vessel FWHM width analyses (red lines in panel A) based on the cross-sectional intensity profiles. D pharmacokinetics of NMs following i.v. administration. Reproduced with permission from [218]. Copyright 2020, American Chemical Society
Fig. 13
Fig. 13
Drug release-dependent biodistribution of NMs. A release mechanism of CPT from activatable prodrug by treatment with GSH. In vivo imaging of tumor-bearing mice at different times (0.15, 1, 2, 6, and 24 h) after i.v. injection of: B DCM-C-CPT (0.08 mg/ kg) and DCM-S-CPT (0.08 mg/kg). C fluorescence images of the internal organs after anatomy for DCM-C-CPT and DCM-S-CPT. Reproduced with permission from [30]. Copyright 2014, American Chemical Society
Fig. 14
Fig. 14
Drug release-dependent intratumoral accumulation of NMs. Schematic representation of: A ICG/DOX@Gel-CuS NMs fabrication, B mechanism of enzyme-activated DOX release followed by real-time monitoring and quantification by fluorescence/PA dual-modal imaging. C in vivo MSOT images of mice administered ICG/DOX@Gel-CuS NMs at various time points p.i. D in vivo NIR fluorescence images of mice administered NMs via both subcutaneous (dotted arrow) and intratumor (solid arrow) injection at various time points p.i. E NIR fluorescence images of mice administered ICG/DOX@ Gel-CuS NMs through i.v. injection at various time points p.i. F 3D-reconstruction of transillumination fluorescence images of mice administered NMs through i.v. injection at various tilt angles. Reproduced with permission from [233]. Copyright 2018, American Chemical Society

Similar articles

Cited by

References

    1. Mitchell MJ, Billingsley MM, Haley RM, Wechsler ME, Peppas NA, Langer R. Engineering precision nanoparticles for drug delivery. Nat Rev Drug Discovery. 2021;20(2):101–24. doi: 10.1038/s41573-020-0090-8. - DOI - PMC - PubMed
    1. Manzari MT, Shamay Y, Kiguchi H, Rosen N, Scaltriti M, Heller DA. Targeted drug delivery strategies for precision medicines. Nat Rev Mater. 2021;6(4):351–70. doi: 10.1038/s41578-020-00269-6. - DOI - PMC - PubMed
    1. Deng C, Zhang Q, He P, Zhou B, He K, Sun X, et al. Targeted apoptosis of macrophages and osteoclasts in arthritic joints is effective against advanced inflammatory arthritis. Nat Commun. 2021;12(1):2174. doi: 10.1038/s41467-021-22454-z. - DOI - PMC - PubMed
    1. Wang Z, Little N, Chen J, Lambesis KT, Le KT, Han W, et al. Immunogenic camptothesome nanovesicles comprising sphingomyelin-derived camptothecin bilayers for safe and synergistic cancer immunochemotherapy. Nat Nanotechnol. 2021;16(10):1130–40. doi: 10.1038/s41565-021-00950-z. - DOI - PMC - PubMed
    1. Zhou Z, Yeh C-F, Mellas M, Oh M-J, Zhu J, Li J, et al. Targeted polyelectrolyte complex micelles treat vascular complications in vivo. Proceed Nat Academy Sci. 2021;118(50):e2114842118. doi: 10.1073/pnas.2114842118. - DOI - PMC - PubMed

Substances

LinkOut - more resources