. 2022 Apr 19;22(9):3106.
doi: 10.3390/s22093106.

mm-Wave Radar-Based Vital Signs Monitoring and Arrhythmia Detection Using Machine Learning

Affiliations

mm-Wave Radar-Based Vital Signs Monitoring and Arrhythmia Detection Using Machine Learning

Srikrishna Iyer et al. Sensors (Basel). .

Abstract

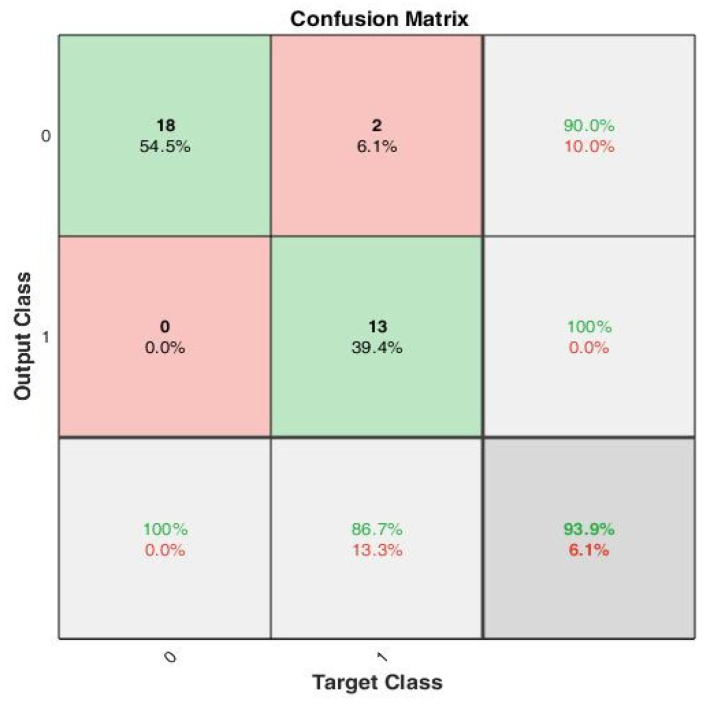
A non-contact, non-invasive monitoring system to measure and estimate the heart and breathing rate of humans using a frequency-modulated continuous wave (FMCW) mm-wave radar at 77 GHz is presented. A novel diagnostic system is proposed which extracts heartbeat phase signals from the FMCW radar (reconstructed using Fourier series analysis) to test a three-layer artificial neural network model to predict the presence of arrhythmia in individuals. The effect of person orientation, distance of measurement and movement was analyzed with respect to a reference device based on statistical measures that include number of outliers, mean, mean squared error (MSE), mean absolute error (MAE), median absolute error (medAE), skewness, standard deviation (SD) and R-squared values. The individual oriented in front of the radar outperformed almost all other orientations for most distances with an expected d = 90 cm and d = 120 cm. Furthermore, it was found that the heart rate that was measured while walking and the breathing rate which was measured for a motionless individual generated results with the lowest SD and MSE. An artificial neural network (ANN) was trained using the MIT-BIH database with a training accuracy of 93.9 % and an R2 value = 0.876. The diagnostic tool was tested on 15 subjects and achieved a mean test accuracy of 75%.

Keywords: artificial neural network; machine learning; mm-wave radar; vital signs.


Conflict of interest statement

The authors declare no conflict of interest.

Figures

Figure 1
Figure 1
Schematic of the proposed mm-wave radar system: an mm-wave radar is fixed at front of the subject while an Omron sphygmomanometer is attached, which simultaneously extracts pulse readings for verification. The radar data are recorded on a PC through a USB connection.
Figure 2
Figure 2
Transmitted and received chirp signals where each chirp is a sinusoidal signal with a slope S and time delay between transmitted and received chirp τ when the sweeping bandwidth is Sτ.
Figure 3
Figure 3
A MIMO radar with two transmitting antennas (Tx) and four receiving antennas (Rx) where distance between two receiving antennas is dm and θ is the angle of arrival.
Figure 4
Figure 4
Signal processing workflow: after applying the range FFT, for a single range bin, the angle FFTs are computed, upon which the phase shift is used to extract the heartbeat and breathing waves.
Figure 5
Figure 5
Symmetric triangular wave function to model the QRS components of an ECG signal.
Figure 6
Figure 6
Predict the onset of arrhythmia based on statistical features extracted from the phase signals of a localized range bin using an FMCW radar.
Figure 7
Figure 7
ECG signal pre-processing (left to right): ECG signals are extracted using electrodes mounted on the body. Hence, some artifacts are filtered out before statistical features can be extracted from the ECG signal database. Artifacts include muscle tremor, electromagnetic interference (EMI) and base-line wander. Muscle tremor artifacts caused due to sudden body movements are high-frequency signals (30~300 Hz) that are removed by Butterworth low-pass filters. The 50 Hz electromagnetic interference is suppressed by a Butterworth band-stop filter. Baseline wander is an ultra-low frequency signal that ranges between 0 and 0.8 Hz that can be eliminated using a high-pass filter. Finally, the resultant R peaks of a QRS complex are detected, and only RR interval-based features are extracted since the radar-generated heartbeat phase signals are QRS equivalent signals.
Figure 8
Figure 8
A confusion matrix that summarizes the model performance with true positivity rate and true negativity rate, with accuracy of 100%, 90% and 93.9%, respectively.
Figure 9
Figure 9
The mean squared error during training reduced to a very low value at the 9th epoch. However, with early stopping enabled, the best performance was obtained at the 3rd epoch when the validation MSE = 0.025.
Figure 10
Figure 10
Gradient optimization using gradient descent and momentum.
Figure 11
Figure 11
Periodogram of input heartbeat phase signal.
Figure 12
Figure 12
Signal reconstruction using symmetric triangular wave function, which was then down sampled to 5 Hz to match the sampling frequency of the ECG signals used in the training dataset.
Figure 13
Figure 13
Periodogram of reconstructed phase signal shows that maximal power spectral density (PSD) lies in the frequency = 1.133 Hz.
Figure 14
Figure 14
Signal-to-noise ratio (a) SNR of input signal, (b) SNR of reconstructed signal using symmetrical triangular QRS wave function.

References

    1. Prgomet M., Cardona-Morrell M., Nicholson M., Lake R., Long J., Westbrook J., Braithwaite J., Hillman K. Vital signs monitoring on general wards: Clinical staff perceptions of current practices and the planned introduction of continuous monitoring technology. Int. J. Qual. Health Care. 2016;28:515–521. doi: 10.1093/intqhc/mzw062. - DOI - PubMed
    1. Burch V.C., Tarr G., Morroni C. Modified early warning score predicts the need for hospital admission and inhospital mortality. Emerg. Med. J. 2008;25:674–678. doi: 10.1136/emj.2007.057661. - DOI - PubMed
    1. Weenk M., van Goor H., Frietman B., Engelen L.J., van Laarhoven C.J., Smit J., Bredie S.J., van de Belt T.H. Continuous Monitoring of Vital Signs Using Wearable Devices on the General Ward: Pilot Study. JMIR Mhealth Uhealth. 2017;5:e91. doi: 10.2196/mhealth.7208. - DOI - PMC - PubMed
    1. Villarroel M., Guazzi A., Jorge J., Davis S., Watkinson P., Green G., Shenvi A., McCormick K., Tarassenko L. Continuous non-contact vital sign monitoring in neonatal intensive care unit. Health Technol. Lett. 2014;1:87–91. doi: 10.1049/htl.2014.0077. - DOI - PMC - PubMed
    1. Ginsburg A.S., Lenahan J.L., Izadnegahdar R., Ansermino J.M. A Systematic Review of Tools to Measure Respiratory Rate in Order to Identify Childhood Pneumonia. Am. J. Respir. Crit. Care Med. 2018;197:1116–1127. doi: 10.1164/rccm.201711-2233CI. - DOI - PubMed

LinkOut - more resources