. 2022 Apr 22;22(9):3219.
doi: 10.3390/s22093219.

Field Campaign Evaluation of Sensors Lufft GMX500 and MaxiMet WS100 in Peruvian Central Andes

Affiliations

Field Campaign Evaluation of Sensors Lufft GMX500 and MaxiMet WS100 in Peruvian Central Andes

Jairo M Valdivia et al. Sensors (Basel). .

Abstract

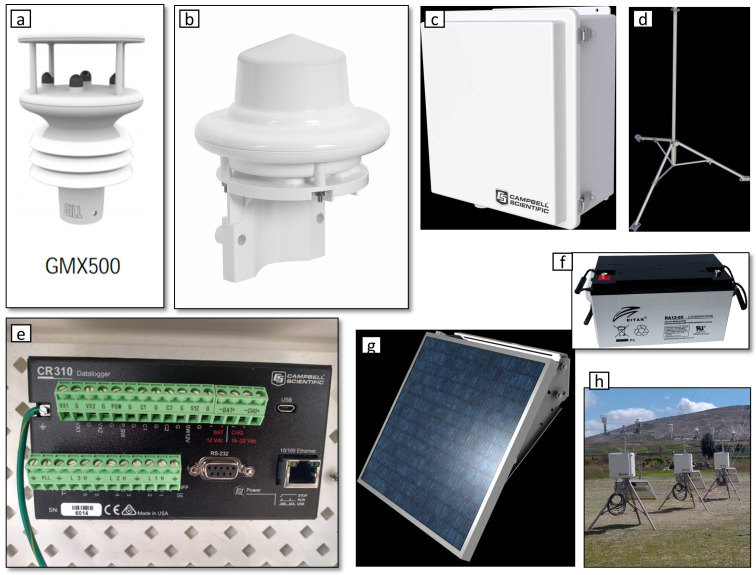
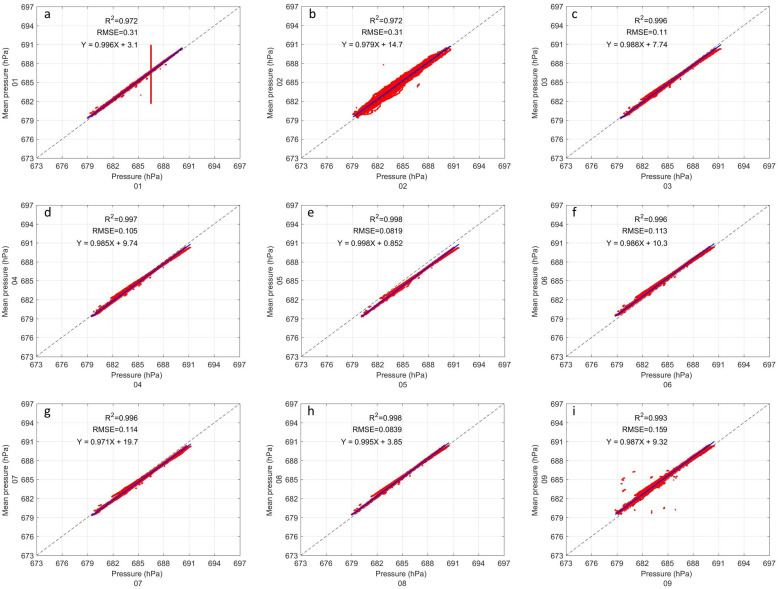
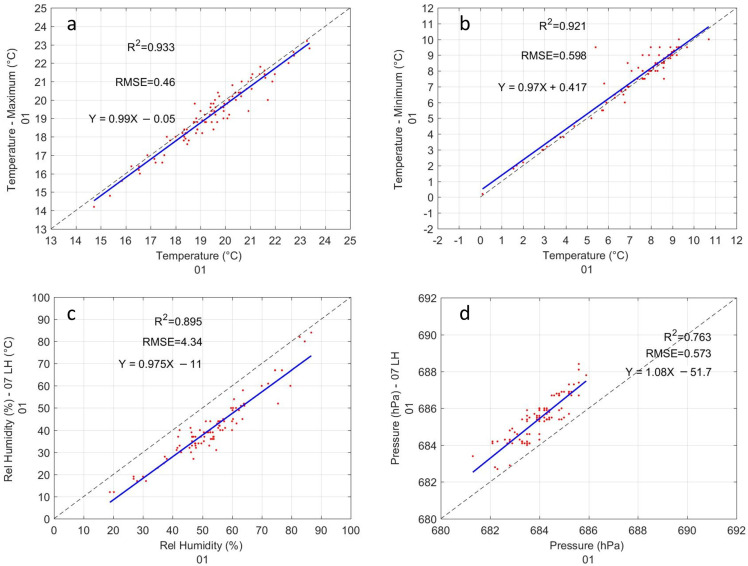
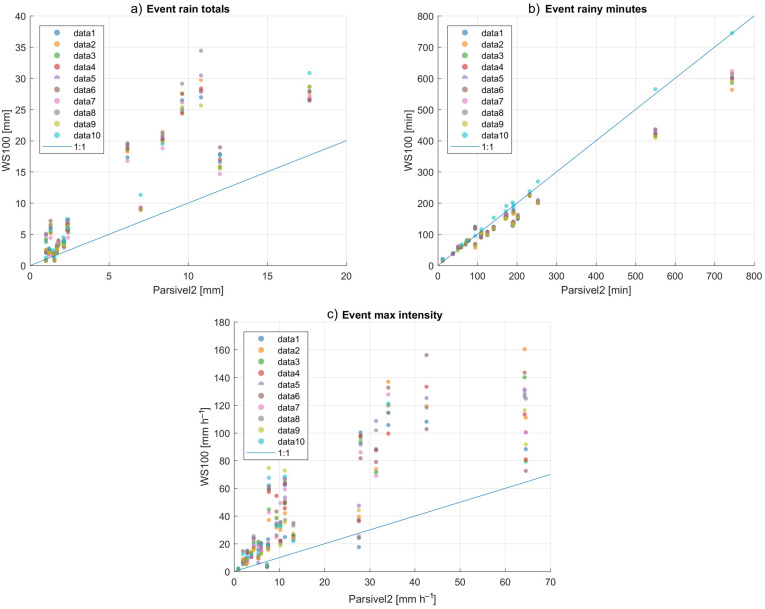
The research presents the inter-comparison of atmospheric variables measured by 9 automatic weather stations. This set of data was compared with the measurements of other weather stations in order to standardize the values that must be adjusted when taken to different areas. The data of a set of a total of 9 GMX500, which measures conventional meteorological variables, and 10 WS100 sensors, which measures precipitation parameters. The automatic stations were set up at the Huancayo Observatory (Geophysical Institute of Peru) for a period of 5 months. The data set of GMX500 were evaluated comparing with the average of the 9 sensors and the WS100 was compared with an optical disdrometer Parsivel2. The temperature, pressure, relative humidity, wind speed, rainfall rate, and drop size distribution were evaluated. A pair of GMX500 sensors presented high data dispersion; it was found found that the errors came from a bad configuration; once this problem was solved, good agreement was archived, with low RMSE and high correlation. It was found that the WS100 sensors overestimate the precipitation with a percentage bias close to 100% and the differences increase with the greater intensity of rain. The drop size distribution retrieved by WS100 have unrealistic behavior with higher concentrations in diameters of 1 mm and 5 mm, in addition to a flattened curve.

Keywords: DSD; Huancayo Observatory; Peruvian Central Andes; drop size distribution; meteorological instruments.


Conflict of interest statement

The authors declare no conflict of interest.

Figures

Figure 1
Figure 1
Distribution of the compact automatic stations in the site of study. (a) Picture of the installed compact automatic station in the Huancayo Observatory. (b) Distribution of the 10 stations, which have 3.5 m of the horizontal and vertical separation.
Figure 2
Figure 2
Components of the automatic compact stations. (a) Weather Sensor GMX500 MAXIMET GILL series. (b) WS100 Lufft Precipitation Sensor. (c) Campbell Scientific Box. (d) Stainless steel tripod. (e) Datalogger CR310—CAMPBELL SCIENTIFIC. (f) Battery Ritar 12 v 65 Ah AGM. (g) SP30 solar panel. (h) Final assembled stations.
Figure 3
Figure 3
Inter-comparison of temperature between GMX500 sensors. Each panel (ai) corresponds to a sensor under evaluation. The coefficient of determination (R2), the root mean square error (RMSE) and the lineal regression (in blue line) are shown in each panel.
Figure 4
Figure 4
Same as Figure 3 but for pressure.
Figure 5
Figure 5
Same as Figure 3 but for relative humidity.
Figure 6
Figure 6
Same as Figure 3 but for wind velocity.
Figure 6
Figure 6
Same as Figure 3 but for wind velocity.
Figure 7
Figure 7
Evaluation of GMX500 sensor 01 with a conventional weather station: (a) Minimum temperature. (b) Maximum temperature. (c) Pressure. (d) Relative Humidity. The linear regression is shown in blue line.
Figure 8
Figure 8
Comparison of ten WS100 sensors with Parsivel2 in rainfall events: (a) Accumulated event rain totals greater than 1 mm. (b) Duration of each event in minutes. (c) Maximum intensity registered by each event. Parsivel2 is used as reference and 23 events where found. The blue dashed line indicates the 1:1 relation.
Figure 9
Figure 9
Statistical distribution of rain rate at 1 min sampling output. (a) Probability distribution of rain rate. (b) Cumulative distribution of rain rate. The Parsivel2 is shown in black line.
Figure 10
Figure 10
Drop size distribution measured by Parsivel2 (black line) and WS100 sensors (color lines) for 23 rainfall events. From (aw), the DSD for each event is shown.
Figure 11
Figure 11
Inter-comparison of GMX500 sensor 01 after correcting the settings in the data logger: (a) Inter-comparison of temperature. (b) Inter-comparison of pressure. (c) Inter-comparison of relative humidity. (d) Inter-comparison of wind velocity.

References

    1. Matthews J., Wright M., Clarke D., Morley E., Silva H., Bennett A., Robert D., Shallcross D. Urban and rural measurements of atmospheric potential gradient. J. Electrost. 2019;97:42–50. doi: 10.1016/j.elstat.2018.11.006. - DOI
    1. Cheng W., Spengler J., Brown R.D. A Comprehensive Model for Estimating Heat Vulnerability of Young Athletes. Int. J. Environ. Res. Public Health. 2020;17:6156. doi: 10.3390/ijerph17176156. - DOI - PMC - PubMed
    1. Danezis C., Nikolaidis M., Mettas C., Hadjimitsis D.G., Kokosis G., Kleanthous C. Establishing an Integrated Permanent Sea-Level Monitoring Infrastructure towards the Implementation of Maritime Spatial Planning in Cyprus. J. Mar. Sci. Eng. 2020;8:861. doi: 10.3390/jmse8110861. - DOI
    1. Wright M.D., Matthews J.C., Silva H.G., Bacak A., Percival C., Shallcross D.E. The relationship between aerosol concentration and atmospheric potential gradient in urban environments. Sci. Total Environ. 2020;716:134959. doi: 10.1016/j.scitotenv.2019.134959. - DOI - PubMed
    1. Tokay A., Wolff D.B., Petersen W.A. Evaluation of the new version of the laser-optical disdrometer, OTT parsivel. J. Atmos. Ocean. Technol. 2014;31:1276–1288. doi: 10.1175/JTECH-D-13-00174.1. - DOI