Development and Calibration of Pressure-Temperature-Humidity (PTH) Probes for Distributed Atmospheric Monitoring Using Unmanned Aircraft Systems
- PMID: 35590950
- PMCID: PMC9100009
- DOI: 10.3390/s22093261
Development and Calibration of Pressure-Temperature-Humidity (PTH) Probes for Distributed Atmospheric Monitoring Using Unmanned Aircraft Systems
Abstract
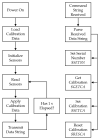
Small unmanned aircraft systems (UAS) are increasingly being used for meteorology and atmospheric monitoring. The ease of deployment makes distributed sensing of parameters such as barometric pressure, temperature, and relative humidity in the lower atmospheric boundary layer feasible. However, constraints on payload size and weight, and to a lesser extent power, limit the types of sensors that can be deployed. The objective of this work was to develop a miniature pressure-temperature-humidity (PTH) probe for UAS integration. A set of eight PTH probes were fabricated and calibrated/validated using an environmental chamber. An automated routine was developed to facilitate calibration and validation from a large set of temperature and relative humidity setpoints. Linear regression was used to apply temperature and relative humidity calibrations. Barometric pressure was calibrated using a 1-point method consisting of an offset. The resulting PTH probes were less than 4 g in mass and consumed less than 1 mA when operated from a 5 VDC source. Measurements were transmitted as a formatted string in ASCII format at 1 Hz over a 3.3 V TTL UART. Prior to calibration, measurements between individual PTH probes were significantly different. After calibration, no significant differences in temperature measurements across all PTH probes were observed, and the level of significance between PTH probes was reduced. Actual differences between calibrated PTH probes were likely to be negligible for most UAS-based applications, regardless of significance. RMSE across all calibrated PTH probes for the pressure, temperature, and relative humidity was less than 31 Pa, 0.13 °C, and 0.8% RH, respectively. The resulting calibrated PTH probes will improve the ability to quantify small variations in ambient conditions during coordinated multi-UAS flights.
Keywords: barometric pressure; calibration; distributed atmospheric monitoring; embedded systems; relative humidity; temperature; unmanned aircraft systems.
Conflict of interest statement
The authors declare no conflict of interest.
Figures


Similar articles
-
Moving towards a Network of Autonomous UAS Atmospheric Profiling Stations for Observations in the Earth's Lower Atmosphere: The 3D Mesonet Concept.Sensors (Basel). 2019 Jun 17;19(12):2720. doi: 10.3390/s19122720. Sensors (Basel). 2019. PMID: 31213000 Free PMC article. Review.
-
Air-braked cycle ergometers: validity of the correction factor for barometric pressure.Int J Sports Med. 2000 Oct;21(7):488-91. doi: 10.1055/s-2000-7416. Int J Sports Med. 2000. PMID: 11071051
-
Intercomparison of Small Unmanned Aircraft System (sUAS) Measurements for Atmospheric Science during the LAPSE-RATE Campaign.Sensors (Basel). 2019 May 10;19(9):2179. doi: 10.3390/s19092179. Sensors (Basel). 2019. PMID: 31083477 Free PMC article.
-
Development and Testing of a Rocket-Based Sensor for Atmospheric Sensing Using an Unmanned Aerial System.Sensors (Basel). 2024 Mar 9;24(6):1768. doi: 10.3390/s24061768. Sensors (Basel). 2024. PMID: 38544036 Free PMC article.
-
[Is olfactory function impaired in moderate height?].Laryngorhinootologie. 2009 Sep;88(9):583-6. doi: 10.1055/s-0029-1202368. Epub 2009 Mar 18. Laryngorhinootologie. 2009. PMID: 19296426 Review. German.
Cited by
-
Comprehensive Investigation of Unmanned Aerial Vehicles (UAVs): An In-Depth Analysis of Avionics Systems.Sensors (Basel). 2024 May 11;24(10):3064. doi: 10.3390/s24103064. Sensors (Basel). 2024. PMID: 38793917 Free PMC article. Review.
-
MXene/PPy@PDMS sponge-based flexible pressure sensor for human posture recognition with the assistance of a convolutional neural network in deep learning.Microsyst Nanoeng. 2023 Dec 19;9:155. doi: 10.1038/s41378-023-00605-0. eCollection 2023. Microsyst Nanoeng. 2023. PMID: 38116450 Free PMC article.
References
-
- Brewer M.J., Clements C.B. Meteorological Profiling in the Fire Environment Using UAS. Fire. 2020;3:36. doi: 10.3390/fire3030036. - DOI
-
- Hemingway B.L., Frazier A.E., Elbing B.R., Jacob J.D. Vertical Sampling Scales for Atmospheric Boundary Layer Measurements from Small Unmanned Aircraft Systems (sUAS) Atmosphere. 2017;8:176. doi: 10.3390/atmos8090176. - DOI
-
- Pinto J.O., Jensen A.A., Jimenez P.A., Hertneky T., Munoz-Esparza D., Dumont A., Steiner M. Real-time WRF large-eddy simulations to support uncrewed aircraft system (UAS) flight planning and operations during 2018 LAPSE-RATE. Earth Syst. Sci. Data. 2021;13:697–711. doi: 10.5194/essd-13-697-2021. - DOI
-
- Nolan P.J., Pinto J., Gonzalez-Rocha J., Jensen A., Vezzi C.N., Bailey S.C.C., de Boer G., Diehl C., Laurence R., Powers C.W., et al. Coordinated Unmanned Aircraft System (UAS) and Ground-Based Weather Measurements to Predict Lagrangian Coherent Structures (LCSs) Sensors. 2018;18:4448. doi: 10.3390/s18124448. - DOI - PMC - PubMed
MeSH terms
Grants and funding
LinkOut - more resources
Full Text Sources

