

The Relationship between Accelerometry, Global Navigation Satellite System, and Known Distance: A Correlational Design Study
- PMID: 35591051
- PMCID: PMC9105441
- DOI: 10.3390/s22093360
The Relationship between Accelerometry, Global Navigation Satellite System, and Known Distance: A Correlational Design Study
Abstract
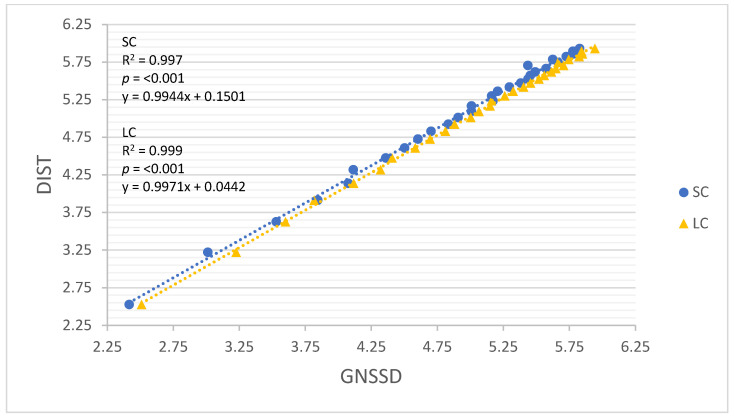
Background: Previous research has explored associations between accelerometry and Global Navigation Satellite System (GNSS) derived loads. However, to our knowledge, no study has investigated the relationship between these measures and a known distance. Thus, the current study aimed to assess and compare the ability of four accelerometry based metrics and GNSS to predict known distance completed using different movement constraints. Method: A correlational design study was used to evaluate the association between the dependent and independent variables. A total of 30 physically active college students participated. Participants were asked to walk two different known distances (DIST) around a 2 m diameter circle (small circle) and a different distance around an 8 m diameter circle (large circle). Each distance completed around the small circle by one participant was completed around the large circle by a different participant. The same 30 distances were completed around each circle and ranged from 12.57 to 376.99 m. Instrumentation: Acceleration data was collected via a tri-axial accelerometer sampling at 100 Hz. Accelerometry derived measures included the sum of the absolute values of acceleration (SUM), the square root of the sum of squared accelerations (MAG), Player Load (PL), and Impulse Load (IL). Distance (GNSSD) was measured from positional data collected using a triple GNSS unit sampling at 10 Hz. Results: Separate simple linear regression models were created to assess the ability of each independent variable to predict DIST. The results indicate that all regression models performed well (R = 0.960−0.999, R2 = 0.922−0.999; RMSE = 0.047−0.242, p < 0.001), while GNSSD (small circle, R = 0.999, R2 = 0.997, RMSE = 0.047 p < 0.001; large circle, R = 0.999, R2 = 0.999, RMSE = 0.027, p < 0.001) and the accelerometry derived metric MAG (small circle, R = 0.992, R2 = 0.983, RMSE = 0.112, p < 0.001; large circle, R = 0.997, R2 = 0.995, RMSE = 0.064, p < 0.001) performed best among all models. Conclusions: This research illustrates that both GNSS and accelerometry may be used to indicate total distance completed while walking.
Keywords: GNSS; GPS; accelerometers; monitoring; physical activity; training load; wearable technologies.
Conflict of interest statement
The authors declare no conflict of interest.
Figures


References
MeSH terms
Grants and funding
LinkOut - more resources
Full Text Sources
Research Materials
