

Selection of Noninvasive Features in Wrist-Based Wearable Sensors to Predict Blood Glucose Concentrations Using Machine Learning Algorithms
- PMID: 35591223
- PMCID: PMC9100498
- DOI: 10.3390/s22093534
Selection of Noninvasive Features in Wrist-Based Wearable Sensors to Predict Blood Glucose Concentrations Using Machine Learning Algorithms
Abstract
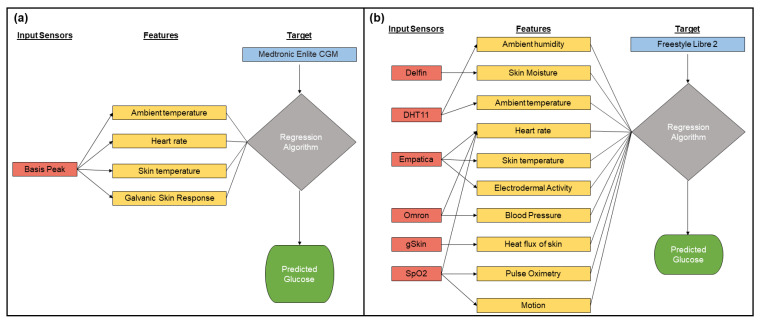
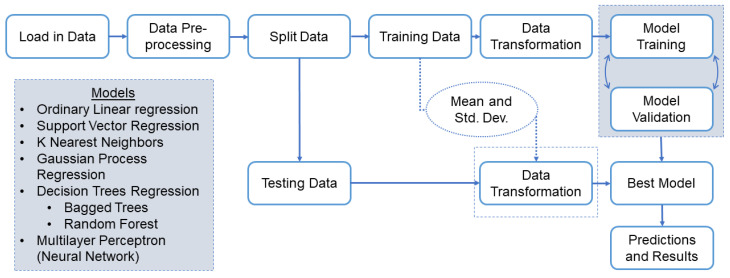
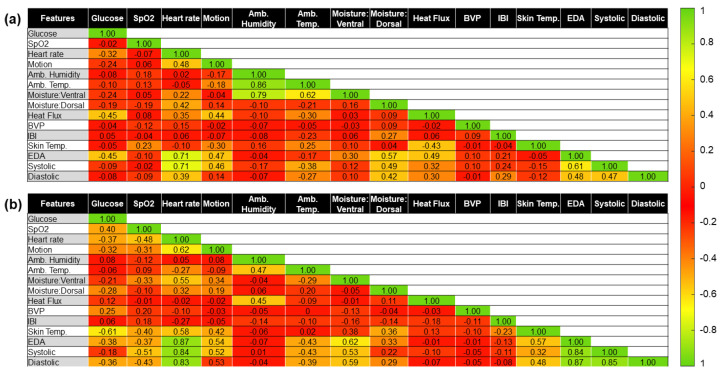
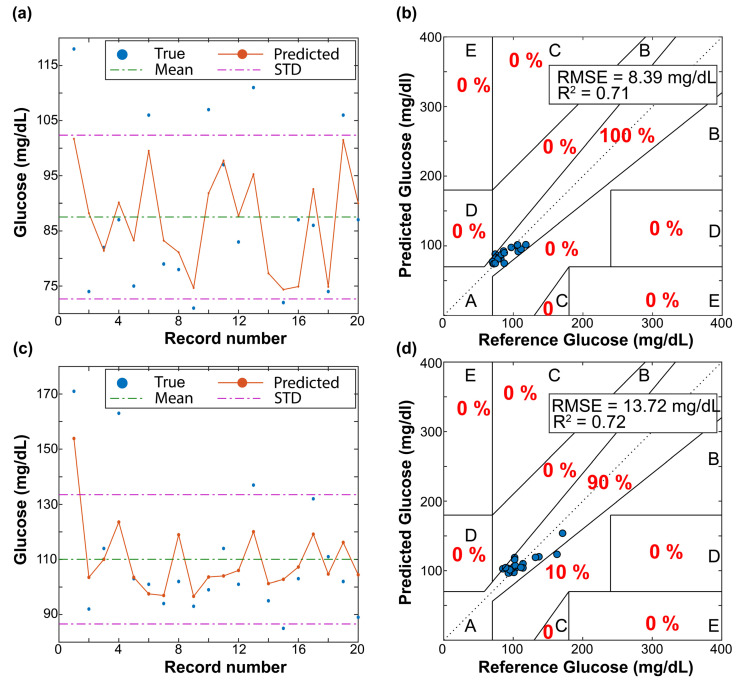
Glucose monitoring technologies allow users to monitor glycemic fluctuations (e.g., blood glucose levels). This is particularly important for individuals who have diabetes mellitus (DM). Traditional self-monitoring blood glucose (SMBG) devices require the user to prick their finger and extract a blood drop to measure the blood glucose based on chemical reactions with the blood. Unlike traditional glucometer devices, noninvasive continuous glucose monitoring (NICGM) devices aim to solve these issues by consistently monitoring users' blood glucose levels (BGLs) without invasively acquiring a sample. In this work, we investigated the feasibility of a novel approach to NICGM using multiple off-the-shelf wearable sensors and learning-based models (i.e., machine learning) to predict blood glucose. Two datasets were used for this study: (1) the OhioT1DM dataset, provided by the Ohio University; and (2) the UofM dataset, created by our research team. The UofM dataset consists of fourteen features provided by six sensors for studying possible relationships between glucose and noninvasive biometric measurements. Both datasets are passed through a machine learning (ML) pipeline that tests linear and nonlinear models to predict BGLs from the set of noninvasive features. The results of this pilot study show that the combination of fourteen noninvasive biometric measurements with ML algorithms could lead to accurate BGL predictions within the clinical range; however, a larger dataset is required to make conclusions about the feasibility of this approach.
Keywords: blood glucose self-monitoring; continuous monitoring; diabetes mellitus; glucose; hyperglycemia; machine learning; noninvasive.
Conflict of interest statement
The authors declare no conflict of interest.
Figures
Similar articles
-
Development of Non-Invasive Continuous Glucose Prediction Models Using Multi-Modal Wearable Sensors in Free-Living Conditions.Sensors (Basel). 2025 May 20;25(10):3207. doi: 10.3390/s25103207. Sensors (Basel). 2025. PMID: 40431999 Free PMC article.
-
Data-driven modeling and prediction of blood glucose dynamics: Machine learning applications in type 1 diabetes.Artif Intell Med. 2019 Jul;98:109-134. doi: 10.1016/j.artmed.2019.07.007. Epub 2019 Jul 26. Artif Intell Med. 2019. PMID: 31383477 Review.
-
On the Possibility of Predicting Glycaemia 'On the Fly' with Constrained IoT Devices in Type 1 Diabetes Mellitus Patients.Sensors (Basel). 2019 Oct 18;19(20):4538. doi: 10.3390/s19204538. Sensors (Basel). 2019. PMID: 31635378 Free PMC article.
-
Diabetes: Non-Invasive Blood Glucose Monitoring Using Federated Learning with Biosensor Signals.Biosensors (Basel). 2025 Apr 16;15(4):255. doi: 10.3390/bios15040255. Biosensors (Basel). 2025. PMID: 40277568 Free PMC article.
-
Pain-Free Blood Glucose Monitoring Using Wearable Sensors: Recent Advancements and Future Prospects.IEEE Rev Biomed Eng. 2018;11:21-35. doi: 10.1109/RBME.2018.2822301. Epub 2018 Apr 2. IEEE Rev Biomed Eng. 2018. PMID: 29993663 Review.
Cited by
-
Role of Machine Learning Assisted Biosensors in Point-of-Care-Testing For Clinical Decisions.ACS Sens. 2024 Sep 27;9(9):4495-4519. doi: 10.1021/acssensors.4c01582. Epub 2024 Aug 15. ACS Sens. 2024. PMID: 39145721 Free PMC article. Review.
-
Non-Invasive Glucose Sensing Technologies and Products: A Comprehensive Review for Researchers and Clinicians.Sensors (Basel). 2023 Nov 12;23(22):9130. doi: 10.3390/s23229130. Sensors (Basel). 2023. PMID: 38005523 Free PMC article. Review.
-
Multimodal In-Vehicle Hypoglycemia Warning for Drivers With Type 1 Diabetes: Design and Evaluation in Simulated and Real-World Driving.JMIR Hum Factors. 2024 Apr 18;11:e46967. doi: 10.2196/46967. JMIR Hum Factors. 2024. PMID: 38635313 Free PMC article. Clinical Trial.
-
Development of Non-Invasive Continuous Glucose Prediction Models Using Multi-Modal Wearable Sensors in Free-Living Conditions.Sensors (Basel). 2025 May 20;25(10):3207. doi: 10.3390/s25103207. Sensors (Basel). 2025. PMID: 40431999 Free PMC article.
-
AI-Based Noninvasive Blood Glucose Monitoring: Scoping Review.J Med Internet Res. 2024 Nov 19;26:e58892. doi: 10.2196/58892. J Med Internet Res. 2024. PMID: 39561353 Free PMC article.
References
-
- Huang J., Zhang Y., Wu J. Review of non-invasive continuous glucose monitoring based on impedance spectroscopy. Sens. Actuators A Phys. 2020;311:112103. doi: 10.1016/j.sna.2020.112103. - DOI
MeSH terms
Substances
LinkOut - more resources
Full Text Sources
