

A Panel of E2F Target Gene Signature Predicting the Prognosis of Hepatocellular Carcinoma
- PMID: 35591857
- PMCID: PMC9110819
- DOI: 10.3389/fgene.2022.879299
A Panel of E2F Target Gene Signature Predicting the Prognosis of Hepatocellular Carcinoma
Abstract
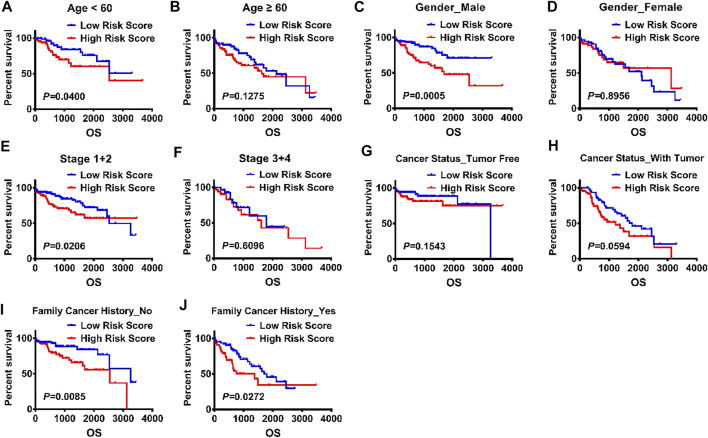
Hepatocellular carcinoma is one of the most malignant tumors, and the therapeutic effects of traditional treatments are poor. It is urgent to explore and identify new biomarkers and therapeutic targets to develop novel treatments which are individualized and effective. Three hallmarks, including E2F targets, G2M checkpoint and DNA repair, were collected by GSEA analysis. The panel of E2F-related gene signature consisted of five genes: HN1, KIF4A, CDCA3, CDCA8 and SSRP1. They had various mutation rates ranging from 0.8 to 5% in hepatocellular carcinoma, and patients with gene mutation had poorer prognosis. Among these genes, HN1 has the greatest mutation rate, and SSRP1 has the greatest impact on the model with a B (COX) value of 0.8842. Patients with higher expression of these genes had poorer prognosis. Kaplan-Meier curves in stratified survival analysis confirmed that patients with high risk scores had poor prognosis (p < 0.05). The results of univariate and multivariate COX survival analysis showed that risk score was closely related to the overall survival of patients with hepatocellular carcinoma. For clinical validation, we found that all the genes in the model were upregulated in hepatocellular carcinoma tissues compared to normal liver tissues, which was consistent with the previous results we obtained. Our study demonstrated that a panel of E2F target genes signature including five genes could predict the prognosis of hepatocellular carcinoma. This panel gene signature can facilitate the development of individualized and effective treatment for hepatocellular carcinoma.
Keywords: E2F target gene; gene signature; hepatocellular carcinoma; prognosis; risk.
Copyright © 2022 Hu, Shi, Han, Liu, Cao, Shi and Zhu.
Conflict of interest statement
The authors declare that the research was conducted in the absence of any commercial or financial relationships that could be construed as a potential conflict of interest.
Figures


Similar articles
-
Three E2F target-related genes signature for predicting prognosis, immune features, and drug sensitivity in hepatocellular carcinoma.Front Mol Biosci. 2023 Oct 3;10:1266515. doi: 10.3389/fmolb.2023.1266515. eCollection 2023. Front Mol Biosci. 2023. PMID: 37854038 Free PMC article.
-
Identification and characterization of a 25-lncRNA prognostic signature for early recurrence in hepatocellular carcinoma.BMC Cancer. 2021 Oct 30;21(1):1165. doi: 10.1186/s12885-021-08827-z. BMC Cancer. 2021. PMID: 34717566 Free PMC article.
-
Five metastasis-related mRNAs signature predicting the survival of patients with liver hepatocellular carcinoma.BMC Cancer. 2021 Jun 11;21(1):693. doi: 10.1186/s12885-021-08431-1. BMC Cancer. 2021. PMID: 34116652 Free PMC article.
-
A Novel Gene Signature Associated With "E2F Target" Pathway for Predicting the Prognosis of Prostate Cancer.Front Mol Biosci. 2022 Apr 13;9:838654. doi: 10.3389/fmolb.2022.838654. eCollection 2022. Front Mol Biosci. 2022. PMID: 35495629 Free PMC article.
-
Development and validation of a robust epithelial-mesenchymal transition (EMT)-related prognostic signature for hepatocellular carcinoma.Clin Res Hepatol Gastroenterol. 2021 Sep;45(5):101587. doi: 10.1016/j.clinre.2020.101587. Epub 2021 Mar 1. Clin Res Hepatol Gastroenterol. 2021. PMID: 33662631
Cited by
-
Mesothelin (MSLN) is Highly Expressed in Triple Negative Breast Cancer and is Associated with Enhanced Cell Proliferation and Proinflammatory Tumor Microenvironment.Ann Surg Oncol. 2025 Jun;32(6):4476-4486. doi: 10.1245/s10434-025-17117-y. Epub 2025 Mar 13. Ann Surg Oncol. 2025. PMID: 40080368
-
Machine learning analysis identified NNMT as a potential therapeutic target for hepatocellular carcinoma based on PCD-related genes.Sci Rep. 2025 Mar 3;15(1):7494. doi: 10.1038/s41598-025-91625-5. Sci Rep. 2025. PMID: 40032894 Free PMC article.
-
[Dealcoholized red wine inhibits occurrence and progression of hepatocellular carcinoma possibly by inducing cell cycle arrest and apoptosis].Nan Fang Yi Ke Da Xue Xue Bao. 2023 Aug 20;43(8):1297-1305. doi: 10.12122/j.issn.1673-4254.2023.08.05. Nan Fang Yi Ke Da Xue Xue Bao. 2023. PMID: 37712265 Free PMC article. Chinese.
-
Molecular Subtyping of Hepatocellular Carcinoma via Lysosome-Related Genes for Prognosis and Therapy Prediction.Int J Gen Med. 2025 Jul 16;18:3933-3950. doi: 10.2147/IJGM.S490019. eCollection 2025. Int J Gen Med. 2025. PMID: 40692584 Free PMC article.
-
Three E2F target-related genes signature for predicting prognosis, immune features, and drug sensitivity in hepatocellular carcinoma.Front Mol Biosci. 2023 Oct 3;10:1266515. doi: 10.3389/fmolb.2023.1266515. eCollection 2023. Front Mol Biosci. 2023. PMID: 37854038 Free PMC article.
References
-
- Di Sandro S., Centonze L., Centonze L., Pinotti E., Lauterio A., De Carlis R., et al. (2019). Surgical and Oncological Outcomes of Hepatic Resection for BCLC-B Hepatocellular Carcinoma: a Retrospective Multicenter Analysis Among 474 Consecutive Cases. Updates Surg. 71, 285–293. 10.1007/s13304-019-00649-w - DOI - PubMed
LinkOut - more resources
Full Text Sources
Research Materials
Miscellaneous