. 2022 May 3:9:863141.
doi: 10.3389/fmolb.2022.863141. eCollection 2022.

Disordered-Ordered Protein Binary Classification by Circular Dichroism Spectroscopy

Affiliations

Disordered-Ordered Protein Binary Classification by Circular Dichroism Spectroscopy

András Micsonai et al. Front Mol Biosci. .

Abstract

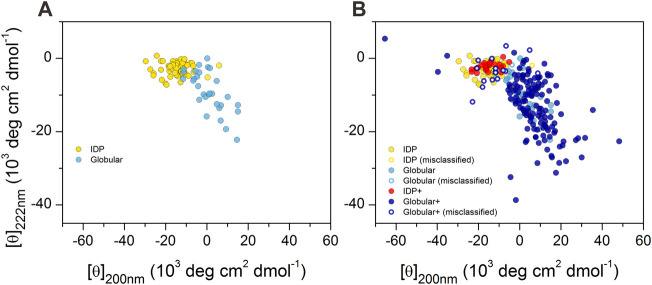
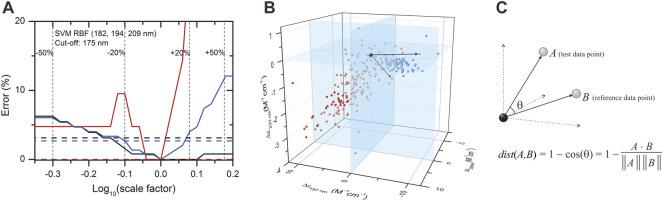
Intrinsically disordered proteins lack a stable tertiary structure and form dynamic conformational ensembles due to their characteristic physicochemical properties and amino acid composition. They are abundant in nature and responsible for a large variety of cellular functions. While numerous bioinformatics tools have been developed for in silico disorder prediction in the last decades, there is a need for experimental methods to verify the disordered state. CD spectroscopy is widely used for protein secondary structure analysis. It is usable in a wide concentration range under various buffer conditions. Even without providing high-resolution information, it is especially useful when NMR, X-ray, or other techniques are problematic or one simply needs a fast technique to verify the structure of proteins. Here, we propose an automatized binary disorder-order classification method by analyzing far-UV CD spectroscopy data. The method needs CD data at only three wavelength points, making high-throughput data collection possible. The mathematical analysis applies the k-nearest neighbor algorithm with cosine distance function, which is independent of the spectral amplitude and thus free of concentration determination errors. Moreover, the method can be used even for strong absorbing samples, such as the case of crowded environmental conditions, if the spectrum can be recorded down to the wavelength of 212 nm. We believe the classification method will be useful in identifying disorder and will also facilitate the growth of experimental data in IDP databases. The method is implemented on a webserver and freely available for academic users.

Keywords: CD spectroscopy; disorder identifier; disorder–order classification; intrinsically disordered proteins; machine learning; protein secondary structure.


Conflict of interest statement

The authors declare that the research was conducted in the absence of any commercial or financial relationships that could be construed as a potential conflict of interest.

Figures

FIGURE 1
FIGURE 1
2D-plot of CD data of IDPs and ordered proteins. (A) Mean residue ellipticities at 200 and 222 nm wavelengths for IDPs (yellow) and globular proteins (light blue) were collected from the literature for proteins previously studied by Uversky (2002), Uversky (2003), Uversky and Fink (2004). “Random coil” and “premolten globule” types of IDPs were not distinguished in our work. (B) Plot of the full reference database. IDPs over the ones presented in (A) are shown in red, while the additional globular ones are shown in dark blue. Hollow circles show those proteins that are incorrectly classified as disordered or ordered by using the 200 and 222 nm wavelength data of proteins presented in panel A as training set for disordered–ordered classification (see later). Note the large spectral (and conformational) space covered by the ordered proteins.
FIGURE 2
FIGURE 2
CD spectra of disordered proteins and some globular proteins with similar spectra. Proteins rich in highly twisted antiparallel β-sheets (colored spectra and corresponding structures) exhibit CD spectra reminiscent of disordered proteins (gray), which makes the distinction between them difficult. Alpha-chymotrypsin (PDB ID: 5CHA), chymotrypsinogen (2CGA), trypsin inhibitor (5PTI), elastase (3EST), ferredoxin (2FDN), ecotin (1ECZ), dUTP pyrophosphatase (1Q5U), and trypsin inhibitor (Kunitz) (1BA7) are shown.
FIGURE 3
FIGURE 3
Effect of concentration error on disordered–ordered classification and introduction of the KNN-cosine method. (A) Error of the SVM–RBF algorithm as a function of the scaling factor on the spectra of the database with 175 nm cutoff are shown for disordered (red) and ordered (black) structures. The global error is shown in blue. Dashed lines show the errors of classification using the KNN-cosine algorithm for disordered (red), ordered (black), and the overall error (blue). For convenience, ±20% and ±50% changes in the concentration (i.e., in the scaling factor) are shown. (B) Reference points in the space determined by the CD data measured at 197, 206, and 233 nm wavelengths and an example for vectors by using the KNN-cosine method. Red and blue points represent ordered and disordered proteins, respectively. (C) The distance metric of this KNN algorithm uses the cosine of the angle between vectors pointing from the origin to data points. The prediction is based on the labels (ordered/disordered) of the first 10 reference points with the lowest “distance” from the test point. The direction and the angles of the vectors will not change with scaling, that is, the method is independent of concentration errors.
FIGURE 4
FIGURE 4
Accuracy of the KNN-cosine method as a function of wavelength cutoff. Error on disordered (red) and ordered (black) proteins and the global error (blue) are shown with solid curves for the original spectra and with dashed and dotted lines for spectra with added noise of σ = 0.05 and 0.1 M−1cm−1, respectively. Up to 197 nm cutoff, the “197-206-233 nm” triplet and above 197 nm, the “212-217-225 nm” triplet were used for analysis.
FIGURE 5
FIGURE 5
Case studies showing the structural variability of individual proteins, which can only be revealed experimentally. (A) CD spectrum of α-synuclein in water is characteristic of a fully disordered chain. In 30% TFE, the protein exhibits an ordered, α-helix-rich conformation, and at higher concentrations (10 mg/ml), it readily forms oligomers with a spectral shape of β-structure. (B) In the native state, β2-microglobulin (β2m) exhibits a β-sandwich fold of an antiparallel β-structure. At low pH or in 3 M GdnHCl, its structure becomes disordered. (C) ERD14 disordered plant chaperone and its artificial pair consisting of the full scrambled sequence both exhibit disordered structure in water. The presence of 30% TFE induces the formation of α-helix in the wild-type protein, while its scrambled variant preserves its disordered conformation. For (C), experimental data modified from Murvai et al. (2021) were used with the authors’ permission. The results of the binary classification are shown by O (ordered) and D (disordered) letters in the figures.

Similar articles

Cited by

References

    1. Adler A. J., Greenfield N. J., Fasman G. D. (1973). [27] Circular Dichroism and Optical Rotatory Dispersion of Proteins and Polypeptides. Methods Enzymol. 27, 675–735. 10.1016/s0076-6879(73)27030-1 - DOI - PubMed
    1. Anthis N. J., Clore G. M. (2013). Sequence-specific Determination of Protein and Peptide Concentrations by Absorbance at 205 Nm. Protein Sci. 22 (6), 851–858. 10.1002/pro.2253 - DOI - PMC - PubMed
    1. Banks A., Qin S., Weiss K. L., Stanley C. B., Zhou H.-X. (2018). Intrinsically Disordered Protein Exhibits Both Compaction and Expansion under Macromolecular Crowding. Biophysical J. 114 (5), 1067–1079. 10.1016/j.bpj.2018.01.011 - DOI - PMC - PubMed
    1. Chen G. C., Yang J. T. (1977). Two-Point Calibration of Circular Dichrometer with D-10-Camphorsulfonic Acid. Anal. Lett. 10 (14), 1195–1207. 10.1080/00032717708067855 - DOI
    1. Dunker A. K., Obradovic Z., Romero P., Garner E. C., Brown C. J. (2000). Intrinsic Protein Disorder in Complete Genomes. Genome Inform. Ser. Workshop Genome Inform. 11, 161–171. - PubMed

LinkOut - more resources