

Social Contacts and Transmission of COVID-19 in British Columbia, Canada
- PMID: 35592086
- PMCID: PMC9110764
- DOI: 10.3389/fpubh.2022.867425
Social Contacts and Transmission of COVID-19 in British Columbia, Canada
Abstract
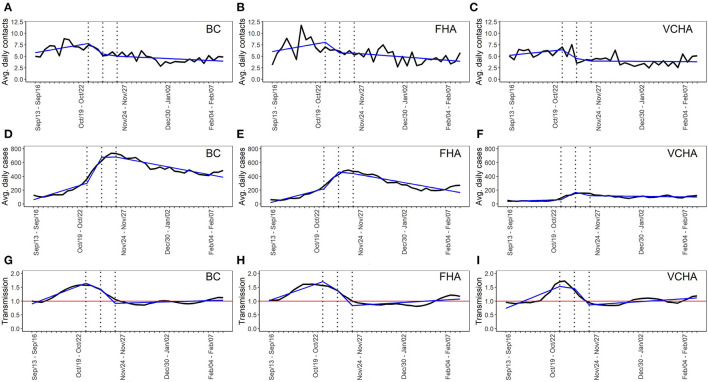
Background: Close-contact rates are thought to be a driving force behind the transmission of many infectious respiratory diseases. Yet, contact rates and their relation to transmission and the impact of control measures, are seldom quantified. We quantify the response of contact rates, reported cases and transmission of COVID-19, to public health contact-restriction orders, and examine the associations among these three variables in the province of British Columbia, Canada.
Methods: We derived time series data for contact rates, daily cases and transmission of COVID-19 from a social contacts survey, reported case counts and by fitting a transmission model to reported cases, respectively. We used segmented regression to investigate impacts of public health orders; Pearson correlation to determine associations between contact rates and transmission; and vector autoregressive modeling to quantify lagged associations between contacts rates, daily cases, and transmission.
Results: Declines in contact rates and transmission occurred concurrently with the announcement of public health orders, whereas declines in cases showed a reporting delay of about 2 weeks. Contact rates were a significant driver of COVID-19 and explained roughly 19 and 20% of the variation in new cases and transmission, respectively. Interestingly, increases in COVID-19 transmission and cases were followed by reduced contact rates: overall, daily cases explained about 10% of the variation in subsequent contact rates.
Conclusion: We showed that close-contact rates were a significant time-series driver of transmission and ultimately of reported cases of COVID-19 in British Columbia, Canada and that they varied in response to public health orders. Our results also suggest possible behavioral feedback, by which increased reported cases lead to reduced subsequent contact rates. Our findings help to explain and validate the commonly assumed, but rarely measured, response of close contact rates to public health guidelines and their impact on the dynamics of infectious diseases.
Keywords: COVID-19; correlation; regression; social contacts; transmission control.
Copyright © 2022 Ringa, Iyaniwura, David, Irvine, Adu, Spencer, Janjua and Otterstatter.
Conflict of interest statement
The authors declare that the research was conducted in the absence of any commercial or financial relationships that could be construed as a potential conflict of interest.
Figures

Similar articles
-
Symptomatic and Asymptomatic Transmission of SARS-CoV-2 in K-12 Schools, British Columbia, Canada April to June 2021.Microbiol Spectr. 2022 Aug 31;10(4):e0062222. doi: 10.1128/spectrum.00622-22. Epub 2022 Jul 6. Microbiol Spectr. 2022. PMID: 35862938 Free PMC article.
-
Emergence of SARS-CoV-2 Delta Variant and Effect of Nonpharmaceutical Interventions, British Columbia, Canada.Emerg Infect Dis. 2023 Oct;29(10):1999-2007. doi: 10.3201/eid2910.230055. Epub 2023 Aug 28. Emerg Infect Dis. 2023. PMID: 37640374 Free PMC article.
-
COVID-19 in a remote First Nations community in British Columbia, Canada: an outbreak report.CMAJ Open. 2021 Nov 30;9(4):E1073-E1079. doi: 10.9778/cmajo.20210054. Print 2021 Oct-Dec. CMAJ Open. 2021. PMID: 34848548 Free PMC article.
-
Impact of COVID-19-related public health measures on HCV testing in British Columbia, Canada: An interrupted time series analysis.Liver Int. 2021 Dec;41(12):2849-2856. doi: 10.1111/liv.15074. Epub 2021 Oct 13. Liver Int. 2021. PMID: 34592046 Free PMC article.
-
Mathematical modeling of COVID-19 in British Columbia: An age-structured model with time-dependent contact rates.Epidemics. 2022 Jun;39:100559. doi: 10.1016/j.epidem.2022.100559. Epub 2022 Apr 9. Epidemics. 2022. PMID: 35447505 Free PMC article.
Cited by
-
Cohort profile: the British Columbia COVID-19 Population Mixing Patterns Survey (BC-Mix).BMJ Open. 2022 Aug 24;12(8):e056615. doi: 10.1136/bmjopen-2021-056615. BMJ Open. 2022. PMID: 36002217 Free PMC article.
-
Uncertain SEIAR system dynamics modeling for improved community health management of respiratory virus diseases: A COVID-19 case study.Heliyon. 2024 Jan 26;10(3):e24711. doi: 10.1016/j.heliyon.2024.e24711. eCollection 2024 Feb 15. Heliyon. 2024. PMID: 38317963 Free PMC article.
-
Patterns of social mixing in England changed in line with restrictions during the COVID-19 pandemic (September 2020 to April 2022).Sci Rep. 2022 Jun 21;12(1):10436. doi: 10.1038/s41598-022-14431-3. Sci Rep. 2022. PMID: 35729196 Free PMC article.
-
Canada's provincial COVID-19 pandemic modelling efforts: A review of mathematical models and their impacts on the responses.Can J Public Health. 2024 Aug;115(4):541-557. doi: 10.17269/s41997-024-00910-9. Epub 2024 Jul 25. Can J Public Health. 2024. PMID: 39060710 Free PMC article. Review.
-
Contact patterns between index patients and their close contacts and assessing risk for COVID-19 transmission during different exposure time windows: a large retrospective observational study of 450 770 close contacts in Shanghai.BMJ Public Health. 2024 Apr 16;2(1):e000154. doi: 10.1136/bmjph-2023-000154. eCollection 2024 Jun. BMJ Public Health. 2024. PMID: 40018114 Free PMC article.
References
Publication types
MeSH terms
Grants and funding
LinkOut - more resources
Full Text Sources
Medical