. 2022 May 3:15:869799.
doi: 10.3389/fnmol.2022.869799. eCollection 2022.

Environmental Enrichment and Estrogen Upregulate Beta-Hydroxybutyrate Underlying Functional Improvement

Affiliations

Environmental Enrichment and Estrogen Upregulate Beta-Hydroxybutyrate Underlying Functional Improvement

Soonil Pyo et al. Front Mol Neurosci. .

Abstract

Environmental enrichment (EE) is a promising therapeutic strategy in improving metabolic and neuronal responses, especially due to its non-invasive nature. However, the exact mechanism underlying the sex-differential effects remains unclear. The aim of the current study was to investigate the effects of EE on metabolism, body composition, and behavioral phenotype based on sex. Long-term exposure to EE for 8 weeks induced metabolic changes and fat reduction. In response to the change in metabolism, the level of βHB were influenced by sex and EE possibly in accordance to the phases of estrogen cycle. The expression of β-hydroxybutyrate (βHB)-related genes and proteins such as monocarboxylate transporters, histone deacetylases (HDAC), and brain-derived neurotrophic factor (BDNF) were significantly regulated. In cerebral cortex and hippocampus, EE resulted in a significant increase in the level of βHB and a significant reduction in HDAC, consequently enhancing BDNF expression. Moreover, EE exerted significant effects on motor and cognitive behaviors, indicating a significant functional improvement in female mice under the condition that asserts the influence of estrogen cycle. Using an ovariectomized mice model, the effects of EE and estrogen treatment proved the hypothesis that EE upregulates β-hydroxybutyrate and BDNF underlying functional improvement in female mice. The above findings demonstrate that long-term exposure to EE can possibly alter metabolism by increasing the level of βHB, regulate the expression of βHB-related proteins, and improve behavioral function as reflected by motor and cognitive presentation following the changes in estrogen level. This finding may lead to a marked improvement in metabolism and neuroplasticity by EE and estrogen level.

Keywords: beta-hydroxybutyrate (β-HB); brain derived neurotrophic factor (BDNF); environmental enrichment (EE); estrogen; female; functional improvement; neuroplasticity; sex.


Conflict of interest statement

The authors declare that the research was conducted in the absence of any commercial or financial relationships that could be construed as a potential conflict of interest. The reviewer SK declared a shared affiliation with the authors to the handling editor at the time of review.

Figures

Figure 1
Figure 1
Differential metabolic change by sex sensitivity and exposure to EE in normal models. (A) The experimental scheme for normal models. (B) Body weight change at 2-week interval (n = 26 per group). The representative figures of (C) EE cage and (D) control cage. (E) The representative DXA image of each group. (F) Percentage fat in male and female mice exposed to control (CON) or enriched (EE) cages (n = 5 per group). After exposure to EE or control cage, blood biochemical analysis (n = 7 per group) and indirect calorimetry (n = 3 per group) were conducted. (G) Serum triglyceride. (H) Serum total cholesterol. (I) Respiratory exchange ratio. (J) Heat. Two-way ANOVA with Tukey multiple comparison test. Significant sex effect, significant housing effect, and the significant interaction between sex and housing were noted with p-value. Data are means ± SEM.
Figure 2
Figure 2
Differential βHB level by sex and exposure to EE in normal models. βHB enzyme-linked immunosorbent assay (ELISA) was conducted in serum (n = 10 per group), cerebral cortex (n = 6 per group), and hippocampus (n = 6 per group). (A) Serum βHB levels. (B) Further female subgroup analysis based on estrus cycle in serum βHB. (C) Cerebral cortex βHB and (D) Hippocampus βHB. Two-way ANOVA with Tukey multiple comparison test. Significant sex effect, significant housing effect, and the significant interaction between sex and housing were noted with p-value. Data are means ± SEM.
Figure 3
Figure 3
Effects of EE on the expression of βHB-related genes under the influence of estrogen by qRT-PCR. (A1–G1) Cerebral cortex and (A2–G2) hippocampus mRNA levels for βHB-related genes measured using qRT-PCR (n = 4 per group). All samples were run in triplicate. Two-way ANOVA with Tukey multiple comparison test. Significant sex effect, significant housing effect, and the significant interaction between sex and housing were noted with p-value. Data are means ± SEM. *p < 0.05, **p < 0.01, ***p < 0.001, and ****p < 0.0001.
Figure 4
Figure 4
Effects of EE on the expression of βHB-related proteins under the influence of estrogen by western blot. (A1–H1) Cerebral cortex and (A2–H2) hippocampus protein levels for βHB-related proteins measured using western blot (n = 4 per group). Two-way ANOVA with Tukey multiple comparison test. Significant sex effect, significant housing effect, and the significant interaction between sex and housing were noted with p-value. Data represented are means ± SEM.
Figure 5
Figure 5
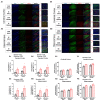
Effects of EE on the uptake of βHB in cerebral cortex and hippocampus under the influence of estrogen. Representative IHC images of (A1,A2) GFAP+MCT4+ in cerebral cortex and hippocampus and (B1,B2) MAP2+MCT2+ in the cerebral cortex and hippocampus (n = 4 per group). (C1–F1) Quantification of GFAP+MCT4+ and MAP2+MCT2+ in the cerebral cortex and hippocampus. (C2–F2) Raw intensity of GFAP and MAP2 in cerebral cortex and hippocampus. Two-way ANOVA with Tukey multiple comparison test. Significant sex effect, significant housing effect, and the significant interaction between sex and housing were noted with p-value. Data are means ± SEM.
Figure 6
Figure 6
Effects of EE on functional improvement in normal models. Behavioral test assessments conducted for the normal groups. (A) Rotarod accelerating from 4 to 80 rpm. (B) Rotarod at constant 48 rpm. (C) Rotarod at constant 64 rpm (n = 26 per group). *F-EE vs. M-EE, #F-EE vs. F-CON, $F-EE vs. M-CON, %M-EE vs. M-CON, and &M-EE vs. F-CON. (D) Number of alternative behaviors, (E) number of entries, and (F) percent alternation of Y-maze test (n = 10 per group). Two-way ANOVA with Tukey multiple comparison test. Significant sex effect, significant housing effect, and the significant interaction between sex and housing were noted with p-value. Data represented are means ± SEM. *p < 0.01, #p < 0.01, $p < 0.01, %p < 0.01, and &p < 0.01.
Figure 7
Figure 7
Differential metabolic change following estrogen treatment and exposure to EE in OVX models. (A) Experimental scheme for OVX models. (B) Body weight of OVX groups after the treatments (E2 and/or EE) (n = 10–18 per group). (C) Measurement of serum 17β-estradiol (n = 10–18 per group). (D) Representative DXA image from each group. (E) Percentage body fat (n = 6–8 per group). (F) Serum triglyceride (n = 7–9 per group). (G) Serum total cholesterol (n = 7–9 per group). (H) Respiratory exchange ratio (n = 5–6 per group). (I) Heat (n = 5–6 per group). One-way ANOVA with Tukey multiple comparison test. Data represented are means ± SEM. *p < 0.05, **p < 0.01, ***p < 0.001, and ****p < 0.0001.
Figure 8
Figure 8
Abnormal lipid accumulation was alleviated by exposure to EE and estrogen treatment in OVX mice. (A) The representative images of ORO-stained liver of the OVX groups, and (B) quantification thereof. (C) The representative images of H&E-stained liver of the OVX groups. The representative images of ORO-stained (D) cerebral cortex, (E) pia-mater, and (F) SVZ, and (G–I) quantification thereof, respectively (n = 4 per group). One-way ANOVA with Tukey multiple comparison test. Data represented are means ± SEM. *p < 0.05 and **p < 0.01. White bars = 50 μm.
Figure 9
Figure 9
Exposure to EE and estrogen treatment can increase the level of βHB in OVX mice. (A) Serum βHB (n = 6–9 per group). (B) Cerebral cortex βHB (n = 6 per group). (C) Hippocampus βHB (n = 6 per group). One-way ANOVA with Tukey multiple comparison test. Data represented are means ± SEM. *p < 0.05, **p < 0.01, and ***p < 0.001.
Figure 10
Figure 10
Synergistic effects of estrogen and EE on the expression of ketone-related genes by qRT-PCR. (A1–G1) Cerebral cortex and (A2–G2) hippocampus mRNA levels for βHB-related genes measured using qRT-PCR (n = 4 per group). All samples were run in triplicate. One-way ANOVA with Tukey multiple comparison test. Data represented are means ± SEM. *p < 0.05, **p < 0.01, ***p < 0.001, and ****p < 0.0001.
Figure 11
Figure 11
Synergistic effects of estrogen and EE on the expression of ketone-related proteins by western blot. (A1–H1) Cerebral cortex and (A2–H2) hippocampus protein levels for βHB-related proteins measured using western blot (n = 4 per group). One-way ANOVA with Tukey multiple comparison test. Data represented are means ± SEM. *p < 0.05, **p < 0.01, and ***p < 0.001.
Figure 12
Figure 12
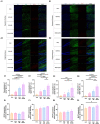
Synergistic effects of estrogen and EE on the uptake of βHB in cerebral cortex and hippocampus. Representative IHC images of (A1,A2) GFAP+MCT4+ in cerebral cortex and hippocampus and (B1,B2) MAP2+MCT2+ in the cerebral cortex and hippocampus (n = 4 per group). (C1–F1) Quantification of GFAP+MCT4+ and MAP2+MCT2+ in the cerebral cortex and hippocampus. (C2–F2) Raw intensity of GFAP and MAP2 in cerebral cortex and hippocampus. One-way ANOVA with Tukey multiple comparison test. Data represented are means ± SEM. *p < 0.05, **p < 0.01, ***p < 0.001, and ****p < 0.0001. A white bar = 50 μm.
Figure 13
Figure 13
Synergistic effects of estrogen and EE on functional improvement in OVX models. Behavioral test assessments conducted in the OVX groups. (A) Hanging wire test, hippocampus (n = 8–15 per group). (B) Open field test (n = 6–12 per group). (C) Number of alternative behaviors, (D) number of entries, and (E) percent alternation of Y-maze test (8–15 per group). One-way ANOVA with Tukey multiple comparison test. Data represented are means ± SEM. *p < 0.05, **p < 0.01, ***p < 0.001, and ****p < 0.0001.

Similar articles

Cited by

References

    1. Achanta L. B., Rae C. D. (2017). Beta-hydroxybutyrate in the brain: one molecule, multiple mechanisms. Neurochem. Res. 42, 35–49. 10.1007/s11064-016-2099-2 - DOI - PubMed
    1. Allman B. R., Morrissey M. C., Kim J. S., Panton L. B., Contreras R. J., Hickner R. C., et al. . (2019). Fat metabolism and acute resistance exercise in trained women. J. Appl. Physiol. 126, 739–745. 10.1152/japplphysiol.00752.2018 - DOI - PubMed
    1. Balasse E. O., Fery F. (1989). Ketone body production and disposal: effects of fasting, diabetes, and exercise. Diabetes Metab. Rev. 5, 247–270. 10.1002/dmr.5610050304 - DOI - PubMed
    1. Ballestri S., Nascimbeni F., Baldelli E., Marrazzo A., Romagnoli D., Lonardo A. (2017). NAFLD as a sexual dimorphic disease: role of gender and reproductive status in the development and progression of nonalcoholic fatty liver disease and inherent cardiovascular risk. Adv. Ther. 34, 1291–1326. 10.1007/s12325-017-0556-1 - DOI - PMC - PubMed
    1. Benjamin D., Robay D., Hindupur S. K., Pohlmann J., Colombi M., El-Shemerly M. Y., et al. . (2018). Dual inhibition of the lactate transporters MCT1 and MCT4 is synthetic lethal with metformin due to NAD+ depletion in cancer cells. Cell Rep. 25, 3047–3058.e4. 10.1016/j.celrep.2018.11.043 - DOI - PMC - PubMed

LinkOut - more resources