

Pyrroloquinoline Quinone Regulates Enteric Neurochemical Plasticity of Weaned Rats Challenged With Lipopolysaccharide
- PMID: 35592257
- PMCID: PMC9112857
- DOI: 10.3389/fnins.2022.878541
Pyrroloquinoline Quinone Regulates Enteric Neurochemical Plasticity of Weaned Rats Challenged With Lipopolysaccharide
Abstract
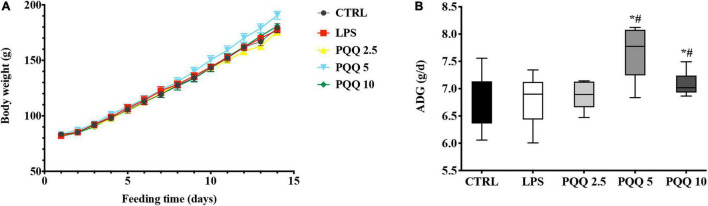
The enteric nervous system (ENS) is important for the intestinal barrier to defend and regulate inflammation in the intestine. The aim of this study was to investigate the effect of pyrroloquinoline quinone (PQQ) on regulating neuropeptide secretion by ENS neurons of rats challenged with lipopolysaccharide (LPS) to create enteritis. Thirty Sprague Dawley rats were divided into five groups, namely, basal (CTRL), basal plus LPS challenge (LPS), basal with 2.5 mg/kg b.w./day of PQQ plus challenge with LPS (PQQ 2.5), basal with 5.0 mg/kg b.w./day PQQ plus challenge with LPS (PQQ 5), and basal with 10.0 mg/kg b.w./day PQQ plus challenge with LPS (PQQ 10). After treatment with basal diet or PQQ for 14 days, rats were challenged with LPS except for the CTRL group. Rats were euthanized 6 h after the LPS challenge. Rats showed an increased average daily gain in PQQ treatment groups (P < 0.05). Compared with the LPS group, PQQ 5 and PQQ 10 rats showed increased villus height and villus height/crypt depth of jejunum (P < 0.05). In PQQ treatment groups, concentrations of IL-1β and TNF-α in serum and intestine of rats were decreased, and IL-10 concentration was increased in serum compared with the LPS group (P < 0.05). Compared with the LPS group, the concentration of neuropeptide Y (NPY), nerve growth factor (NGF), vasoactive intestinal peptide (VIP), substance P (SP), calcitonin gene-related peptide (CGRP), and brain-derived neurotropic factor (BDNF) in serum were decreased in PQQ treatment groups (P < 0.05). Compared with the LPS group, ileal mRNA levels of BDNF, NPY, and NGF were decreased in PQQ treatment groups (P < 0.05). Jejunal concentrations of SP, CGRP, VIP, BDNF, NPY, and NGF were decreased in PQQ treatment groups compared with the LPS group (P < 0.05). Compared with the LPS group, phosphor-protein kinase B (p-Akt)/Akt levels in jejunum and colon were decreased in PQQ treatment groups (P < 0.05). In conclusion, daily treatment with PQQ improved daily gain, jejunal morphology, immune responses. PQQ-regulated enteric neurochemical plasticity of ENS via the Akt signaling pathway of weaned rats suffering from enteritis.
Keywords: Akt signaling pathway; enteric nervous system; enteritis rats; neurochemical plasticity; pyrroloquinoline quinone.
Copyright © 2022 Shi, Xu, Huang, Wang, Wang, Ming, Yin, Liu and Wang.
Conflict of interest statement
The authors declare that the research was conducted in the absence of any commercial or financial relationships that could be construed as a potential conflict of interest.
Figures


Similar articles
-
Dietary supplementation with pyrroloquinoline quinone promotes growth, relieves weaning stress, and regulates metabolism of piglets compared with adding zinc oxide.Anim Nutr. 2023 Oct 4;15:409-419. doi: 10.1016/j.aninu.2023.06.015. eCollection 2023 Dec. Anim Nutr. 2023. PMID: 38046955 Free PMC article.
-
Pyrroloquinoline Quinone Alleviates Intestinal Inflammation and Cell Apoptosis via the MKK3/6-P38 Pathway in a Piglet Model.Int J Mol Sci. 2024 Sep 8;25(17):9723. doi: 10.3390/ijms25179723. Int J Mol Sci. 2024. PMID: 39273669 Free PMC article.
-
Pyrroloquinoline quinone regulates glycolipid metabolism in the jejunum via inhibiting AMPK phosphorylation of weaned pigs.Food Funct. 2022 Sep 22;13(18):9610-9621. doi: 10.1039/d2fo00281g. Food Funct. 2022. PMID: 36004536
-
Pyrroloquinoline quinone supplementation attenuates inflammatory liver injury by STAT3/TGF-β1 pathway in weaned piglets challenged with lipopolysaccharide.Br J Nutr. 2024 Apr 28;131(8):1352-1361. doi: 10.1017/S0007114523002970. Epub 2023 Dec 29. Br J Nutr. 2024. PMID: 38155410
-
Pyrroloquinoline Quinone Alleviates Jejunal Mucosal Barrier Function Damage and Regulates Colonic Microbiota in Piglets Challenged With Enterotoxigenic Escherichia coli.Front Microbiol. 2020 Jul 24;11:1754. doi: 10.3389/fmicb.2020.01754. eCollection 2020. Front Microbiol. 2020. PMID: 32849383 Free PMC article.
Cited by
-
Dietary supplementation with pyrroloquinoline quinone promotes growth, relieves weaning stress, and regulates metabolism of piglets compared with adding zinc oxide.Anim Nutr. 2023 Oct 4;15:409-419. doi: 10.1016/j.aninu.2023.06.015. eCollection 2023 Dec. Anim Nutr. 2023. PMID: 38046955 Free PMC article.
-
Rice Water-Fried Atractylodis Rhizoma Relieves Spleen Deficiency Diarrhea by Regulating the Intestinal Microbiome.Oxid Med Cell Longev. 2023 Feb 7;2023:1983616. doi: 10.1155/2023/1983616. eCollection 2023. Oxid Med Cell Longev. 2023. PMID: 36798685 Free PMC article.
-
Pyrroloquinoline Quinone Alleviates Intestinal Inflammation and Cell Apoptosis via the MKK3/6-P38 Pathway in a Piglet Model.Int J Mol Sci. 2024 Sep 8;25(17):9723. doi: 10.3390/ijms25179723. Int J Mol Sci. 2024. PMID: 39273669 Free PMC article.
References
LinkOut - more resources
Full Text Sources
Research Materials
Miscellaneous