. 2022 May 3:13:875692.
doi: 10.3389/fimmu.2022.875692. eCollection 2022.

Clinical, Virological and Immunological Subphenotypes in a Cohort of Early Treated HIV-Infected Children

Affiliations

Clinical, Virological and Immunological Subphenotypes in a Cohort of Early Treated HIV-Infected Children

Sara Domínguez-Rodríguez et al. Front Immunol. .

Abstract

Background: Identifying subphenotypes within heterogeneous diseases may have an impact in terms of therapeutic options. In this study, we aim to assess different subphenotypes in children living with human immunodeficiency virus (HIV-1), according to the clinical, virological, and immunological characteristics.

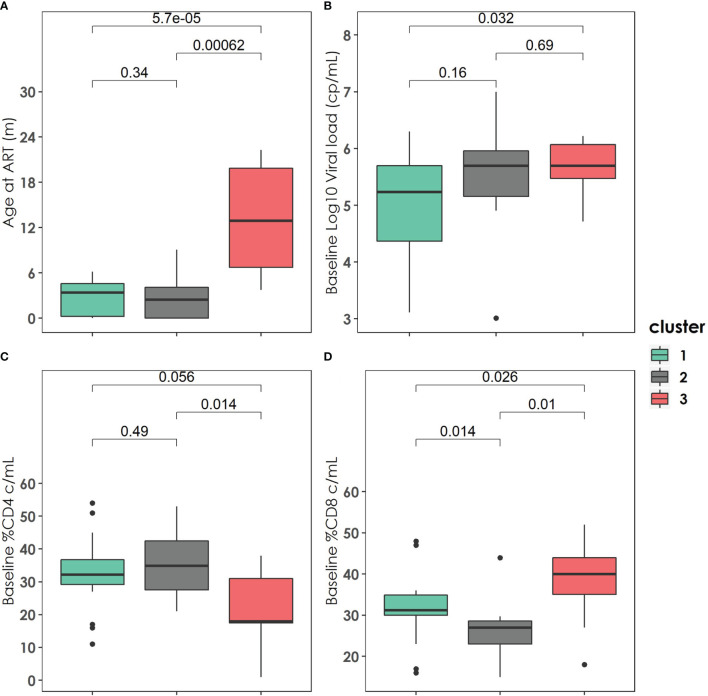
Methods: We collected clinical and sociodemographic data, baseline viral load (VL), CD4 and CD8 count and percentage, age at initiation of ART, HIV DNA reservoir size in peripheral blood mononuclear cells (PBMCs), cell-associated RNA (CA-RNA), ultrasensitive VL, CD4 subsets (T effector CD25+, activated memory cells, Treg cells), humoral-specific HIV response (T-bet B cells), innate response (CD56dim natural killer (NK) cells, NKp46+, perforin), exhaustion markers (PD-1, PD-L1, DNAM), CD8 senescence, and biomarkers for T-lymphocyte thymic output (TREC) and endothelial activation (VCAM). The most informative variables were selected using an unsupervised lasso-type penalty selection for sparse clustering. Hierarchical clustering was performed using Pearson correlation as the distance metric and WARD.D2 as the clustering method. Internal validation was applied to select the best number of clusters. To compare the characteristics among clusters, boxplot and Kruskal Wallis test were assessed.

Results: Three subphenotypes were discovered (cluster1: n=18, 45%; cluster2: n=11, 27.5%; cluster3: n=11, 27.5%). Patients in cluster1 were treated earlier, had higher baseline %CD4, low HIV reservoir size, low western blot score, higher TREC values, and lower VCAM values than the patients in the other clusters. In contrast, cluster3 was the less favorable. Patients were treated later and presented poorer outcomes with lower %CD4, and higher reservoir size, along with a higher percentage of CD8 immunosenescent cells, lower TREC, higher VCAM cytokine, and a higher %CD4 PD-1. Cluster2 was intermediate. Patients were like those of cluster1, but had lower levels of t-bet expression and higher HIV DNA reservoir size.

Conclusions: Three HIV pediatric subphenotypes with different virological and immunological features were identified. The most favorable cluster was characterized by a higher rate of immune reconstitution and a slower disease progression, and the less favorable with more senescence and high reservoir size. In the near future therapeutic interventions for a path of a cure might be guided or supported by the different subphenotypes.

Keywords: HIV; immune signatures; pediatric; perinatal; reservoir; subphenotypes; viral dynamics.


Conflict of interest statement

The authors declare that the research was conducted in the absence of any commercial or financial relationships that could be construed as a potential conflict of interest.

Figures

Figure 1
Figure 1
Hierarchical Clustering of all patients based on the clinical, immunological, and virological features. Columns on heatmap represent patient features. Rows are each of the subjects in the study (n = 40). Normalized values are plotted: red color means higher values; blue color means lower values. ART, antiretroviral therapy; VL, viral load; TREC, T-cell receptor excision circle; Undetectable, ≤10copies/mL; Detectable >10 copies/mL.
Figure 2
Figure 2
Baseline clinical, immunological, and virological characteristics of the three clusters described. (A) Age at antiretroviral treatment distribution among the three clusters. (B) Baseline Log10 Viral load (copies/mL) distribution among the three clusters. (C) Baseline % CD4 (cell/mL) distribution among the three clusters. (D) Baseline %CD8 (cell/mL) distribution among the three clusters. P-values were calculated using U-Mann Whitney Test and Kruskal-Wallis test when appropriate.
Figure 3
Figure 3
Virological characteristics and Western-Blot score of the three clusters described at the end of the follow up. (A) Total HIV reservoir size (copies/mL) on PBMC distribution among the clusters. (B) HIV DNA reservoir size on %CD4 distribution among the clusters. (C) Cell Associated RNA at LTR region (copies/mL) distribution among the clusters. (D) Cell Associated RNA at pol region (copies/mL distribution among the clusters). (E) Western blot score distribution among the clusters. (F) Ultrasensitive viral load measurement distribution among the clusters. PBMC: peripheral blood mononuclear cell. P-values were calculated using U-Mann Whitney Test and Kruskal-Wallis test when appropriate.
Figure 4
Figure 4
Immunological characteristics of the three clusters described. (A) Percentage of immunosenescent CD4 cells among the clusters. (B) Percentage of immunosenescent CD8 cells among the clusters. (C) Percentage of immunoactivated CD4 cells among the clusters. (D) Percentage of immunoactivated CD8 cells among the clusters. (E) Relative Telomere length of percentage of CD4 cells among the clusters. (F) Relative Telomere relative length of percentage of CD8 cells among the clusters. (G) TREC (T-cell receptor rearrangement excision circle) levels/105 PBMC among the clusters. (H) PDL-1 expression among the clusters. (I) IL-10 (pg/mL) expression among the clusters. (J) IL-6 (pg/mL) expression among the clusters. (K) TFN-alpha (pg/mL) expression among the clusters. (L) PD-1expression among the clusters. (M) MCP-1 (pg/mL) expression among the clusters. (N) VCAM (pg/mL) expression among the clusters. (O) Percentage of Effector CD4 T cell expression CD38- HLA-DR+ among the clusters. (P) Percentage of CD4 expression CD45RO+ CD27+ TTM ICOS+ among the clusters. (Q) Percentage of CD4 CD45RO+ CD27+ TTM CD38+ HLA-DR+ among the clusters. (R) Percentage of Effector CD4 CD25+ among the clusters. (S) Percentage of Effector CD4 TIGIT receptor among the clusters. (T) Percentage of CD4 TIGIT receptor among the clusters. (U) Percentage of CD8 Naïve TIGIT receptor among the clusters. (V) Percentage of CD4 CD40-L among the clusters. (W) Percentage of CD4 PD-1 among the clusters. (X) Distribution of Naïve CD4 T-bet expression among the clusters. (Y) Distribution of Activated memory CD4 T-bet expression among the clusters. (Z) Distribution of Resting memory IgD- IgM- IgG- T-bet expression among the clusters. (AA) Distribution of IgD- CD27- T-bet expression among the clusters. (AB) Distribution of CD19+CD10-IgD-IgG-IgM+ T-bet expression among the clusters. P-values were calculated using Kruskal-Wallis test.
Figure 5
Figure 5
Distribution of Natural Killer (NK) subpopulations within the clusters described. (A) Total percentage of NK on peripheral blood lymphocytes distribution among the clusters. (B) Percentage of NKp46 distribution among the clusters. (C) Percentage of CD56dim distribution among the clusters. (D) CD107 not-stimulated distribution among the clusters. P-values were calculated using U-Mann Whitney Test and Kruskal-Wallis test when appropriate.

References

    1. Sekaly R-P. The Failed HIV Merck Vaccine Study: A Step Back or a Launching Point for Future Vaccine Development? J Exp Med (2008) 205:7–12. doi: 10.1084/jem.20072681 - DOI - PMC - PubMed
    1. Bachmann N, von Siebenthal C, Vongrad V, Turk T, Neumann K, Beerenwinkel N, et al. . Determinants of HIV-1 Reservoir Size and Long-Term Dynamics During Suppressive ART. Nat Commun (2019) 10:3193. doi: 10.1038/s41467-019-10884-9 - DOI - PMC - PubMed
    1. Letvin NL. Progress and Obstacles in the Development of an AIDS Vaccine. Nat Rev Immunol (2006) 6:930–9. doi: 10.1038/nri1959 - DOI - PubMed
    1. Check Hayden E. HIV Vaccine Failure Explained? Nat Rev Immunol (2008) 6:930–9. doi: 10.1038/NEWS.2008.1208 - DOI
    1. Parisi SG, Sarmati L, Andreis S, Scaggiante R, Cruciani M, Ferretto R, et al. . Strong and Persistent Correlation Between Baseline and Follow-Up HIV-DNA Levels and Residual Viremia in a Population of Naïve Patients With More Than 4 Years of Effective Antiretroviral Therapy. Clin Microbiol Infect (2015) 21:288.e5–7. doi: 10.1016/j.cmi.2014.10.009 - DOI - PubMed

Publication types