. 2022 May 3:13:849329.
doi: 10.3389/fimmu.2022.849329. eCollection 2022.

PRI: Re-Analysis of a Public Mass Cytometry Dataset Reveals Patterns of Effective Tumor Treatments

Affiliations

PRI: Re-Analysis of a Public Mass Cytometry Dataset Reveals Patterns of Effective Tumor Treatments

Yen Hoang et al. Front Immunol. .

Abstract

Recently, mass cytometry has enabled quantification of up to 50 parameters for millions of cells per sample. It remains a challenge to analyze such high-dimensional data to exploit the richness of the inherent information, even though many valuable new analysis tools have already been developed. We propose a novel algorithm "pattern recognition of immune cells (PRI)" to tackle these high-dimensional protein combinations in the data. PRI is a tool for the analysis and visualization of cytometry data based on a three or more-parametric binning approach, feature engineering of bin properties of multivariate cell data, and a pseudo-multiparametric visualization. Using a publicly available mass cytometry dataset, we proved that reproducible feature engineering and intuitive understanding of the generated bin plots are helpful hallmarks for re-analysis with PRI. In the CD4+T cell population analyzed, PRI revealed two bin-plot patterns (CD90/CD44/CD86 and CD90/CD44/CD27) and 20 bin plot features for threshold-independent classification of mice concerning ineffective and effective tumor treatment. In addition, PRI mapped cell subsets regarding co-expression of the proliferation marker Ki67 with two major transcription factors and further delineated a specific Th1 cell subset. All these results demonstrate the added insights that can be obtained using the non-cluster-based tool PRI for re-analyses of high-dimensional cytometric data.

Keywords: combinatorial protein expression; high-dimensional cytometry data; mass cytometry data; multi-parametric analysis; pattern perception; re-analysis.


Conflict of interest statement

The authors declare that the research was conducted in the absence of any commercial or financial relationships that could be construed as a potential conflict of interest.

Figures

Figure 1
Figure 1
Schematic comparison of the analysis approach with the re-analysis approach. Comparison of the analysis approach of Spitzer et al. (14) and the re-analysis of the data with PRI. Both studies analysed the same publicly available datasets on tumor treatments, while our re-analysis was limited to blood samples from day three from mice. For this dataset, there were a total of four different treatments, which can be divided into the two groups effective and ineffective. Within the ineffective treatment group there were animals that received no treatment (untreated - untr.) and those that received an ineffective (ineff.; anti-PD-1) treatment. In addition, there were effective treatment1 (effective 1; IFN-γ + anti-CD40 + CD1-allo-IgG) and effective treatment2 (effective 2; IFN-γ + anti-CD40 + B6-allo-IgG). For details on the experimental setting see Spitzer et al. The original analysis used common tools in flow cytometry, such as scaffold maps and citrus as well as clustering to reduce dimensions. As a result, the authors found changes in the frequencies of clustered cell subsets. In our bin-based re-analysis (PRI approach) we found different patterns and properties of grouped cell subsets concerning frequencies and MSI (mean signal intensity).
Figure 2
Figure 2
Flowchart of the used PRI-analysis workflow. (A) The flowchart lists the step by step details. (B) Gating strategy focusing on selecting CD4 T helper cells – plots from left to the right show the identification of live single cells by using the signal of the iridium-DNA-intercalator and the negative expression of cisplatin represented by 195Pt. Left-over internal standard beads were excluded by using high 140Ce signal. CD45 as unique pan-leukocytic marker, and CD3 were used to detect T cells. The very right plot shows the discrimination of CD4 T helper cells from CD8 cytotoxic T cells.
Figure 3
Figure 3
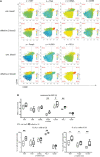
Identification of intensity bin-patterns and bin-values for the classification of mice receiving treatments with differential effects. (A) Comparison of the density and mean signal intensity (MSI)-bin patterns of two exemplary samples (untreated blood1 and effective 2 blood2) using semi-continuous binning with CD90 (x-axis) and CD44 (y-axis) and dynamic intensity ranges for z. (B) Statistical comparison of three different metrics as z parameter in PRI per sample: the frequency of the quadrant cells (left graph; black quadrant numbers of density plots), the maximal bin-MSI values of CD86 and CD27 (middle graph; max-bin values of the color-coded legend of MSI bin plots), and the frequencies of z+ cells per quadrants (right graph; red quadrant numbers of MSI-bin plots of all 11 samples). The ineffective treatment group with untreated (untr.) and ineffectively treated (ineff.) samples is shown in gray and the effective treatment group with effective treatment 1 and 2 in black. P < 0.05 was considered significant, with the numbers of asterisks indicating: *p ≤ 0.05; **p ≤ 0.01; ns stands for non-significant.
Figure 4
Figure 4
Cell subset characterization using side by side plots and common ranges for each z-parameter. (A) Comparison of mean signal intensity (MSI)-bin patterns of two exemplary samples (untreated blood1 and effective 2 blood2) for seven z parameters using common intensity ranges for z (min-max of both samples). (B) Statistical comparison of the maximum bin-MSI values per sample (PRI-analysis) and the frequencies of the quadrant cells in Q3 and Q4 (red quadrant numbers of the MSI-bin plots) of all 11 samples for seven z parameters. The ineffective treatment group with untreated (untr.) and ineffectively treated (ineff.) samples is shown in gray and the effective treatment group with effective treatment 1 and 2 in black. P < 0.05 was considered significant, with the numbers of asterisks indicating: *p ≤ 0.05; **p ≤ 0.01.
Figure 5
Figure 5
Analysis of the co-expression of the proliferation marker Ki67 and the master transcription factors Tbet and Foxp3. (A) Analysis of bin patterns for mean signal intensity of z+ cells (MSI+) using one exemplary sample for effective therapy (effective 2 blood2) for Ki67, Tbet and Foxp3 using dynamic ranges for each sample. (B) Pie charts show differences in Ki67 co-expression between the two exemplary samples (untreated blood1 and effective 2 blood2).

References

    1. Lugli E, Roederer M, Cossarizza A. Data Analysis in Flow Cytometry: The Future Just Started. Cytometry A (2010) 77(7):705–13. doi: 10.1002/cyto.a.20901 - DOI - PMC - PubMed
    1. Newell EW, Cheng Y. Mass Cytometry: Blessed With the Curse of Dimensionality. Nat Immunol (2016) 17(8):890–5. doi: 10.1038/ni.3485 - DOI - PubMed
    1. Mair F, Hartmann FJ, Mrdjen D, Tosevski V, Krieg C, Becher B. The End of Gating? An Introduction to Automated Analysis of High Dimensional Cytometry Data. Eur J Immunol (2016) 46(1):34–43. doi: 10.1002/eji.201545774 - DOI - PubMed
    1. Becht E, McInnes L, Healy J, Dutertre CA, Kwok IWH, Ng LG, et al. . Dimensionality Reduction for Visualizing Single-Cell Data Using UMAP. Nat Biotechnol (2018) 37:38–44. doi: 10.1038/nbt.4314 - DOI - PubMed
    1. Amir el AD, Davis KL, Tadmor MD, Simonds EF, Levine JH, Bendall SC, et al. . viSNE Enables Visualization of High Dimensional Single-Cell Data and Reveals Phenotypic Heterogeneity of Leukemia. Nat Biotechnol (2013) 31(6):545–52. doi: 10.1038/nbt.2594 - DOI - PMC - PubMed

Publication types

Substances