

PRKAR1A and SDCBP Serve as Potential Predictors of Heart Failure Following Acute Myocardial Infarction
- PMID: 35592331
- PMCID: PMC9110666
- DOI: 10.3389/fimmu.2022.878876
PRKAR1A and SDCBP Serve as Potential Predictors of Heart Failure Following Acute Myocardial Infarction
Abstract
Background and objectives: Early diagnosis of patients with acute myocardial infarction (AMI) who are at a high risk of heart failure (HF) progression remains controversial. This study aimed at identifying new predictive biomarkers of post-AMI HF and at revealing the pathogenesis of HF involving these marker genes.
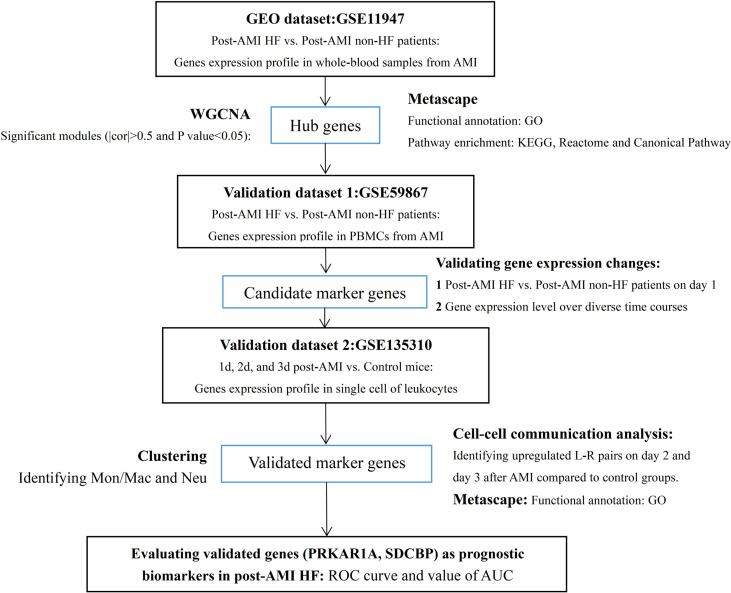
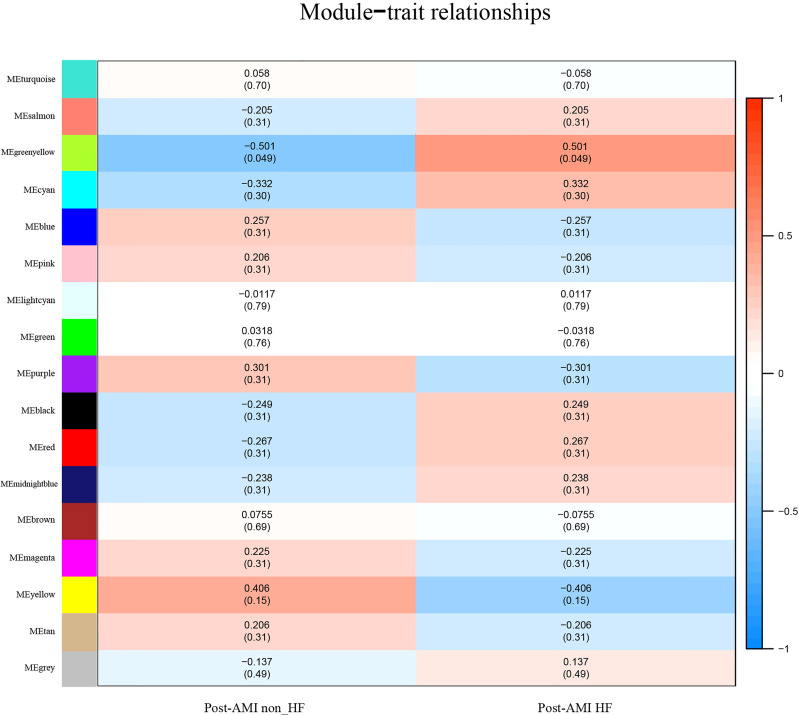
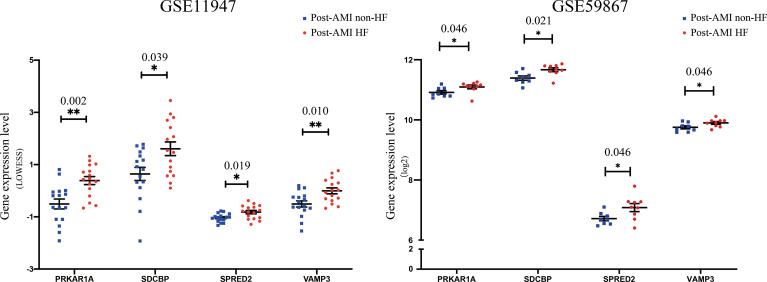
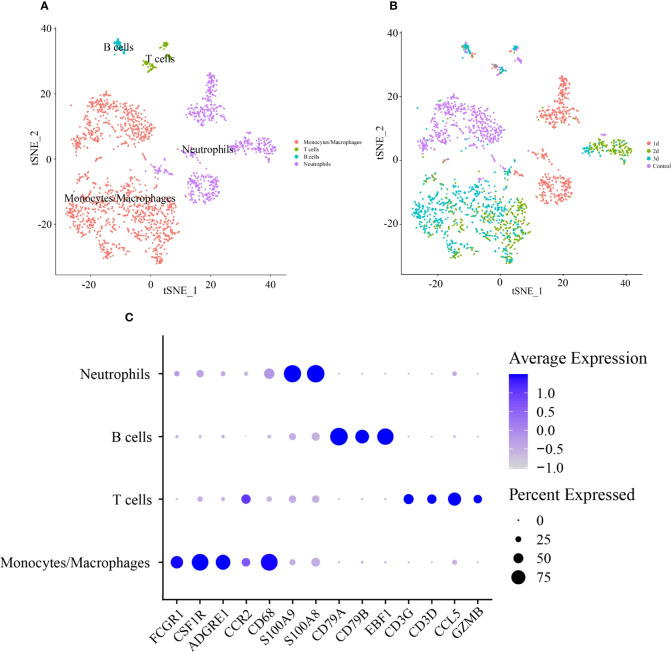
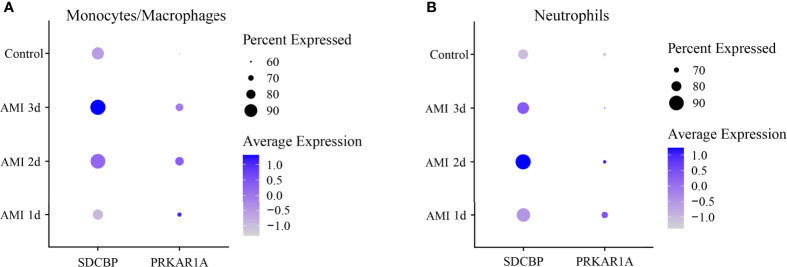
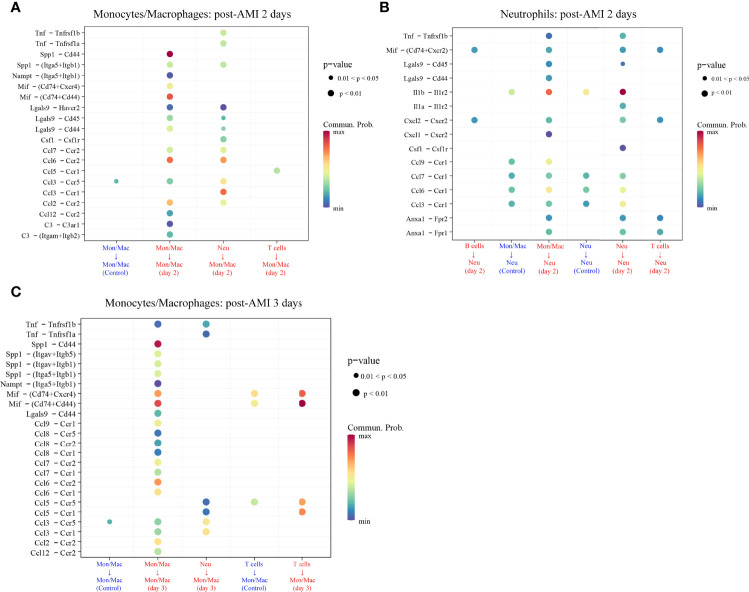
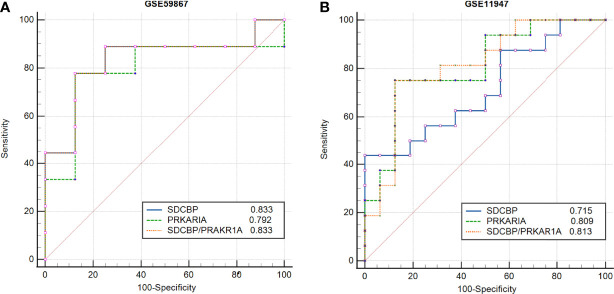
Methods and results: A transcriptomic dataset of whole blood cells from AMI patients with HF progression (post-AMI HF, n = 16) and without progression (post-AMI non-HF, n = 16) was analyzed using the weighted gene co-expression network analysis (WGCNA). The results indicated that one module consisting of 720 hub genes was significantly correlated with post-AMI HF. The hub genes were validated in another transcriptomic dataset of peripheral blood mononuclear cells (post-AMI HF, n = 9; post-AMI non-HF, n = 8). PRKAR1A, SDCBP, SPRED2, and VAMP3 were upregulated in the two datasets. Based on a single-cell RNA sequencing dataset of leukocytes from heart tissues of normal and infarcted mice, PRKAR1A was further verified to be upregulated in monocytes/macrophages on day 2, while SDCBP was highly expressed in neutrophils on day 2 and in monocytes/macrophages on day 3 after AMI. Cell-cell communication analysis via the "CellChat" package showed that, based on the interaction of ligand-receptor (L-R) pairs, there were increased autocrine/paracrine cross-talk networks of monocytes/macrophages and neutrophils in the acute stage of MI. Functional enrichment analysis of the abovementioned L-R genes together with PRKAR1A and SDCBP performed through the Metascape platform suggested that PRKAR1A and SDCBP were mainly involved in inflammation, apoptosis, and angiogenesis. The receiver operating characteristic (ROC) curve analysis demonstrated that PRKAR1A and SDCBP, as well as their combination, had a promising prognostic value in the identification of AMI patients who were at a high risk of HF progression.
Conclusion: This study identified that PRKAR1A and SDCBP may serve as novel biomarkers for the early diagnosis of post-AMI HF and also revealed their potentially regulatory mechanism during HF progression.
Keywords: acute myocardial infarction; biomarkers; cell–cell communication; heart failure; leukocytes.
Copyright © 2022 Chen, Su, Liu, Gao, Chen, Yin and Li.
Conflict of interest statement
The authors declare that the research was conducted in the absence of any commercial or financial relationships that could be construed as a potential conflict of interest.
Figures

Similar articles
-
Identification of monocyte-associated genes as predictive biomarkers of heart failure after acute myocardial infarction.BMC Med Genomics. 2021 Feb 9;14(1):44. doi: 10.1186/s12920-021-00890-6. BMC Med Genomics. 2021. PMID: 33563285 Free PMC article.
-
Identification of biomarkers and immune infiltration in acute myocardial infarction and heart failure by integrated analysis.Biosci Rep. 2023 Jul 26;43(7):BSR20222552. doi: 10.1042/BSR20222552. Biosci Rep. 2023. PMID: 37334672 Free PMC article.
-
Weighted Gene Co-Expression Network Analysis Identifies Critical Genes in the Development of Heart Failure After Acute Myocardial Infarction.Front Genet. 2019 Nov 26;10:1214. doi: 10.3389/fgene.2019.01214. eCollection 2019. Front Genet. 2019. PMID: 31850068 Free PMC article.
-
Peripheral neutrophils and naive CD4 T cells predict the development of heart failure following acute myocardial infarction: A bioinformatic study.Rev Port Cardiol (Engl Ed). 2021 Nov;40(11):839-847. doi: 10.1016/j.repce.2021.11.002. Rev Port Cardiol (Engl Ed). 2021. PMID: 34857156
-
Metabolic signatures in post-myocardial infarction heart failure, including insights into prediction, intervention, and prognosis.Biomed Pharmacother. 2024 Jan;170:116079. doi: 10.1016/j.biopha.2023.116079. Epub 2023 Dec 26. Biomed Pharmacother. 2024. PMID: 38150879 Review.
Cited by
-
Differentially expressed platelet activation-related genes in dogs with stage B2 myxomatous mitral valve disease.BMC Vet Res. 2023 Dec 13;19(1):271. doi: 10.1186/s12917-023-03789-9. BMC Vet Res. 2023. PMID: 38087280 Free PMC article.
-
FTH1- and SAT1-Induced Astrocytic Ferroptosis Is Involved in Alzheimer's Disease: Evidence from Single-Cell Transcriptomic Analysis.Pharmaceuticals (Basel). 2022 Sep 22;15(10):1177. doi: 10.3390/ph15101177. Pharmaceuticals (Basel). 2022. PMID: 36297287 Free PMC article.
-
From multi-omics approaches to personalized medicine in myocardial infarction.Front Cardiovasc Med. 2023 Oct 30;10:1250340. doi: 10.3389/fcvm.2023.1250340. eCollection 2023. Front Cardiovasc Med. 2023. PMID: 37965091 Free PMC article. Review.
-
Extracellular matrix gene set and microRNA network in intestinal ischemia-reperfusion injury: Insights from RNA sequencing for diagnosis and therapy.World J Gastrointest Surg. 2025 Feb 27;17(2):100034. doi: 10.4240/wjgs.v17.i2.100034. World J Gastrointest Surg. 2025. PMID: 40062000 Free PMC article. Review.
-
Quercetin in Shengxian Decoction exhibits anti-ferroptosis protective roles in a myocardial infarction model via targeting DPP4/ HMOX1, based on network pharmacology and molecular docking.Front Pharmacol. 2025 Apr 29;16:1583509. doi: 10.3389/fphar.2025.1583509. eCollection 2025. Front Pharmacol. 2025. PMID: 40365322 Free PMC article.
References
-
- Laribi S, Aouba A, Nikolaou M, Lassus J, Cohen-Solal A, Plaisance P, et al. Trends in Death Attributed to Heart Failure Over the Past Two Decades in Europe. Eur J Heart Fail (2012) 14(3):234–9. - PubMed
-
- Kelly DJ, Gershlick T, Witzenbichler B, Guagliumi G, Fahy M, Dangas G, et al. Incidence and Predictors of Heart Failure Following Percutaneous Coronary Intervention in ST-Segment Elevation Myocardial Infarction: The HORIZONS-AMI Trial. Am Heart J (2011) 162(4):663–70. - PubMed
Publication types
MeSH terms
Substances
LinkOut - more resources
Full Text Sources
Medical
Research Materials
Miscellaneous